2212
Automated Segmentation of Right Ventricle in CMR Images based on Dense and Multi-scale U-net Network1University of Shanghai for Science and Technology, Shanghai, China
Synopsis
It is essential to segment right
ventricle (RV) for evaluating cardiac functional parameters of cardiac diseases
in clinical diagnosis and prognosis. However, the complex structure of RV makes
traditional segmentation methods not so effective in right ventricular
segmentation. A new Dense and Multi-scale U-net deep learning method is
proposed to segment right ventricle in cine cardiac magnetic resonance (CMR) short-axis
images automatically, which shows high coincidence and small difference with
manual segmentation and is promising for diagnosis and analysis of clinical
cardiac diseases.
Introduction
Quick and effective evaluation of cardiac function plays an important role in cardiovascular diseases (CVDs) diagnosis. Deep learning is becoming more and more widely used in various fields like pattern recognition, image classification, semantic segmentation and, etc. Deep learning methods are always adopted to extract cardiac features for more accurate and effective segmentation. The aim of this study is to establish a deep learning network model for automatic segmentation of right ventricle in cine CMR short-axis images. Accurate contours and clinical parameters can be obtained to assist cardiac function analysis and disease diagnosis.Materials and Methods
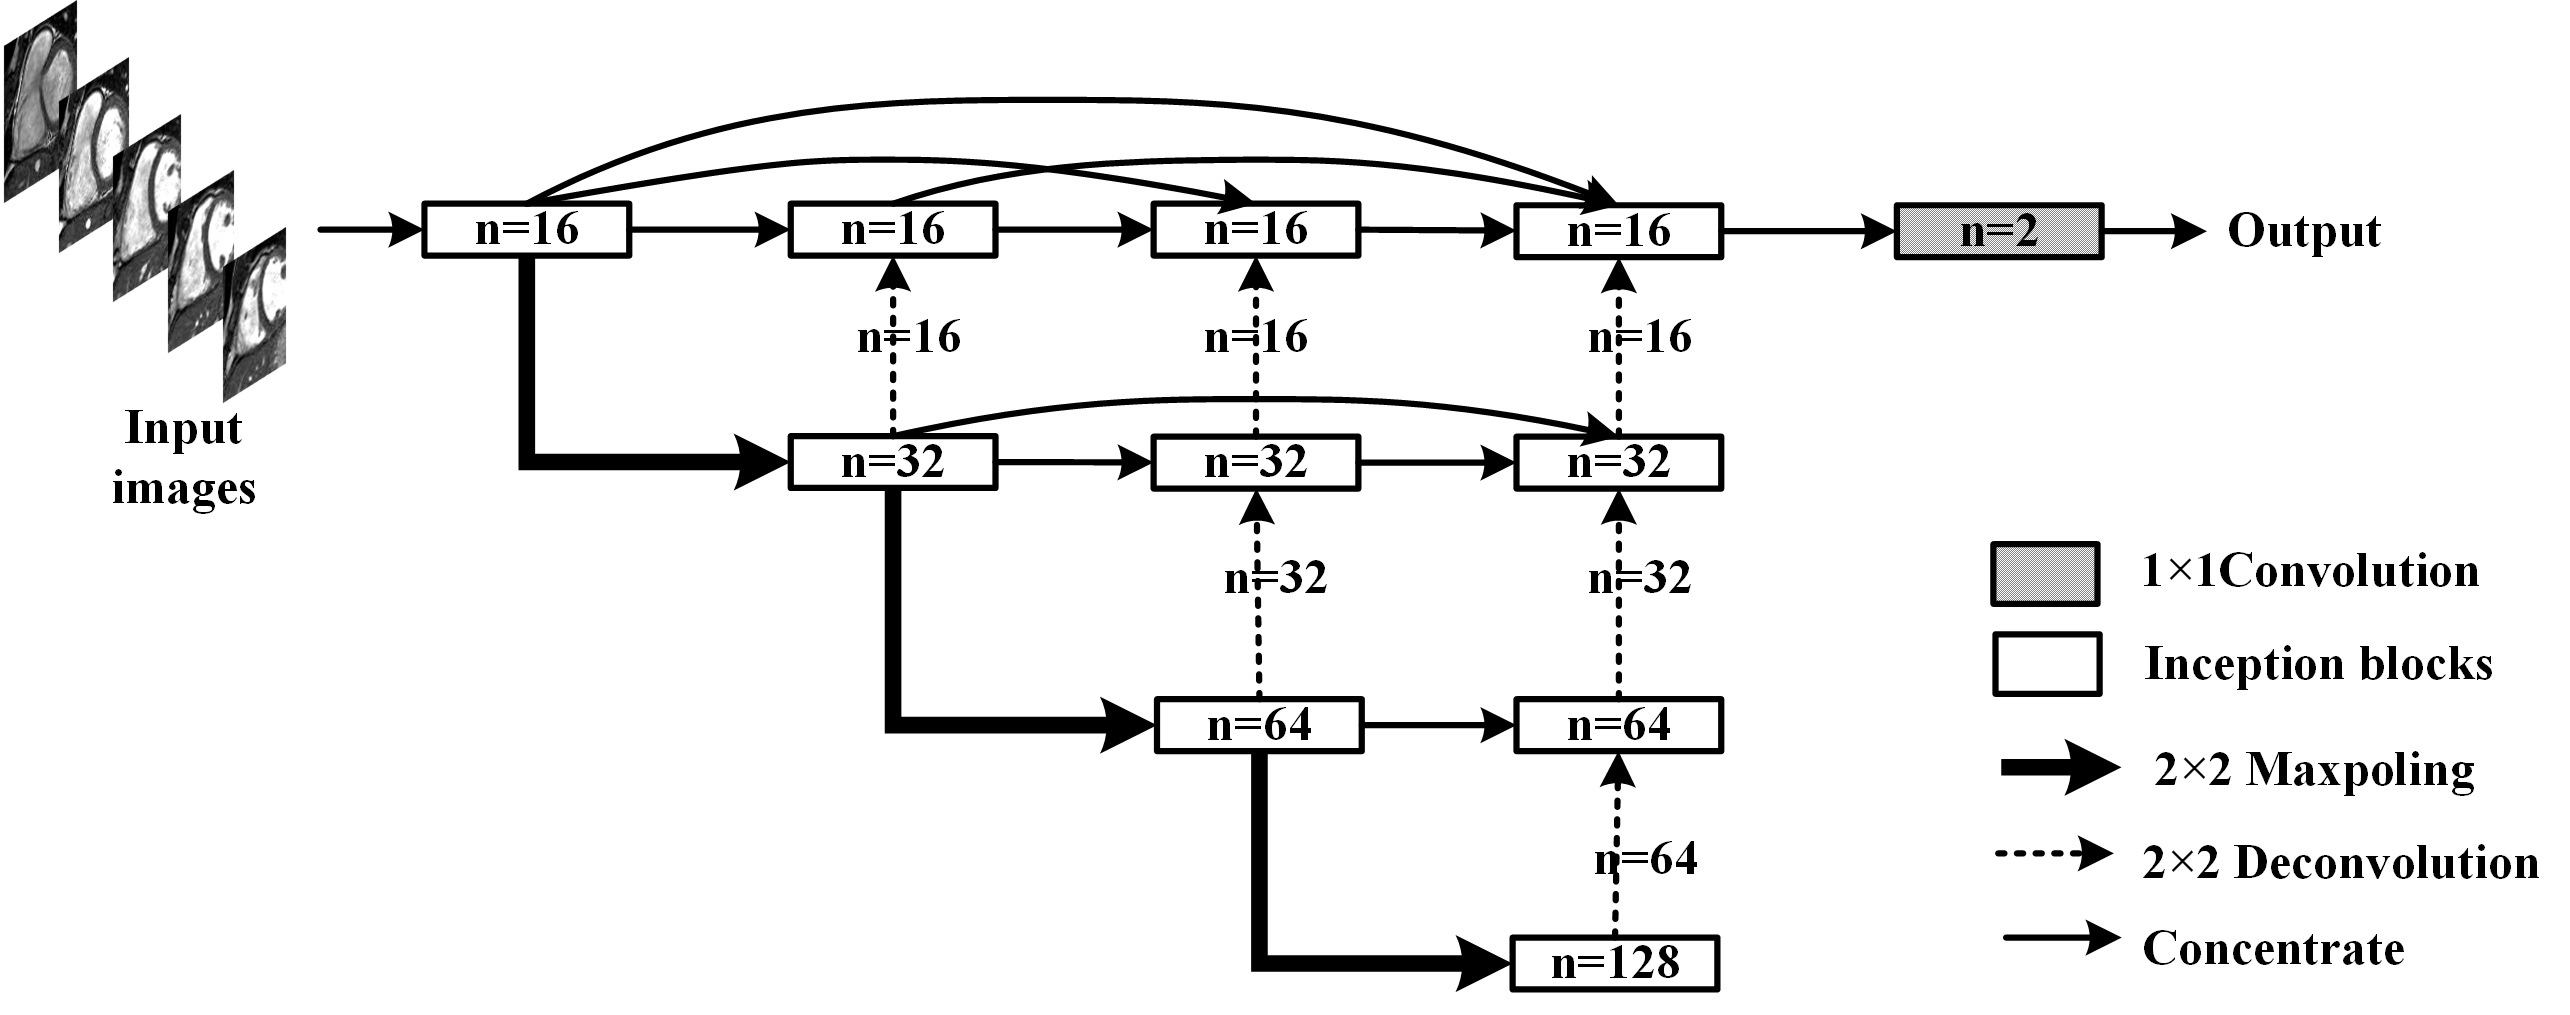
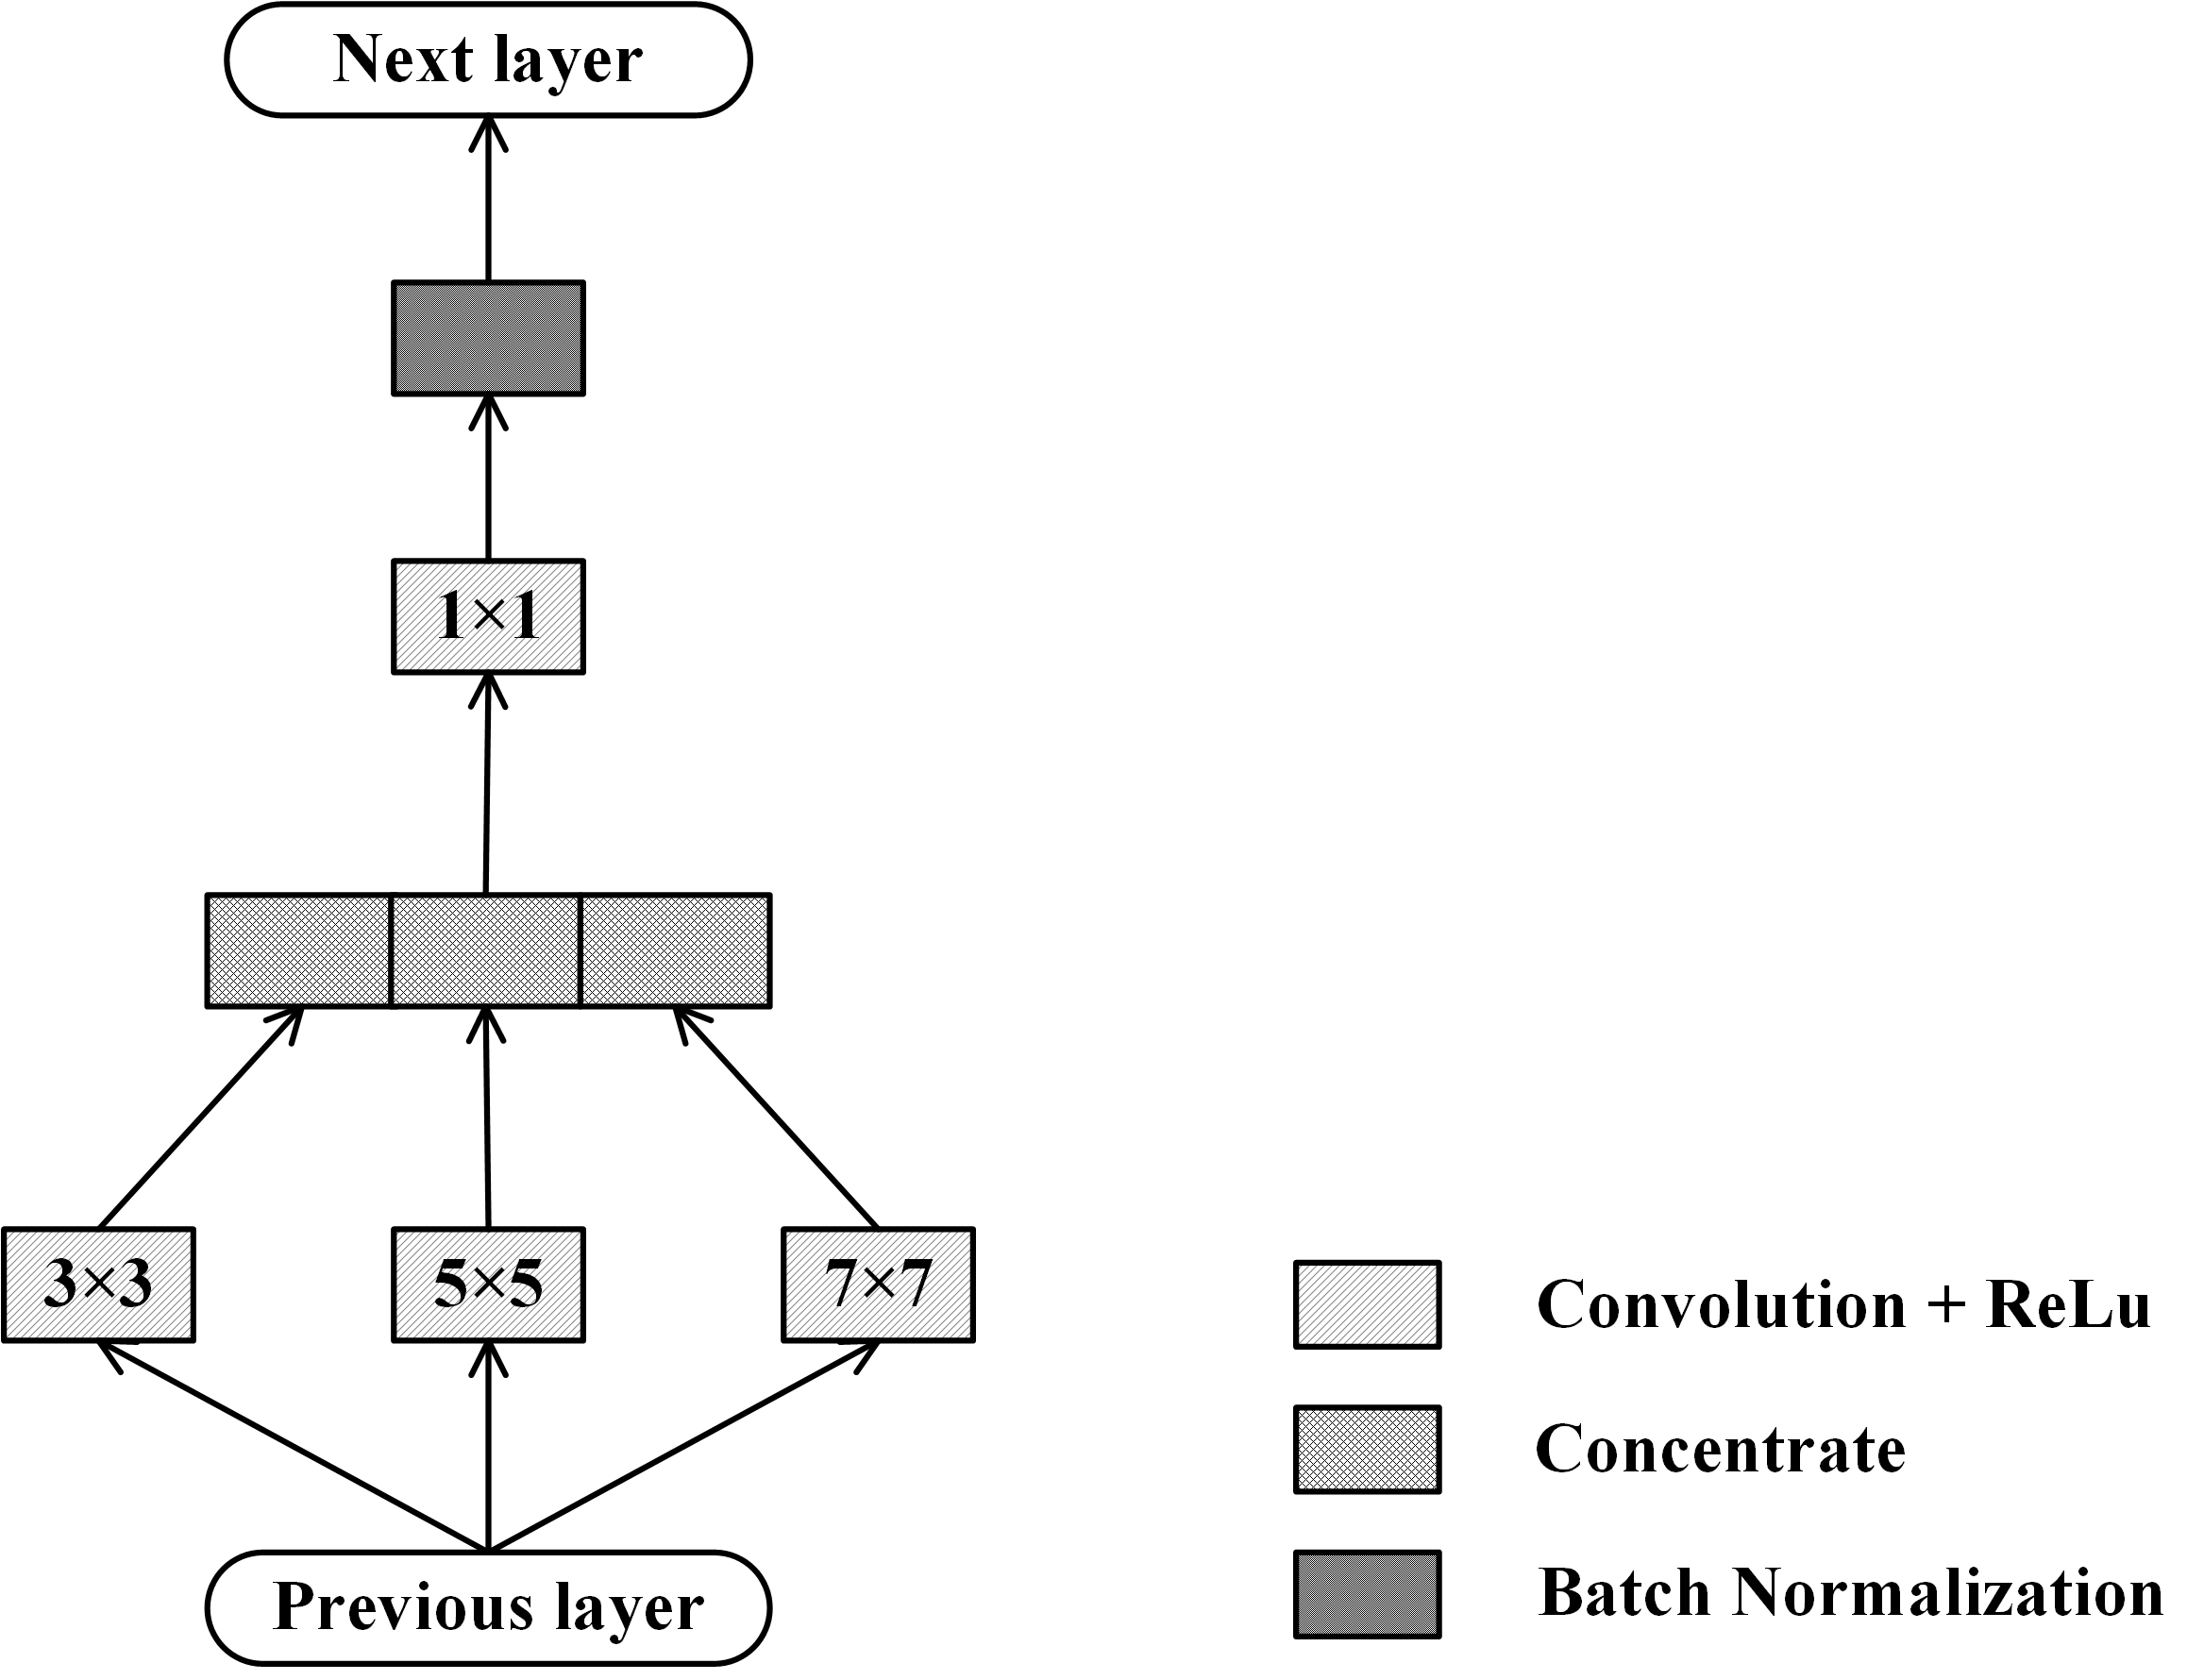
The proposed deep learning network, Dense and Multi-scale U-net (DMU-net), is inspired by U-net++1 and inception block2. The architecture of DMU-net is shown in Fig 1, consisting of encoder, decoder and skip-connections. Encoder is used to down sample the images and extract features of RV, which are propagated to the decoder by skip-connections. The decoder receives features of diverse complexity, and reconstructs the dimension by up-sampling. The skip-connections of DMU-net refers to the re-designed skip-connections in the U-net++. The long skip-connections in the U-net3 is replaced by a series of nested dense blocks, therefore, the network can learn to fuse local and global information in CMR images slices. In addition, to select the appropriate convolution kernel, the block of inception structure and batch-normalization (BN) (Fig 2) is used to replace convolution layers. In Fig 1, the re-designed skip-connection is defined as: $$x^{i,j}=\begin{cases}I\left(x^{i-1,j}\right) & j = 0\\I\left(\left[\left[x^{i,k}\right]_{k=0}^{j-1},U\left(x^{i+1,j-1}\right)\right]\right) & j > 0\end{cases} (1)$$ Where $$$x^{i,j}$$$ represents the output of inception blocks, $$$i$$$ is the number of down-sampling layers and $$$j$$$ is the module in the skip-connections. $$$I\left(\cdot\right)$$$ is the corresponding operation in the blocks, $$$U\left(\cdot\right)$$$ is up-sampling and $$$\left[\cdot\right]$$$ represents connection operation.According to Fig 1, the whole segmentation process includes three steps. First, CMR images are normalized, enhanced and region of interest are extracted. Secondly, DMU-net is trained by training sets and adjusted by validation sets to get appropriate parameters for effectively extracting the features of different RV. Then, the DMU-net is used to predict the testing sets and the predicted results are binarized with a threshold of 0.5 to obtain RV. During the training process, Dice metric (DM), which is usually used to evaluate the segmentation results, is employed as loss function. It was an indicator to measure the similarity or overlap between the predicted contours and ground truth, and is defined as:$$DM\left(y_{n},\widehat{y_{n}}\right)=\frac{2\mid y_{n}\cap\widehat{y_{n}}\mid}{\mid y_{n}\mid+\mid\widehat{y_{n}}\mid} (2)$$ where $$$y_{n}$$$ is the predicted results and $$$\widehat{y_{n}}$$$ is the ground truth. The closer the index approaches 1, the better the result is. The weights of network are learnt by minimizing the loss function, so we define the complement of Dice as the loss function: $$L\left(w\right)=1-DM\left(y_{n},\widehat{y_{n}}\right) (3)$$
A retrospective analysis on 71 randomly selected CMR short-axis images is conducted with IRB approval. These images are obtained by steady-date free precession (SSFP) sequence and include 49 males and 22 females (aged from 23 to 93 years old). 42 patients are selected randomly as training sets and 14 patients as validation sets to train network and adjust the parameters. 15 patients are selected as test sets. The predicted results are evaluated by DM and Harsdorf Distance (HD). DM is defined as eq (2) and HD measures the distance of predicted contour and ground truth, which is defined as: $$HD\left(A,B\right)=\max\left(\max_{a\in A}\left(\min_{b\in B}d\left(a,b\right)\right),\max_{b\in B}\left(\min_{a\in A}d\left(a,b\right)\right)\right) (4)$$ where $$$A$$$ denotes the predicted contour and $$$B$$$ denotes ground truth, $$$d\left(\cdot,\cdot\right)$$$ is the Euclidean distance. In addition, the predicted results are compared with manual segmentation and Cardiovascular Imaging (CVI) software, which is used in clinic, to evaluate the clinical parameters.
Results
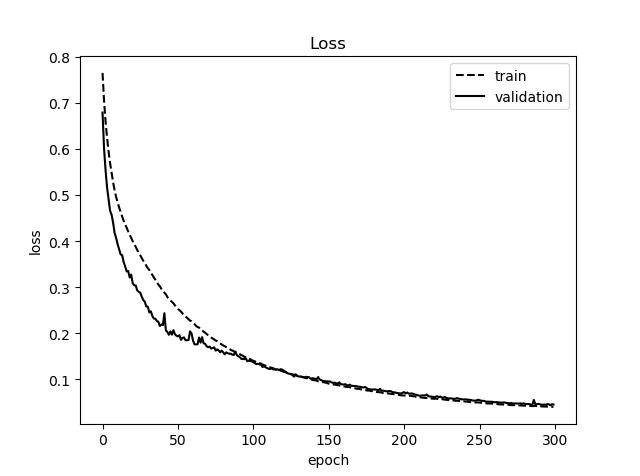
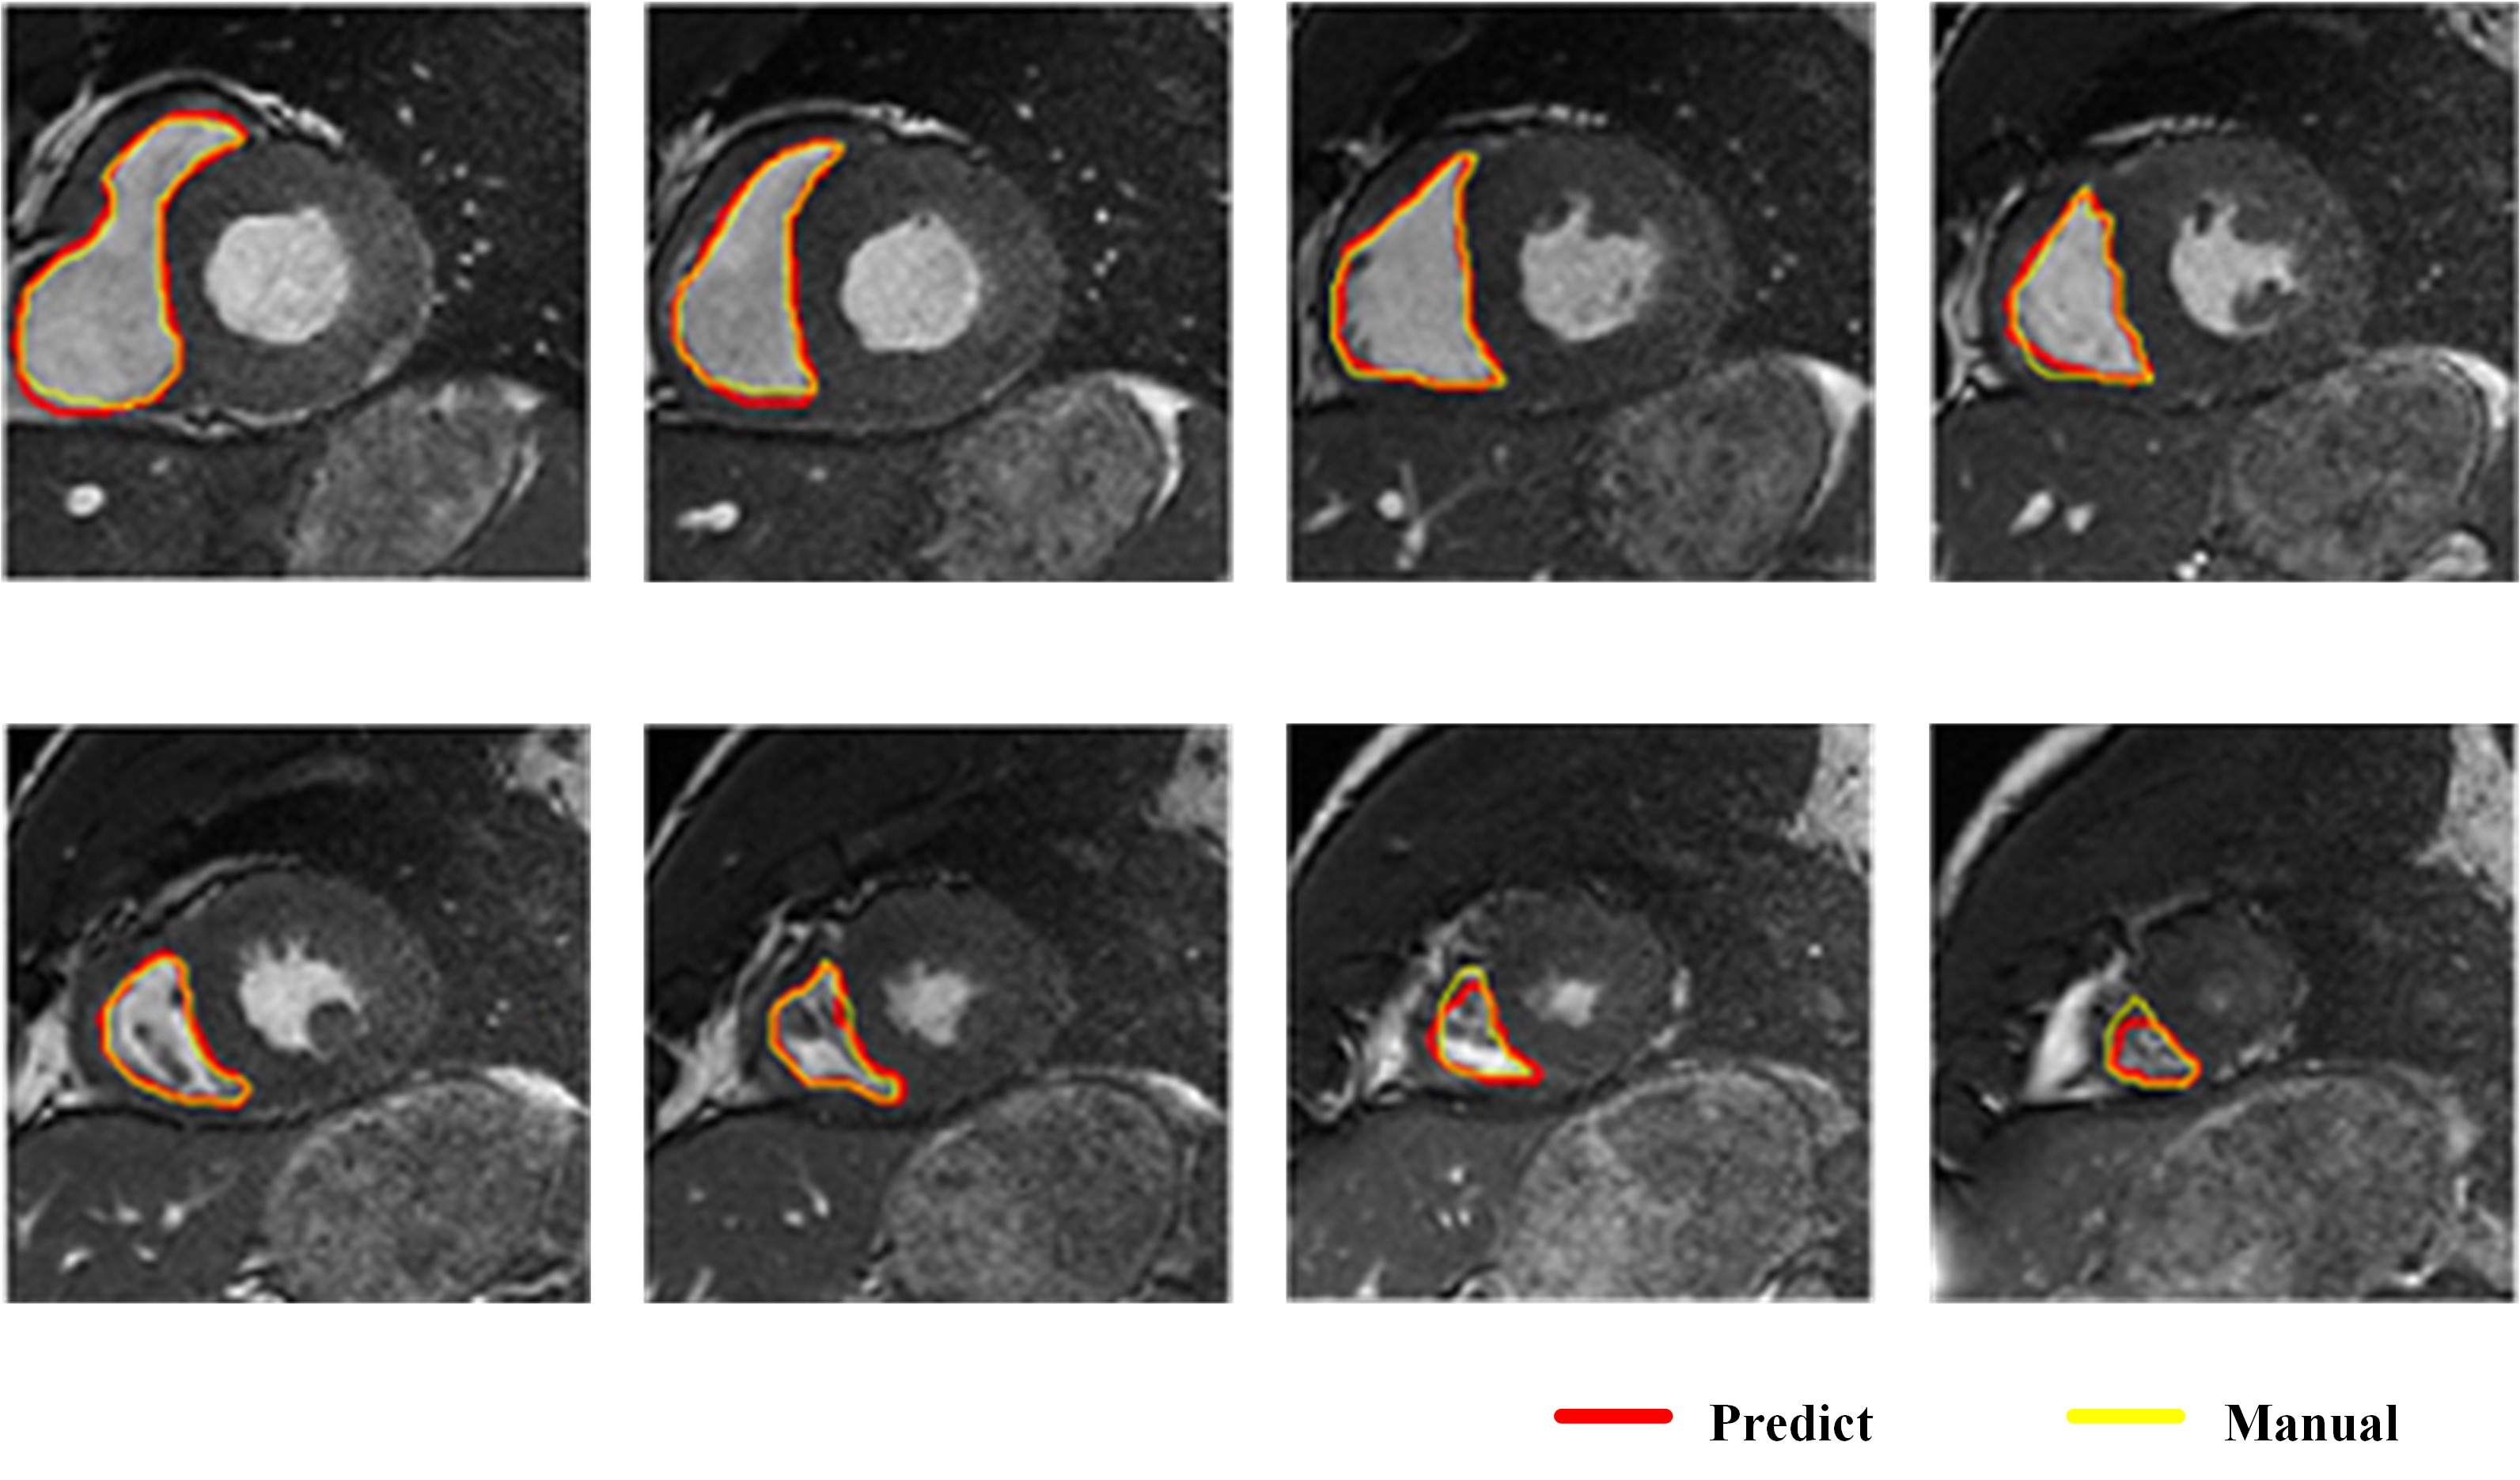
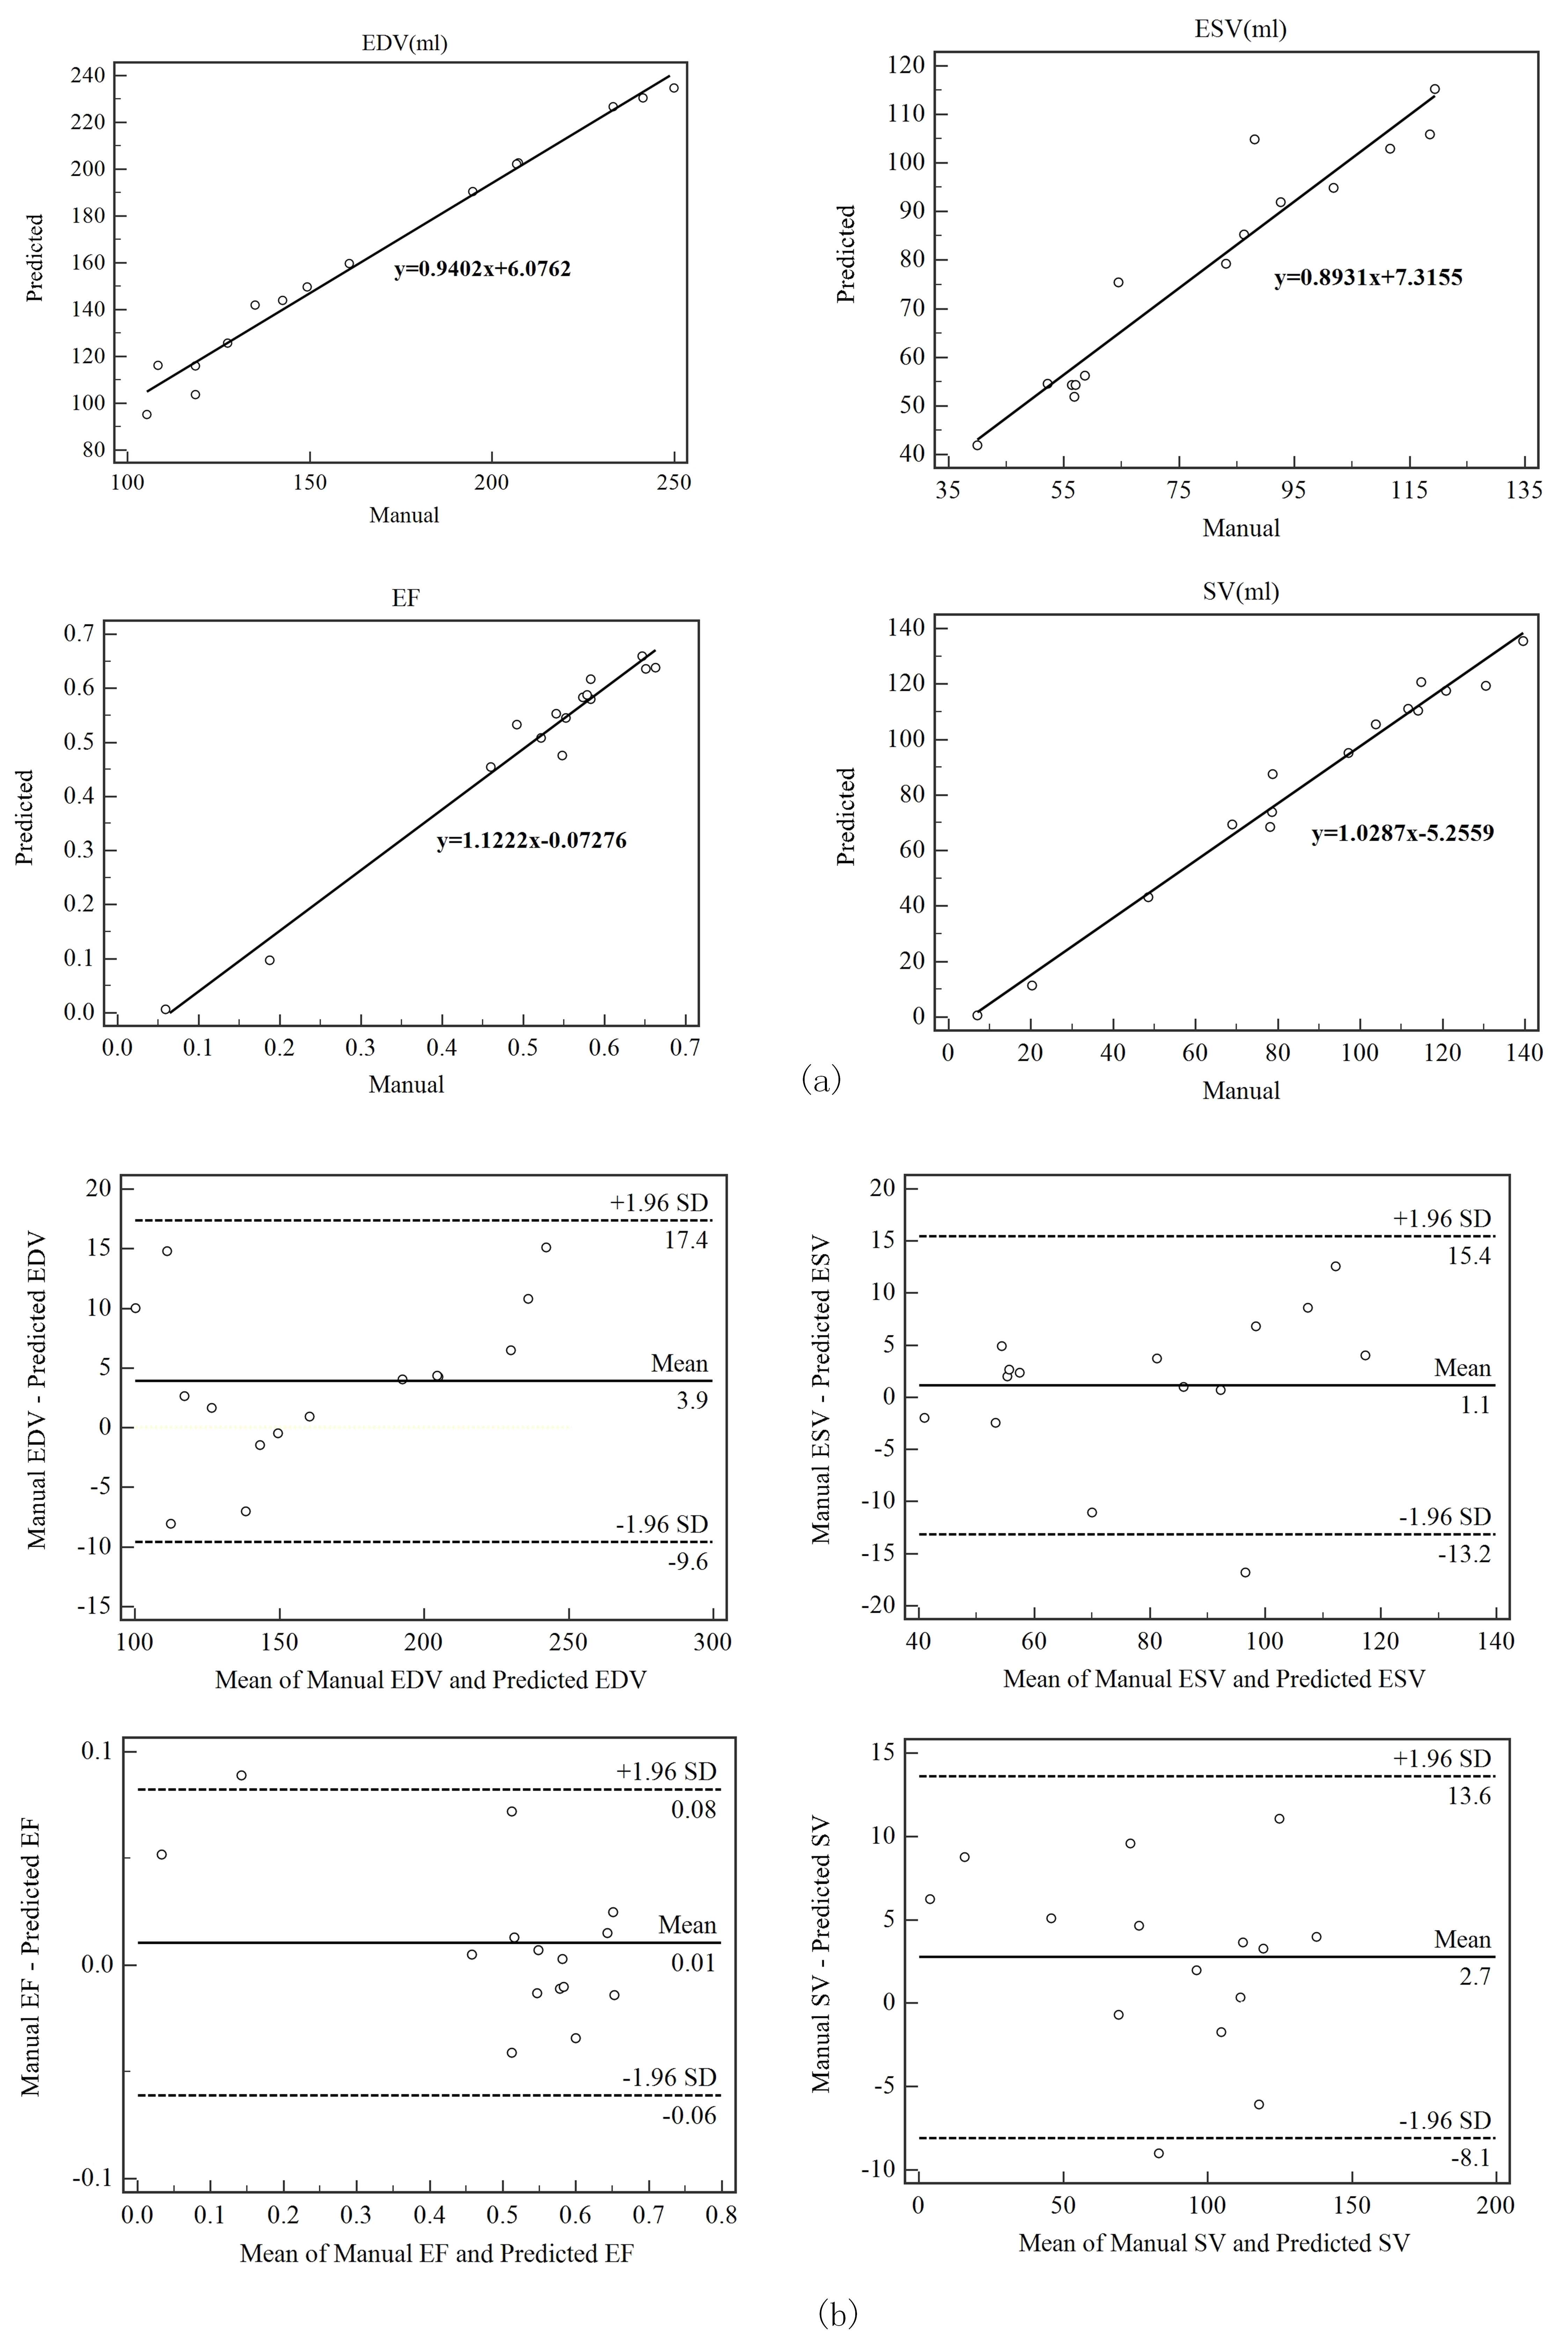
Loss curves of training sets and validation sets after training network are shown in Fig 3, and the loss rate can be reduced to 0.02. Classical segmentation results from RV apex to base at ES are shown in Fig 4. The average DM of 15 patients is 0.898 at end-diastolic (ED) and 0.826 at end-systolic (ES). The average HD is 4.142mm at ED and 4.739mm at ES. Clinical parameters including end-diastolic volume (EDV), end-systolic volume (ESV), eject fraction (EF) and stroke volume (SV) induced from predicted results are calculated. The correlation and Bland-Altman analysis between the ground truth and predicted contours are shown in Fig 5. The correlation coefficients(R) of EDV, ESV, EF and SV are 0.9918、0.9603、0.9874 and 0.9819 and most of the results are acceptable for clinical diagnosis within 95% limits of agreements. The coefficients of CVI (http://www.circlecvi.com/) are 0.9078 (EDV), 0.7377 (ESV), 0.8324 (EF) and 0.7974 (SV). Compared with CVI, DMU-net has better relevance and consistency with manual segmentation.Conclusions
The proposed DMU-net network is connected and aggregated the shallow and deep features. The results obtained by DMU-net has high coincidence and small difference with manual segmentation. It is promising for diagnosis and analysis of clinical cardiac diseases. However, there are still some problems such as inaccurate segmentation on abnormal hearts, which could be solved by expanding the datasets. Combining priori knowledge has positive effect for the problems of ambiguous boundary. Moreover, 2D network is further extended to 3D network to segment and reconstruct 3D data for better application in clinical research.Acknowledgements
This work was supported by the Shanghai Committee of Science and Technology, China (Grant No. 17411953300).References
1. Zhou Z W, Siddiquee M M R, Tajbakhsh N, Liang J M. UNet plus plus: A Nested U-Net Architecture for Medical Image Segmentation. LNCS.2018;11045:3-11.
2. Szegedy C , Liu W , Jia Y , et al. Going Deeper with Convolutions.CVPR,2015:1-9.
3. Ronneberger, O,Fischer, P,Brox, T. U-Net: Convolutional Networks for Biomedical Image Segmentation.LNCS.2015;9351:234-241.
Figures