2210
A Robust Deep-Learning-based Automated Cardiac Resting Phase Detection: Validation in a Prospective Study1Department of Computer Science, Pattern Recognition Lab, Friedrich-Alexander-Universität Erlangen-Nürnberg, Erlangen, Germany, 2Magnetic Resonance, Siemens Healthcare GmbH, Erlangen, Germany, 3Siemens Medical Solutions USA, Inc, Princeton, NJ, United States, 4Diagnostikum Berlin, Berlin, Germany
Synopsis
The detection of a window with the least motion, e.g. end-systolic or end-diastolic resting phases (RPs) within the cardiac cycle is necessary for data acquisition for static cardiac imaging. In the current workflow, it is manually performed on CINE images by visual inspection. To automate the workflow, we propose an improved Deep-Learning-based automated localized RP detection. While the first step is responsible to localize the anatomy of interest, the second is to quantify motion within the target, and third is to classify RPs. We validated the system with a prospective volunteer study and achieved accuracy in the range of 28ms.
Introduction
Static cardiac imaging usually requires the operator to select a cardiac resting phase (RP) for acquisition, e.g. by visual inspection of a CINE series. Ideally, the RP should be localized to the anatomy of interest as different anatomies rest at different times of the cardiac cycle. The detection requires expert experience, so an automated detection of localized RPs for the anatomy of interest is desirable. In this study, we focus on improving the robustness of a previously published automated system1 which detects localized RPs for specific anatomies and validating the system with a prospective volunteer study.Methods
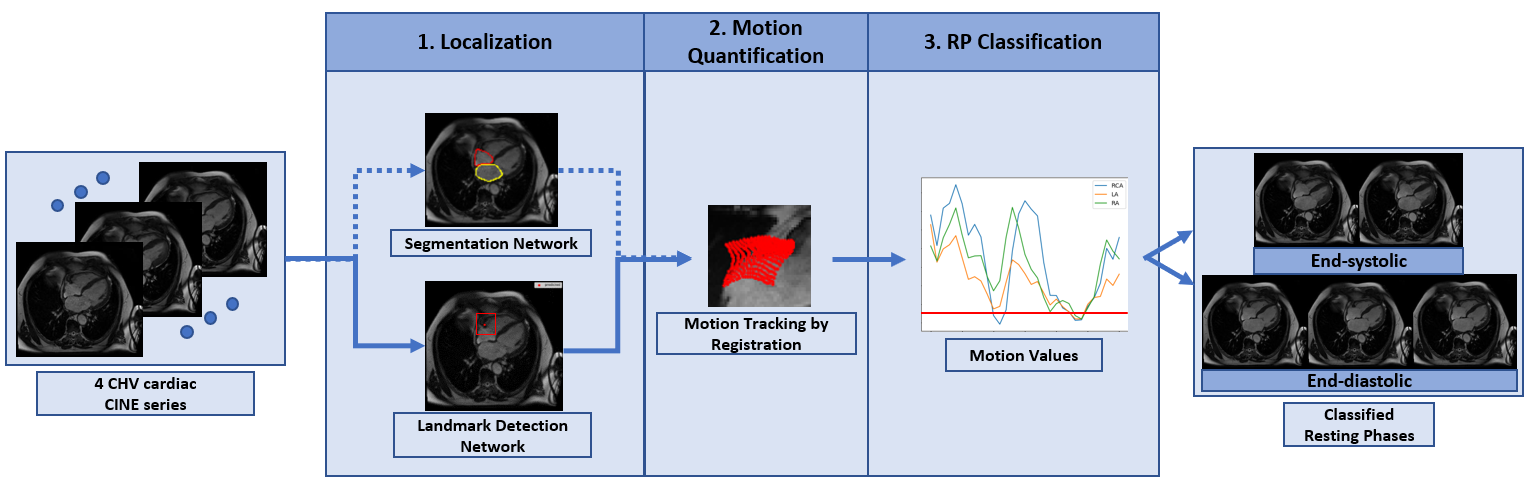
The proposed prototype system consists of three main steps (Fig.1). First, the localization of the regions of interest (ROI) is performed. Second, motion is tracked quantitatively within the ROI in the time-resolved CINE series. Third, the quantitative motion curve is used to classify RPs. In this abstract, we focused on the detection of the right coronary artery (RCA) as our ROI.1. Localization
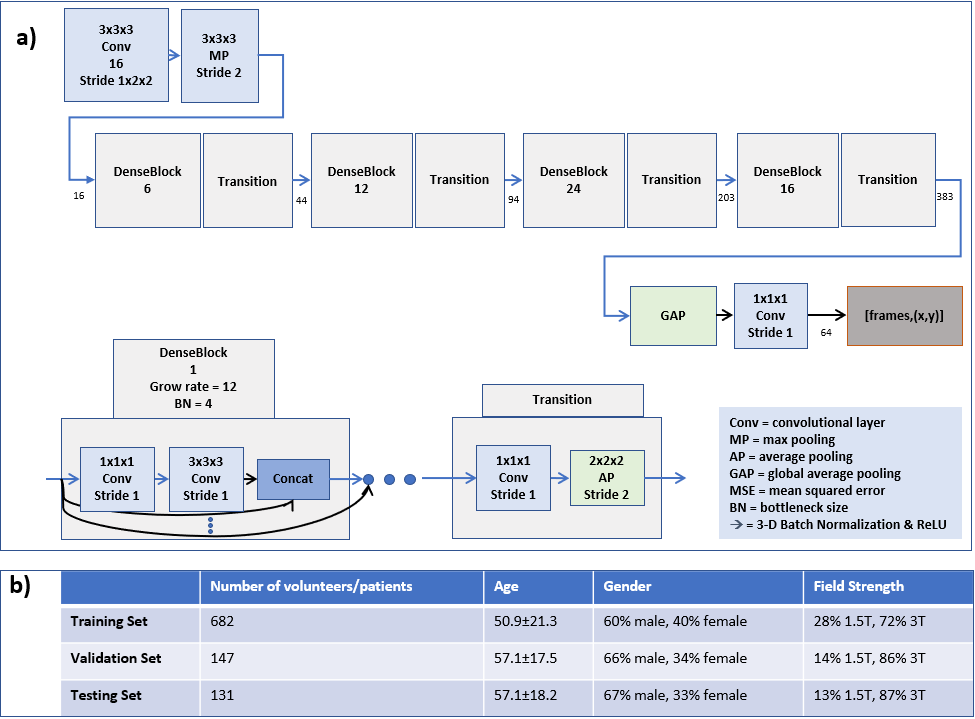
All four-chamber-view (4CHV) CINE series for training the network were interpolated to a fixed spatial and temporal resolution, $$$224\times224\times32$$$. Compared to previous work1, the RCA detection network was updated to a fully convolutional 3-D-DenseNet122 (Fig.2a). A fixed-size bounding box of $$$60\times60\,mm$$$ (based on prior knowledge about the range of motion of the RCA) was centered at the detected landmark positions over time.
2. Motion quantification
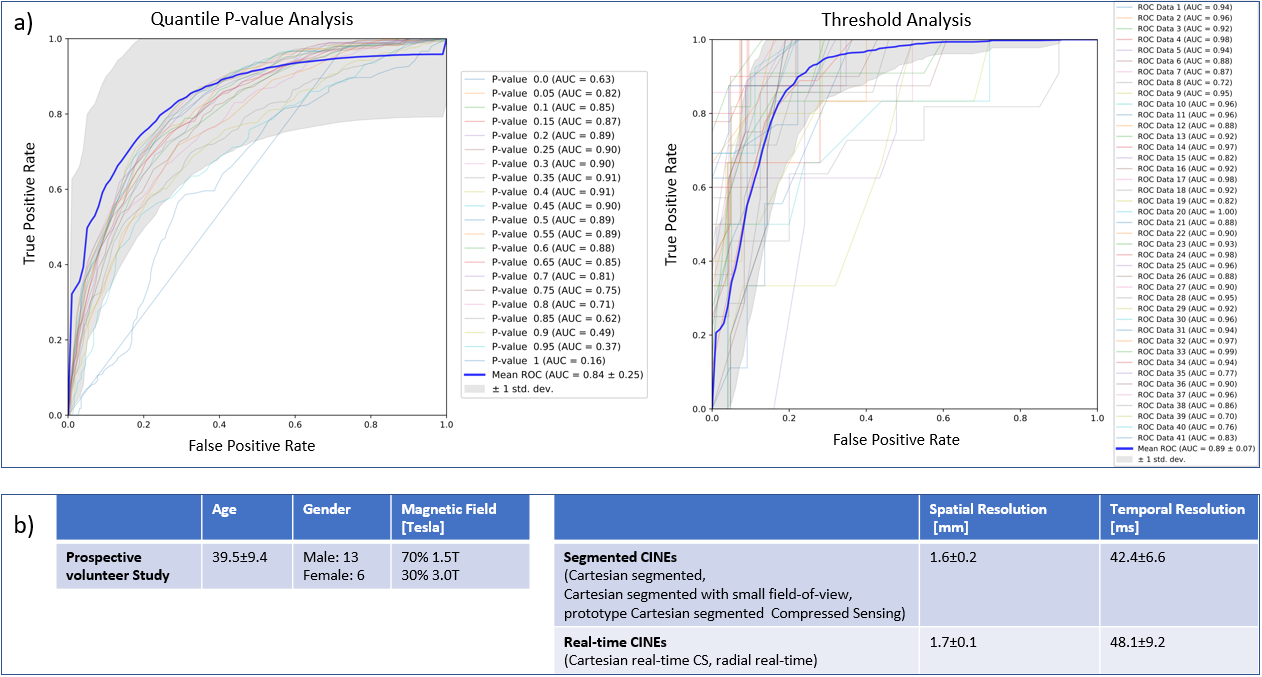
The deformation vectors describing the displacement between consecutive timepoints within the RCA ROI were obtained by performing the image registration2. The motion values were calculated as the 35th percentile of the magnitudes of the vectors. This percentile was chosen based on sensitivity and specificity analysis of the different percentiles’ ability to classify RPs (Fig.3a). Thus, a motion curve with one motion value per timepoint can be computed.
3. RP Classification
As the motion curve describes the motion in millimeters, RPs are classified by selecting the quiescent window with an absolute threshold, $$$<0.15\,mm$$$, calculated based on sensitivity and specificity analysis (Fig.3a).
Data for Neural Network Training
The CINE data (940 patients and 20 volunteers) used for training and evaluating the system was acquired on 1.5T and 3T clinical MRI scanners (MAGNETOM Avanto, Trio, Aera, Skyra; Siemens Healthcare, Erlangen, Germany). Ground-truth RCA annotations on the testing set were used for localization evaluation. RPs were annotated by an expert on 21 cases and used for evaluating the RP classification.Prospective Study
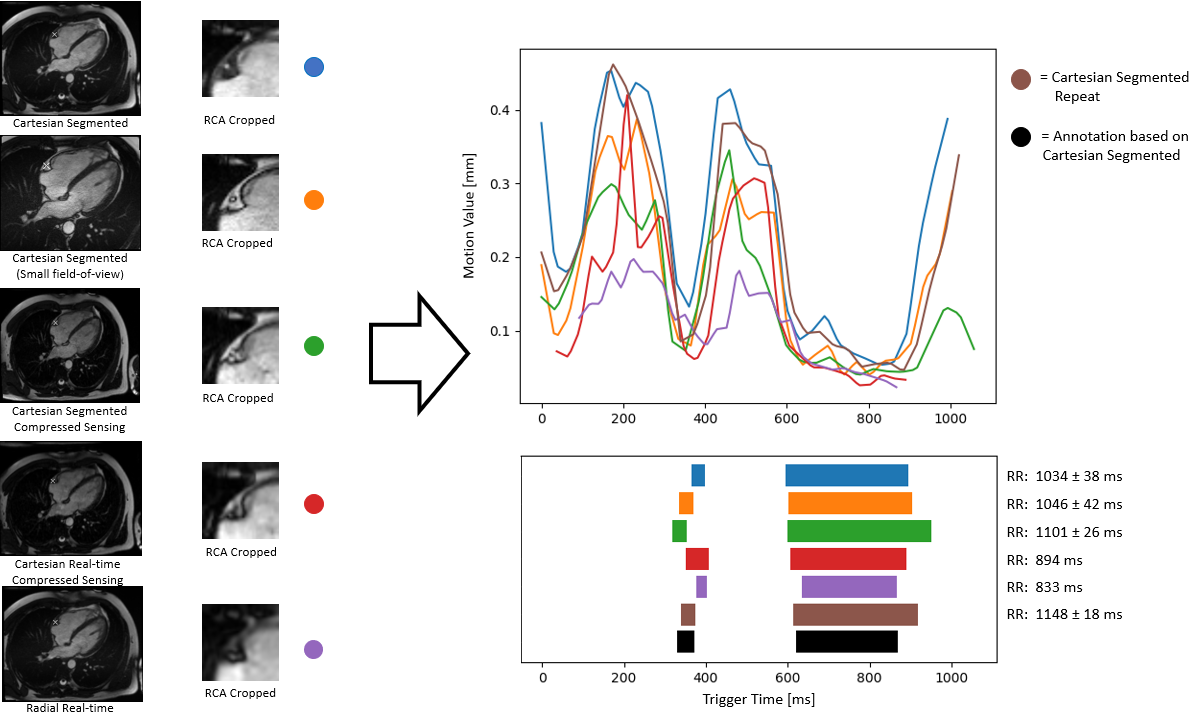
Data for a prospective study in 20 volunteers was acquired on 1.5T and 3T clinical MRI scanners (MAGNETOM Aera, Prisma; Siemens Healthcare, Erlangen, Germany) independently from the data in Fig.2b. The proposed system was integrated into the scanner software and tested online. To evaluate the robustness, different CINE sequences were tested (Fig.3b). RPs in each Cartesian segmented sequence were annotated by an expert. A static 3-D acquisition with a T2-prepared segmented 3-D gradient-echo prototype sequence3 targeted to the RCA was acquired in each volunteer in an automatically detected RP to test the system’s efficacy.Experiments
The datasets used for RCA detection are provided in Fig.2b. The mean and standard deviation of the distance between ground-truth and predicted RCA coordinates were calculated for each timepoint from the testing data. For evaluating the classified RPs, the root-mean-squared error (RMSE) for the start and end timepoint of the detected RPs and the annotations was computed for the annotated testing data and prospective study data in milliseconds. The results of the detected RCA coordinate in each CINE sequence and the 3-D static acquisition were qualitatively validated.Results
The RCA detection error was $$$4.9\pm2.4\,mm$$$. The RMSE for the start and end timepoint of the detected RPs on the 21 testing datasets was $$$31\pm20\,ms$$$, $$$21\pm23\,ms$$$ (end-systolic RP) and $$$37\pm23\,ms$$$, $$$23\pm20\,ms$$$ (end-diastolic RP). In the prospective study, the RMSE was $$$17\pm19\,ms$$$, $$$13\pm9\,ms$$$ (n=17, end-systolic RP), $$$37\pm20\,ms$$$ and $$$24\pm16\,ms$$$ (n=20, end-diastolic RP), respectively. For 3 prospective cases, the systolic RP was not detected when it was very short ($$$42\pm8\,ms$$$). Qualitative result for different sequences is shown in Fig.4 and for 3-D measurements in Fig.5.Discussion
The RCA detection error was improved from previous work1 by 2.3mm and the RP detection error by $$$6\,ms$$$ on average. Even though landmark detection was only trained on segmented Cartesian sequences, it was successful in different sequences (Cartesian/radial, non-CS/CS, real-time/retro gating), allowing the system to be integrated into different clinical protocols. The motion quantification by image registration and RP classification were accurate compared to expert annotations. The robustness of the system was validated in a prospective study on unseen data from a different institute than the source of the training data. 3-D RCA visualization in an automatically detected RP showed no residual motion artifacts, demonstrating the efficacy of the proposed system.Conclusion
Automated RP detection for RCA in 4CHV images was performed with high accuracy by the proposed system. The results of the prospective study show the utility of the automated RP detection. Future work will focus on clinical validation.Acknowledgements
No acknowledgement found.References
1. Yoon, Seung Su, et al. Automatic Cardiac Resting Phase Detection for Static Cardiac Imaging Using Deep Neural Networks. Proc. Intl. Soc. Mag. Reson. Med. 27 (2019); 2131.
2. Chefd'hotel Christophe, et al. Flows of Diffeomorphisms for Multimodal Image Registration. In: 2000 IEEE International Symposium on Biomedical Imaging, July 7–10, 2002:753–756.
3. Munoz Camila, et al. Motion corrected water/fat whole-heart coronary MR angiography with 100% respiratory efficiency. Magn. Reson. Med 2019; 82:732-742.
4. Huang, Gao, et al. Densely Connected Convolutional Networks. CVPR. Vol. 1. No. 2. 2017.
5. Kingma, Diederik P, et al. Adam: A method for stochastic optimization. arXiv preprint arXiv:1412.6980 (2014).
Figures