2209
Generation of realistic and heterogeneous virtual population of cardiovascular magnetic resonance simulated images1Biomedical Engineering Department, Eindhoven University of Technology, Eindhoven, Netherlands, 2Philips Research Laboratories, Hamburg, Germany, 3MR R&D - Clinical Science, Philips Healthcare, Best, Netherlands
Synopsis
This study investigates an approach to generate a realistic, heterogeneous database of simulated cardiac MR images to aid the development of fully automated and generalizable deep learning based segmentation algorithms, less sensitive to variability in CMR image appearance. XCAT phantoms were used to create the virtual population by altering the heart position and geometry and MRXCAT approach was improved to simulate more organs. Images simulated in this study were quantitatively and qualitatively comparable to real CMR images acquired by two different sites and vendors. Initial experiments using such a heterogeneous image dataset show a positive impact on the segmentation performance.
Introduction
Segmentation of the ventricular cavities of the heart is an integral part of every clinical routine that involves assessing cardiac function from cardiovascular magnetic resonance (CMR) images. In pursuit of fully automatic segmentation, deep learning (DL) based algorithms have recently emerged as robust methods for accurate tissue delineation across a variety of tasks1. However, to achieve adequate performance, such algorithms need to be trained on large image datasets delineated by clinical experts. In the case of ventricular cavity segmentation, their accuracy and performance is dramatically degraded by inherent large variability in CMR image data: heterogeneous image contrast across sites and vendors, inter-expert error in delineating the ground truth, and diverse range of image artifacts and noise levels2,3. Generating a virtual population of realistic anatomical models and simulating a database of CMR images, including a wide range of variability, serves as a promising solution for improving the generalizability potential of DL methods. Moreover, this virtual population could provide the “true ground truth”, since the anatomical model used for simulation provides directly the true tissue labels as opposed to the “craft ground truth”, which is manually delineated and is prone to human observer error. In other words, there is no need for expert delineation for simulated images provided with anatomical reference model. This study investigates the generation of realistic anatomical models complemented with tissue properties for MRI simulation and compares the signal intensity distribution of simulated images to their acquired counterparts for validation.Methods
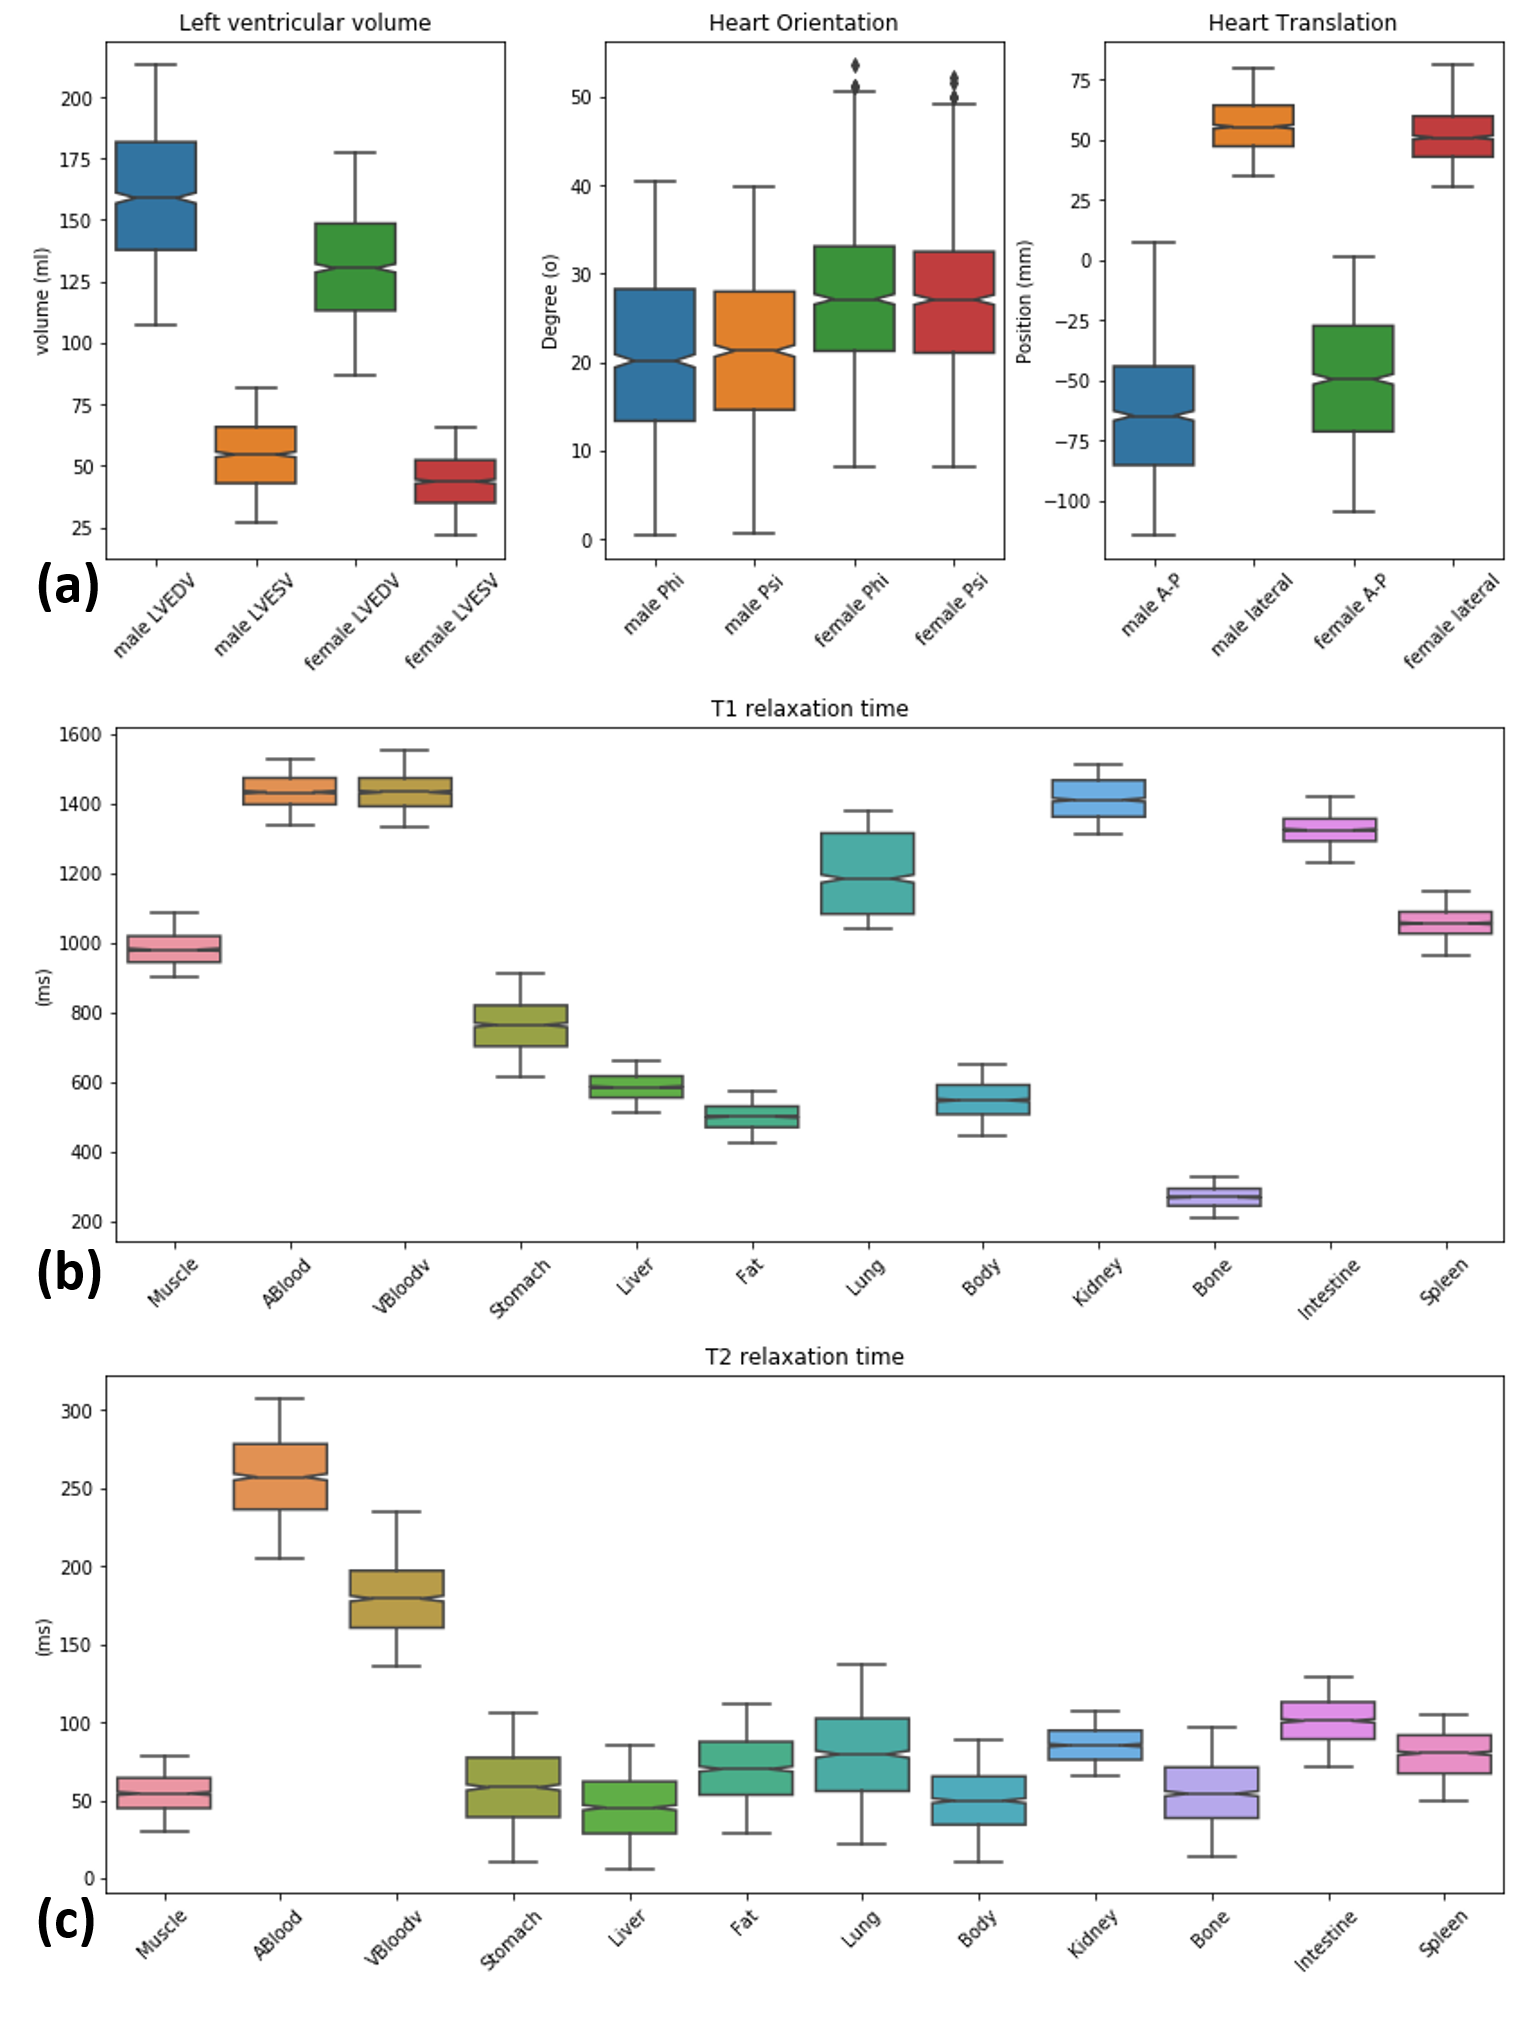
Anatomical model and tissue property: Based on the Visible Human Project male and female anatomy, XCAT phantoms have shown a great potential in building a realistic virtual subject population for medical imaging research4,5. We benefit from the high flexibility of the XCAT to create the population; we varied the heart orientation angle and heart position along anterior-posterior (AP) and lateral axis in the torso and heart’s left ventricle end-diastolic and end-systolic volume (LVEDV and LVESV) according to the normal values reported in the literature6,7 as depicted in Figure 1a. For organs in each individual subject, a unique value of proton density, T1 and T2 relaxation time within the normal range were assigned as visualized in Figure 1b8–10. We assumed that both anatomical and tissue parameters follow a bounded Gaussian bell curve with mean, standard deviation, minimum and maximum reported values.MR image simulation: the MRXCAT approach, which is an extension to XCAT for realistic cardiac MR image simulation11, was utilized to generate balanced steady state contrast with a given TR (2.7-63 ms), TE (1.3-1.7 ms) and flip angle (40-75 deg) set of scan parameters. The parameters were modified such that the simulated signal intensity matches the signal intensity coming from a database of acquired images. The database was acquired using MRI data from two different vendors with similar scan protocols, but slightly different parameters, originating from two different imaging centers.
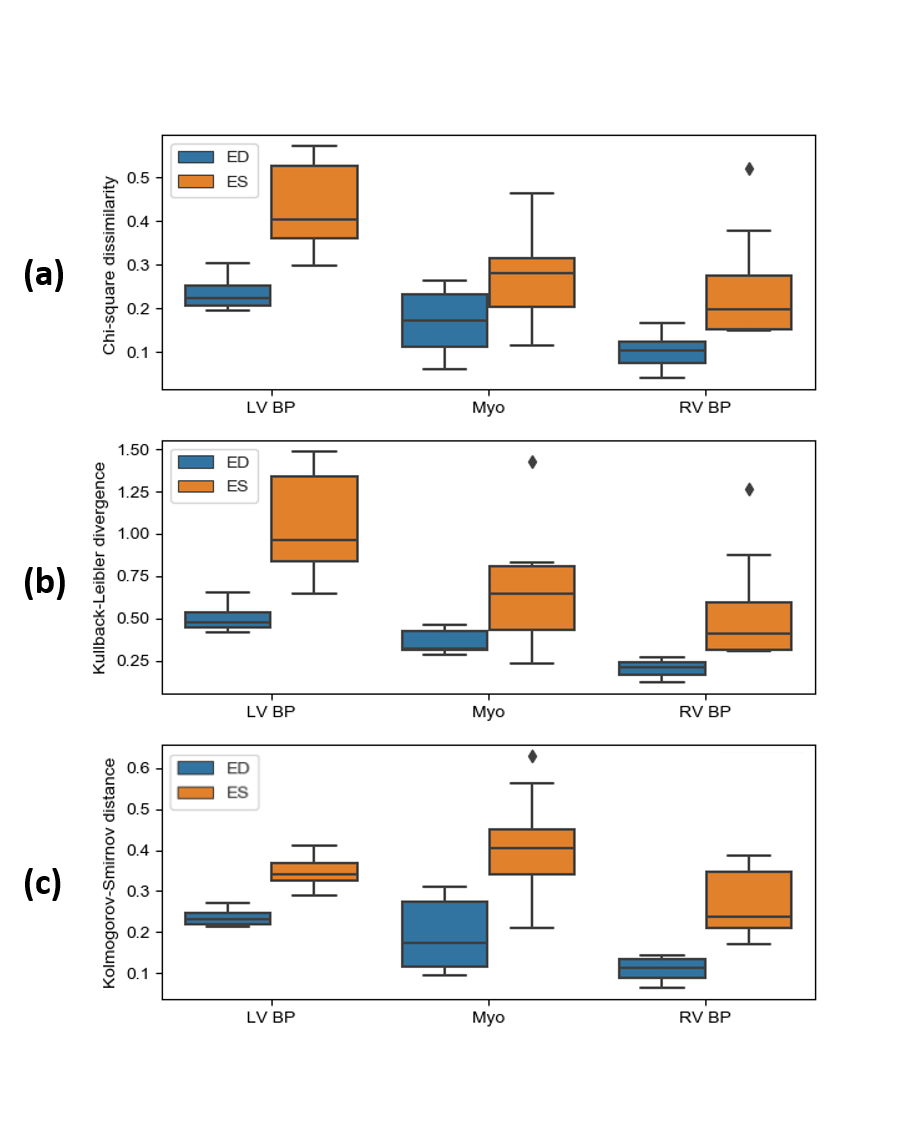
Validation of simulated images: To evaluate the realism of simulated images quantitatively, signal intensity distributions for the LV myocardium, LV blood pool and RV blood pool were compared with their counterparts in real images by employing similarity and distance metrics, namely the Chi-square dissimilarity metric (χ2), Kullback-Leibler divergence (KL) and Kolmogorov-Smirnov distance (KS).
Results
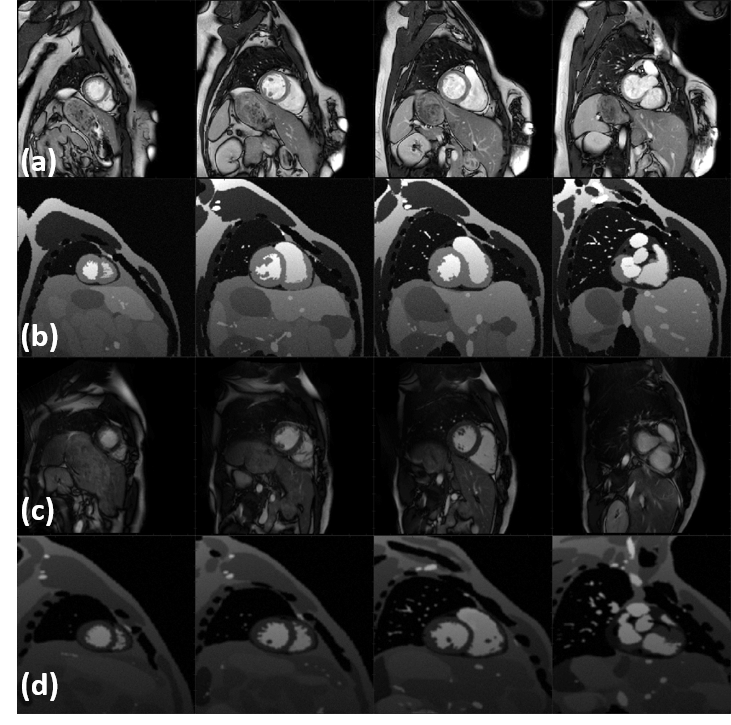
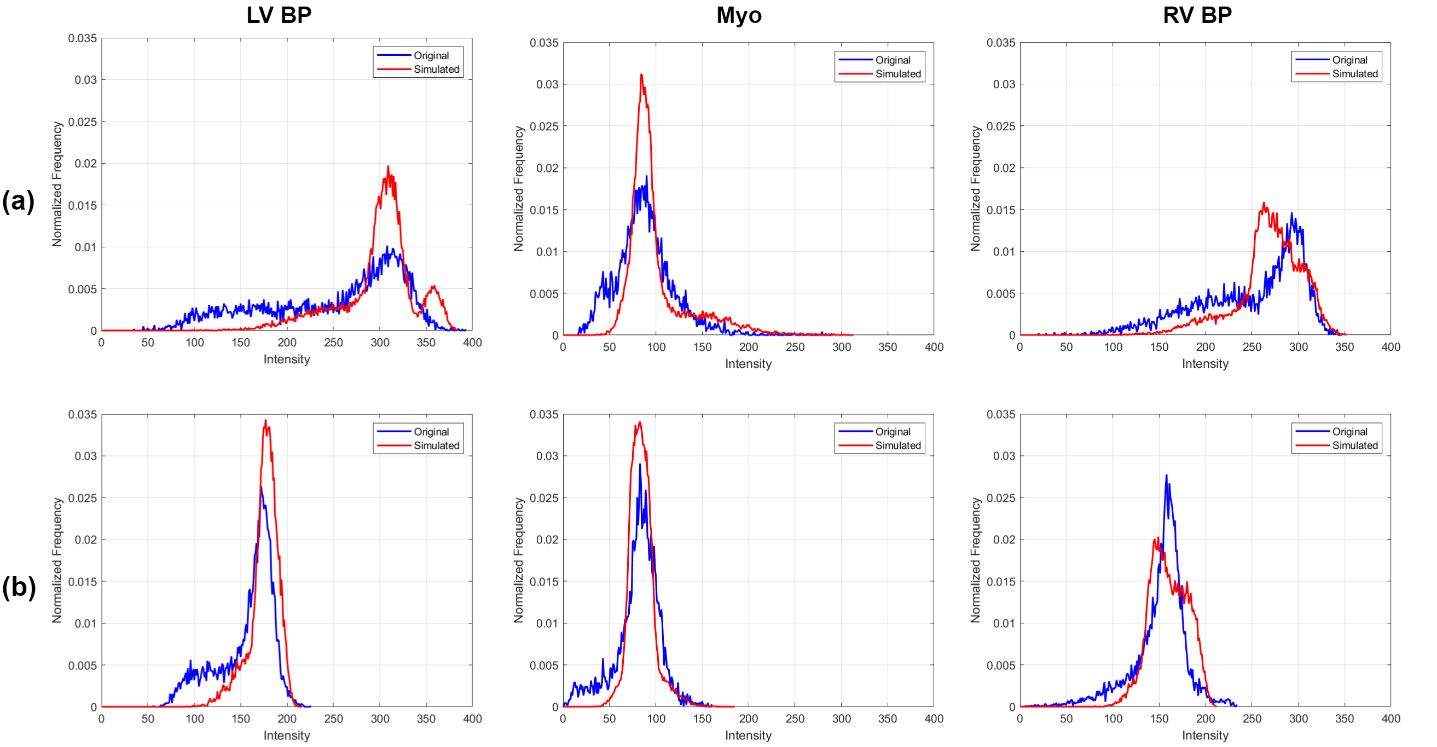
Figure 2(a,c) represents a visual comparison of real images acquired at two different sites with two different MR vendors and their simulated counterparts (b,d) , where their image appearance and contrast are matched by tuning the simulation parameters. Corresponding signal intensity distributions for each of the three tissues (the LV myocardium, LV blood pool and RV blood pool) in simulated images are compared with their shown real image counterparts in Figure 3. Figure 4 portrays the distribution of the resulting χ2, KL and KS values for each of the tissues at ED and ES. Since matching for images at ES phase has not been performed, the resulting metrics are higher, but still in the acceptable range.Discussion and Conclusion
The obtained results are quantitatively comparable to those presented in the literature12. The divergence between the distribution geometries in the Figure 3 comes from the fact that some factors that can cause intensity variability within the tissue for instance realistic texture were not yet included in the simulation. Simulated images in this study were quantitatively and qualitatively comparable to real CMR images, and thus have a potential use in improving segmentation algorithms. With greater realism attained by increasing the number of simulated organs, a virtual population was generated including various anatomies and heterogeneous image appearances. This population also provides accurate ground truth without the need for expert delineation and it can significantly boost the generalization capability of automated segmentation methods to unseen data. Initial experiments confirm that adding simulated data into the training set with real images has a positive effect on the performance of the network trained for segmentation13. Additionally, such data can pave the way towards highly accurate and more efficient large-scale multi-site and multi-scanner studies. Future works are twofold: i) improving the realism of the simulation pipeline by incorporation of realistic partial volume, noise and image artifacts and ii) further investigating the application of such heterogeneous data in performance of DL-based segmentation algorithms.Acknowledgements
This research is a part of the OpenGTN project, supported by the European Union in the Marie Curie Innovative Training Networks (ITN) fellowship program under project No. 764465.References
1. Bai W, Sinclair M, Tarroni G, et al. Automated cardiovascular magnetic resonance image analysis with fully convolutional networks. J Cardiovasc Magn Reson. 2018;20(1):1-17. doi:10.1186/s12968-018-0471-x
2. Chen C, Bai W, Davies RH, et al. Improving the generalizability of convolutional neural network-based segmentation on CMR images. 2019:1-15. http://arxiv.org/abs/1907.01268.
3. Yan W, Wang Y, Xia M, Tao Q. Edge-Guided Output Adaptor: Highly Efficient Adaptation Module for Cross-Vendor Medical Image Segmentation. IEEE Signal Process Lett. 2019;26(11):1593-1597. doi:10.1109/lsp.2019.2940926
4. Segars WP, Tsui BMW, Cai J, Yin FF, Fung GSK, Samei E. Application of the 4-D XCAT Phantoms in Biomedical Imaging and beyond. IEEE Trans Med Imaging. 2018;37(3):680-692. doi:10.1109/TMI.2017.2738448
5. Segars WP, Sturgeon G, Mendonca S, Grimes J, Tsui BMW. 4D XCAT phantom for multimodality imaging research. Med Phys. 2010;37(9):4902-4915. doi:10.1118/1.3480985
6. He X, Frey EC, Links JM, Gilland KL, Segars WP, Tsui BMW. A mathematical observer study for the evaluation and optimization of compensation methods for myocardial SPECT using a phantom population that realistically models patient variability. IEEE Trans Nucl Sci. 2004;51(1 I):218-224. doi:10.1109/TNS.2004.823331
7. Kawel-Boehm N, Maceira A, Valsangiacomo-Buechel ER, et al. Normal values for cardiovascular magnetic resonance in adults and children. J Cardiovasc Magn Reson. 2015;17(1):1-33. doi:10.1186/s12968-015-0111-7
8. Barth M, Moser E. Proton NMR relaxation times of human blood samples at 1.5 T and implications for functional MRI. Cell Mol Biol (Noisy-le-grand). 1997;43(5):783-791. http://www.ncbi.nlm.nih.gov/pubmed/9298600.
9. Stanisz GJ, Odrobina EE, Pun J, et al. T1, T2 relaxation and magnetization transfer in tissue at 3T. Magn Reson Med. 2005;54(3):507-512. doi:10.1002/mrm.20605
10. de Bazelaire CMJ, Duhamel GD, Rofsky NM, Alsop DC. MR Imaging Relaxation Times of Abdominal and Pelvic Tissues Measured in Vivo at 3.0 T: Preliminary Results. Radiology. 2007;230(3):652-659. doi:10.1148/radiol.2303021331
11. Wissmann L, Segars WP, Kozerke S. MRXCAT: Realistic Numerical Phantoms for Cardiac MRI. Proc Int Soc Magn Reson Med. 2014;22:2413. doi:10.1186/s12968-014-0063-3
12. Tobon-Gomez C, Sukno FM, Bijnens BH, Huguet M, Frangi AF. Realistic simulation of cardiac magnetic resonance studies modeling anatomical variability, trabeculae, and papillary muscles. Magnetic resonance in medicine, 65(1), 280-288.
13. Al Khalil Y, Amirrajab S, Lorenz C, Weese J, Breeuwer M. Simulated CMR images can improve the performance and generalization capability of deep learning-based segmentation algorithms. Submitted to ISMRM 2020
Figures