2206
Automatic Detection of Arrhythmia in ECG-free Real-time MRI
Anja Hennemuth1,2, Christina Unterberg3, Sebastian Ulrich Kelle4, Martin Uecker3, Jens Frahm5, and Markus Hüllebrand1,2
1Institute for Imaging Science and Computational Modelling in Cardiovascular Medicine, Charité - Universitätsmedizin Berlin, Berlin, Germany, 2Fraunhofer MEVIS, Bremen, Germany, 3Universitätsmedizin Göttingen, Göttingen, Germany, 4Deutsches Herzzentrum Berlin, Berlin, Germany, 5Max-Planck-Institut fuer biophysikalische Chemie, Göttingen, Germany
1Institute for Imaging Science and Computational Modelling in Cardiovascular Medicine, Charité - Universitätsmedizin Berlin, Berlin, Germany, 2Fraunhofer MEVIS, Bremen, Germany, 3Universitätsmedizin Göttingen, Göttingen, Germany, 4Deutsches Herzzentrum Berlin, Berlin, Germany, 5Max-Planck-Institut fuer biophysikalische Chemie, Göttingen, Germany
Synopsis
The analysis of cardiac function in patients suffering from arrhythmia poses a problem for conventional ECG-synchronized imaging and the patients' ability to hold their breath. Real-time imaging approaches provide ungated image data, which contains the information about the motion variation induced by breathing and arrhythmia but require a high effort in post-processing and interpretation. The goal of the presented work is to enable an automatic analysis of cardiac real-time image sequences of patients suffering from arrhythmia. To this end, we combine a fast CNN-based segmentation of the myocardium with a curve pattern analysis of the blood volume changes over time.
Introduction
Imaging of arrhythmic patients usually focuses on the assessment of anatomy and tissue structure [1]. The analysis of cardiac function in patients suffering from arrhythmia poses a problem for conventional ECG-synchronized imaging and the patients' ability to hold their breath. Recent approaches to enable functional imaging of arrhythmic patients include the application of retrospective gating using breathing and ECG signals [2]. This strategy enables the reconstruction of representative beats if they occur frequently enough during the imaging period. Real-time imaging approaches [3,4,5,6], on the other hand, provide ungated image data, which contains the information about the motion variation induced by breathing and arrhythmia but require a high effort in post-processing and interpretation. The goal of the presented work is to enable an automatic analysis of cardiac real-time image sequences of patients suffering from arrhythmia. To this end, we combine a fast CNN-based segmentation of the myocardium with a curve pattern analysis of the blood volume changes over time. In the following step, wall motion characteristics can then be assessed to compare motion patterns of different types of contraction cycles.Data and Method
Short-axis cardiac real-time MRI datasets from 25 to 33 slices were acquired at 3T (Siemens Skyra) at a resolution of 1.6mmx1.6mmx6mm, an acquisition time of 33ms for 150-720 time points (i.e., 5-24 s) using a radial FLASH sequence. We examined data of 5 patients who suffered from wall motion abnormalities or atrial fibrillation [7]. The image processing pipeline starts with an automatic segmentation based on deep learning with a multiple-u-net-approach [8] followed by a quantitative analysis. Because of the strong through-plane motion, apical and basal slices were excluded from the analysis. As displayed in Figure 1, we use the blood pool volume curve for simple pattern analysis based on the detection of curve maxima, curve minima and the length of the intervals between them. This analysis provides a separation of the contraction cycles as well as the detection of pattern irregularities representing abnormal heartbeats. The subsequent quantitative assessment of wall thickness enables a separate assessment of contraction cycles of different lengths or different blood pool area patterns. The processing pipeline was integrated into a research software solution,which enables result exploration with a web-based user-interface.Results
The 5 cases were analyzed automatically. For the selected medial slices, the curve analysis and the underlying segmentation were explored by a human observer who rated the automatic pattern detection. Table 1 shows the relevant number of image slices and heart cycles analyzed per dataset. Suspicious curve patterns were detected in all slices of cases 3, 4, and 5 and a subset of the slice set in cases 1 and 2. 17 of the 156 automatically detected suspicious curve patterns were caused by segmentation errors. 16 patterns were additionally recognized by a human observer.Figure 2 shows two examples of pattern misclassification. In the first curve normal variation of contraction cycle length was misinterpreted, in the second curve strong volume changes were missed. Based on the separation of the contraction cycles, a comparison of the segment-wise wall motion patterns could be performed in all subjects. An example is shown in Figure 3.
Discussion and Conclusions
We integrated a machine-learning-based solution for the detection and quantitative analysis of motion abnormalities in ECG-free free-breathing real-time cardiac MRI sequences into a research software solution. The application to 5 test data sets of patients with arrhythmia or wall motion abnormalities showed that abnormal contraction cycles can be detected based on simple curve parameters. While misclassifications could partially be explained by an inadequate segmentation of the myocardium, the very simple curve analysis approach also mislabeled contraction cycles, because the parameters were classified wrongly.We conclude that the presented solution might provide a valuable tool for the quantitative exploration of cardiac motion abnormalities with MRI. The current solution still requires user interaction to correct segmentation errors and inspect the automatic contraction cycle labeling. A more advanced curve pattern analysis will improve the usability towards the quantitative assessment of function abnormalities.
Acknowledgements
This work was partly funded by the German Federal Ministry of Education and Research (BMBF project Berlin Center for Machine Learning (01IS18037E))References
- Mahida S, Sacher F, Dubois R, Sermesant M, Bogun F, Haïssaguerre M, Jaïs P, Cochet H. Cardiac Imaging in Patients With Ventricular Tachycardia. Circulation. 2017 Dec 19;136(25):2491-2507. doi: 10.1161/CIRCULATIONAHA.117.029349.
- Chava R, Assis F, Herzka D, Kolandaivelu A. Segmented radial cardiac MRI during arrhythmia using retrospective electrocardiogram and respiratory gating. Magn Reson Med. 2019 Mar;81(3):1726-1738. doi: 10.1002/mrm.27533.
- Kellman P, Chefd'hotel C, Lorenz CH, Mancini C, Arai AE, McVeigh ER. High spatial and temporal resolution cardiac cine MRI from retrospective reconstruction of data acquired in real time using motion correction and resorting. Magn Reson Med. 2009;62:1557–1564.
- Contijoch F, Iyer SK, Pilla JJ, et al. Self‐gated MRI of multiple beat morphologies in the presence of arrhythmias. Magn Reson Med. 2017;78:678–688.
- Zhang S, Joseph AA, Voit D, Schaetz S, Merboldt KD, Unterberg-Buchwald C, Hennemuth A, Lotz J, Frahm J. Real-time magnetic resonance imaging of cardiac function and flow-recent progress. Quant Imaging Med Surg. 2014 Oct;4(5):313-29.
- Uecker M, Zhang S, Voit D, Karaus A, Merboldt KD, Frahm J (2010) Real-time magnetic resonance imaging at a resolution of 20 ms, NMR in Biomedicine 23:986-994
- Unterberg-Buchwald, C., Fasshauer, M., Sohns, J.M. et al. Real time cardiac MRI and its clinical usefulness in arrhythmias and wall motion abnormalities. J Cardiovasc Magn Reson 16, P34 (2014) doi:10.1186/1532-429X-16-S1-P34
- Hennemuth, A, Kuhnigk, J-M, Steinmetz, Ml, Kelle, S, Chitiboi, T, Frahm, J, Huellebrand, M. Automatic Analysis of Multicycle Real-time MRI for the Assessment of Variable Cardiac Function based on Multi-orientation U-net Segmentation. ISMRM 27th Annual Meeting. 2019
Figures

Analysis concept for ECG-free cardiac
real-time imaging. Based on the automatic segmentation the blood pool
volume curve is analyzed to separate contraction cycles and detect
abnormal patterns, which can then be analyzed.
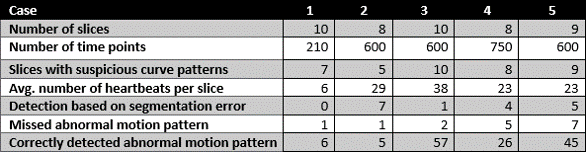
Overview
of characteristics and results per case.
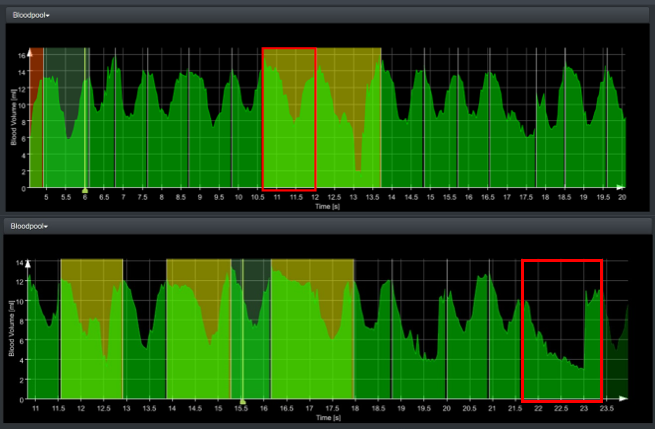
Misclassification
examples for case 5. The upper red rectangle marks a long contraction cycle,
which is assumed normal by the human observer. The lower rectangle marks a suspicious
pattern, which was neglected by the automatic analysis

Comparison of wall thickness curves for normal and abnormal
motion patterns in case 1.