2204
Feasibility and Comparison Between Non-enhanced 2D and 3D Free-breathing Black-blood Techniques for Renal Arterial Wall Imaging1Department of Biomedical Engineering, School of Medicine Tsinghua University, Beijing, China, 2Fujian Medical University Union Hospital, Fujian, China, 3Depaetment of Radiology, Peking Union Medical College Hospital, Beijing, China
Synopsis
We optimized non-enhanced 2D and 3D free-breathing black-blood imaging sequences and found excellent agreement in morphological measurements of renal artery (ICC: 0.85-0.95), and the CNR (p=0.17) and image quality score (p=0.60) were comparable between them. 2D imaging had higher SNR for lumen and wall visualization (all p<0.05) whereas 3D imaging had higher CNReff (5.37±1.91 vs. 0.87±0.51, p<0.01). Both sequences showed excellent inter-reader and scan-rescan repeatability (ICC: 0.77-0.99). We concluded that both 2D and 3D sequences are feasible for renal arterial wall imaging, particularly 2D provides high quality images whereas 3D sequence allows large-coverage and more efficient imaging.
Introduction
Atherosclerotic renal artery stenosis, which is the leading cause of secondary hypertension and progressive renal insufficiency, is most commonly diagnosed by Doppler ultrasonography, computed tomographic angiography (CTA) and magnetic resonance angiography (MRA)1. However, these angiographic techniques lack of vessel wall information and could not differentiate the pathology of renal artery stenosis. The techniques of vessel wall imaging (VWI) have been successfully implemented on carotid artery2 and intracranial artery3 to further evaluate the etiology, stability of the plaques and the effect of treatment. Because of the challenges of respiratory motion and smaller vessel size, few studies utilized vessel wall imaging to evaluate the diseases in renal arterial wall4. In this study, we optimized a non-enhanced 2D free-breathing black-blood (BB) sequence for renal arterial wall imaging to rather high resolution (0.8×0.8mm2, 3-mm thick slab) and proposed a non-enhanced 3D BB sequence (0.8×0.8×2.0mm3). We also investigated the feasibility and the differences in imaging renal arterial wall between 2D and 3D imaging sequences.Materials and methods
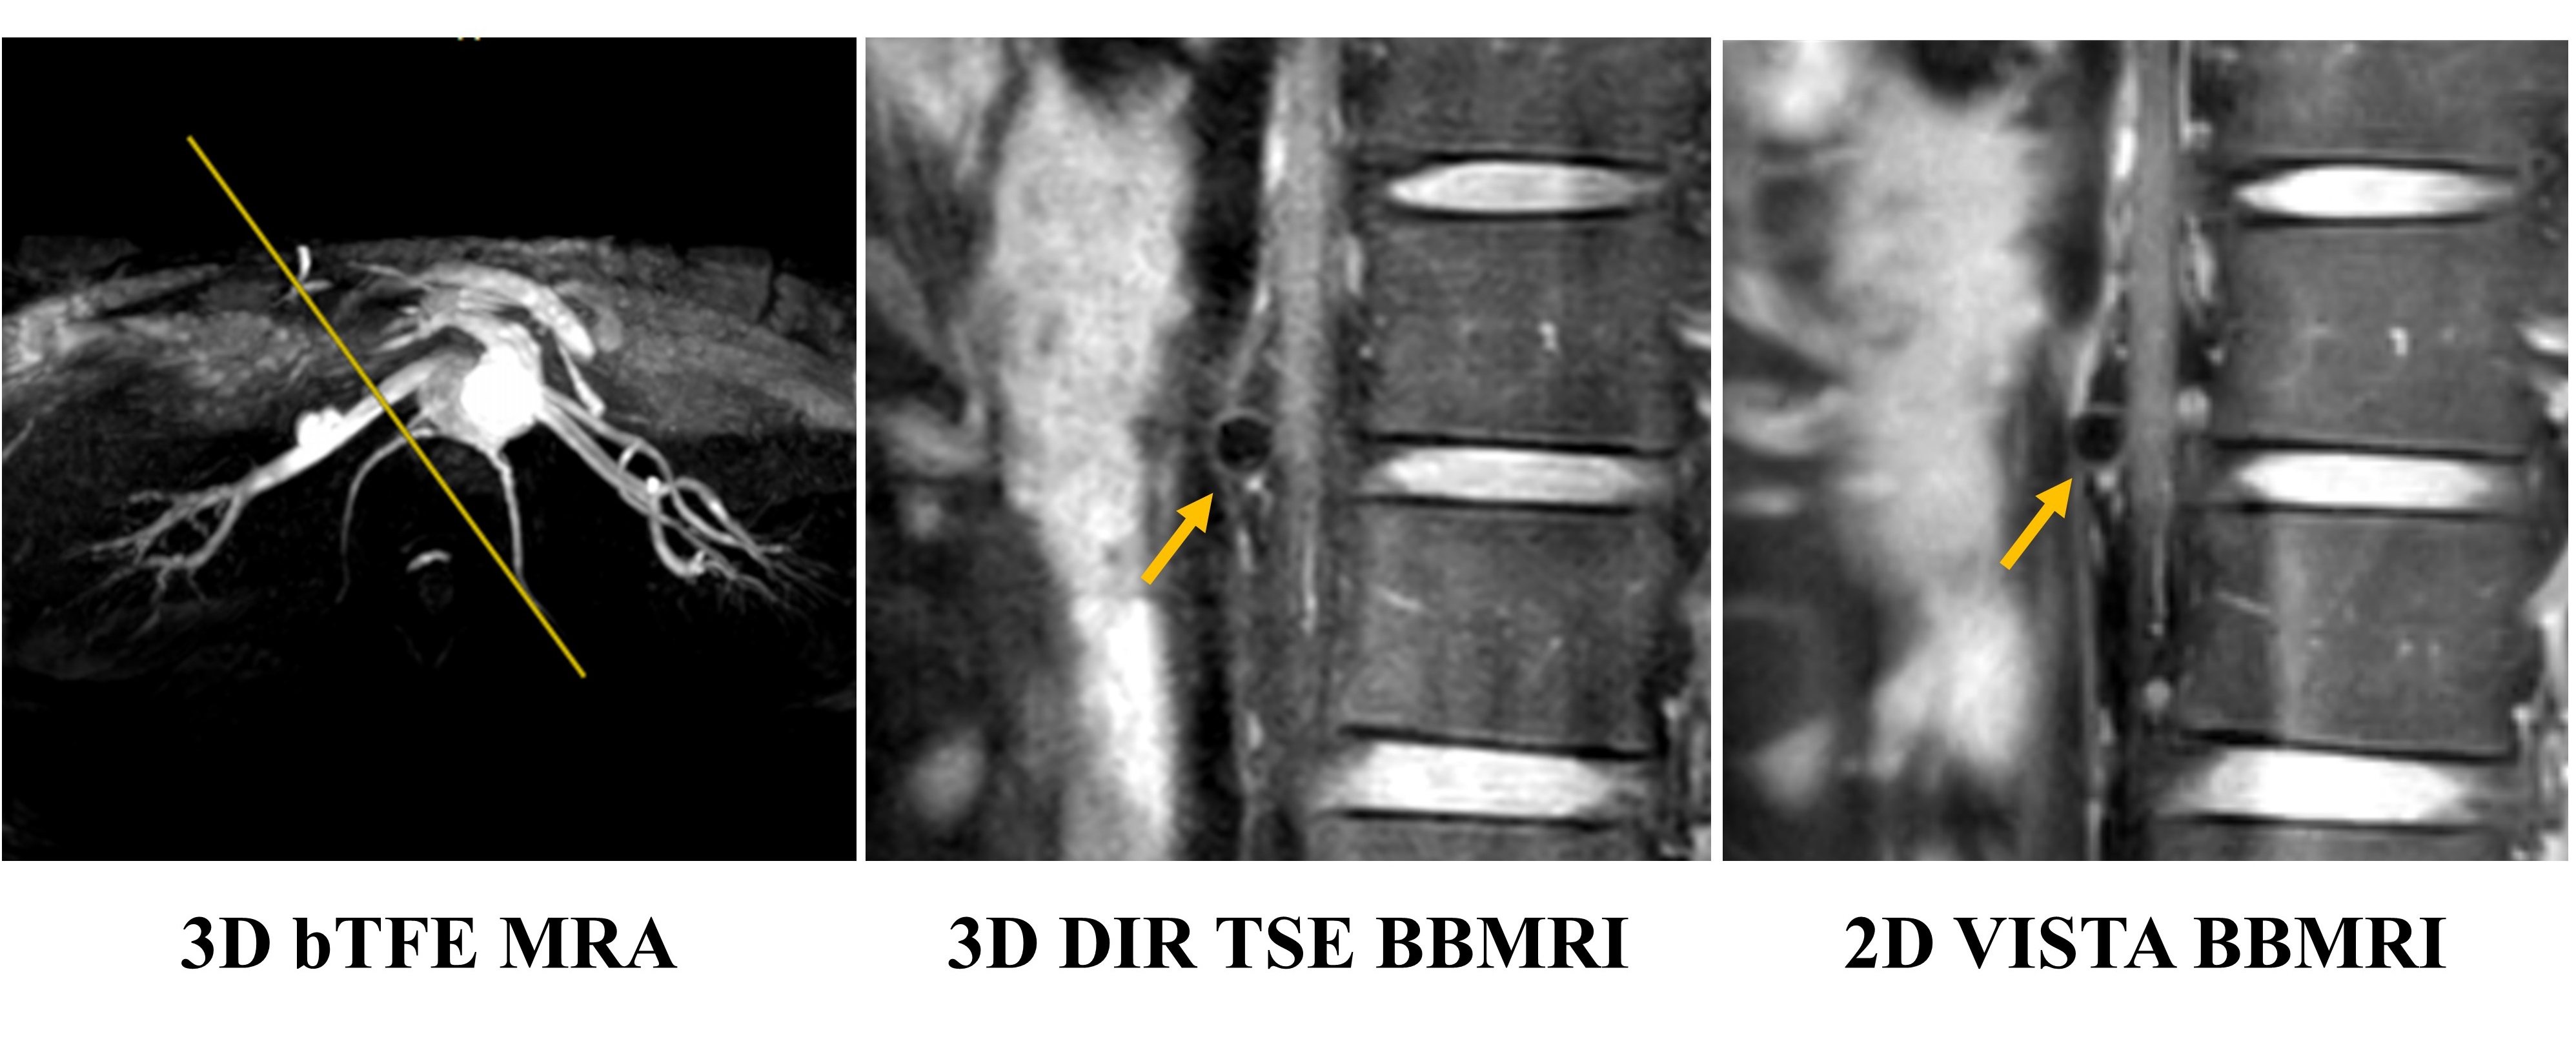
Subjects: In total, 14 healthy subjects (mean age: 24.9±2.4 years, 7 males) were recruited in this study for MRI experiments, of which 4 subjects (2 males) completed scan-rescan repeatability assessment. All subjects voluntarily joined this study by providing written consent forms, and this study was approved by the Ethics Committee.MRI experiments: All experiments were performed on a 3.0T MRI scanner (Ingenia, Philips Healthcare, The Netherlands) equipped with a 16-channel dStream Torso coil and a 12-channel embedded posterior coil. A 3D balanced-TFE MRA was first acquired to localize the renal arteries. The non-enhanced free-breathing 3D double inversion recovery (DIR) TSE BB sequence with fat suppression was implemented using a respiratory trigger to obtain images (50 slices), which were oriented perpendicular to the unilateral renal artery axis to cover the primary branches (50-mm-thick slab) as identified on the MRA. The imaging parameters were as follows: TR/TE, 673 ms/19 ms; TSE factor, 40 including 2 startup echoes; echo spacing, 6.3 ms; refocusing angle, 60°; inversion delay for DIR, 400 ms; CS-SENSE factor, 1.2. The FOV was 160×160×50 mm3 for the spatial resolution of 0.8×0.8×2 mm3 (scan time, 4’57’’). Then the non-enhanced free-breathing 2D VISTA BBMRI images (3 slices) with fat suppression were obtained at the center among the 50 slices of the former 3D images with the same orientation. Its imaging parameters were as follows: TR/TE, 850 ms/17 ms; TSE factor, 25 including 2 startup echoes; echo spacing, 5.8 ms; refocusing variable-flip-angle, amin=130°, amax=160° ; number of average, 4.5. The FOV was 160×160 mm2 for the spatial resolution of 0.8×0.8 mm2, and the slice thickness was 3 mm (scan time, 6’54’’ for 3 slices). For subjects (n=4) who involved in the repeatability experiments, 2D and 3D imaging were performed twice at the same day.
Data analysis: The 3D and 2D images on the same plane were paired and assessed by experienced radiologists using custom-designed software. Lumen and outer wall contours were drawn manually and the morphological features including lumen area (LA), wall area (WA), mean wall thickness (MWT), and maximum wall thickness (maxWT) were measured. The SNR of lumen (SNRlumen) and wall (SNRwall) were calculated, where the noise was measured from an ROI of 3.0 cm2 manually placed in the uniform muscle tissue near to the renal artery. The contrast-to-noise ratio (CNR) of wall versus lumen (CNRwall-lumen) was calculated and the CNR efficiency (CNReff) was calculated as: CNReff=CNR/(VOXEL(TAslice)1/2), where VOXEL is the voxel volume (in mm3) and TAslice is the scan time per slice (in minute)5. The image quality was rated with a 4-point scale by two experienced radiologists. The statistical analysis was performed using SPSS software version 16.0. A paired t-test was conducted to compare the morphological measurements of 3D and 2D imaging. The agreement of image quality score and morphological measurements between 3D and 2D imaging was assessed using intraclass correlation coefficients (ICC). The scan-rescan repeatability of the two sequences were also evaluated.
Results
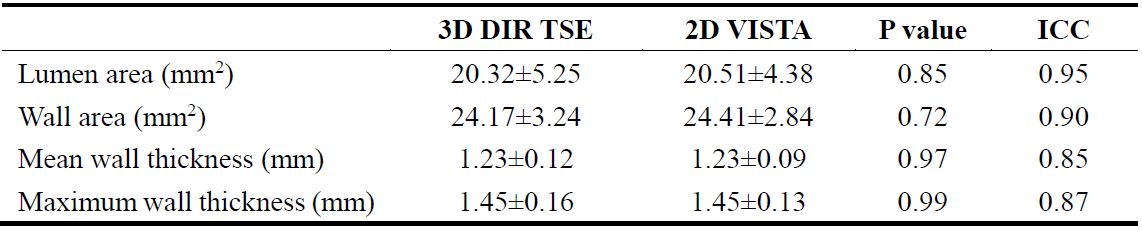
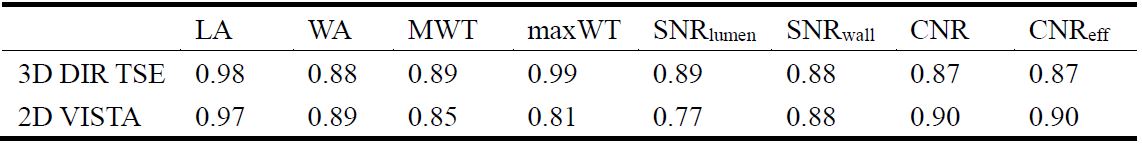
Both 2D and 3D renal arterial wall images could depict the renal arterial wall (Figure 1). Excellent agreement was found between 2D and 3D imaging in measuring renal arterial wall morphology (ICC: 0.85-0.95) without significant differences (all p>0.05) (Table 1). Compared to the 2D imaging, 3D imaging exhibited significantly lower SNRlumen (1.54±0.41 vs. 2.50±1.66, p<0.001) and SNRwall (3.70±0.99 vs. 5.02±3.05, p=0.01), similar CNR (2.16±0.77 vs. 2.52±1.47, p=0.17) and image quality score (2.7±0.9 vs. 2.6±1.0, p=0.60), but significantly higher CNReff (5.37±1.91 vs. 0.87±0.51, p<0.001). Both 2D and 3D imaging showed excellent inter-reader (ICC: 0.82-0.87) and scan-rescan (ICC: 0.77-0.99) repeatability (Table 2) in measuring arterial wall morphology.Discussion and Conclusion
This study showed that both non-enhanced 2D and 3D imaging sequences were feasible for imaging the renal arterial wall. 2D imaging sequence could provide high quality vessel wall images for the specific diseased area, whereas 3D imaging sequence allowed comparable value of renal arterial wall assessment with larger coverage and higher imaging efficiency. Ongoing work will focus on developing the isotropic 3D sequences and implementing it on patients’ scan.Acknowledgements
No acknowledgement found.References
1. Tafur, J.D. and C.J. White, Renal Artery Stenosis: When to Revascularize in 2017. Curr Probl Cardiol, 2017;42(4): 110-135.
2. Saba, L., et al., Carotid Artery Wall Imaging: Perspective and Guidelines from the ASNR Vessel Wall Imaging Study Group and Expert Consensus Recommendations of the American Society of Neuroradiology. AJNR Am J Neuroradiol, 2018;39(2): 9-31.
3. Mandell, D.M., et al., Intracranial Vessel Wall MRI: Principles and Expert Consensus Recommendations of the American Society of Neuroradiology. AJNR Am J Neuroradiol, 2017;38(2): 218-229.
4. Sigovan, M., et al., MRI-based detection of renal artery abnormalities related to renal denervation by catheter-based radiofrequency ablation in drug resistant hypertensive patients. Eur Radiol, 2018;28(8): 3355-3361.
5. Zhang, Z., et al., Three-dimensional T2-weighted MRI of the human femoral arterial vessel wall at 3.0 Tesla. Invest Radiol, 2009;44(9): 619-26.
Figures