2197
Quantitative sodium imaging in the carotid and aorta1Department of Radiology, University of Cambridge, Cambridge, United Kingdom, 2Cancer Research UK, Cambridge, United Kingdom, 3Rapid Biomedical GmbH, Rimpar, Germany, 4Department of Radiology, Haukeland University Hospital, Bergen, Norway, 5GE Healthcare, Munich, Germany, 6Cambridge University Hospital, Cambridge, United Kingdom
Synopsis
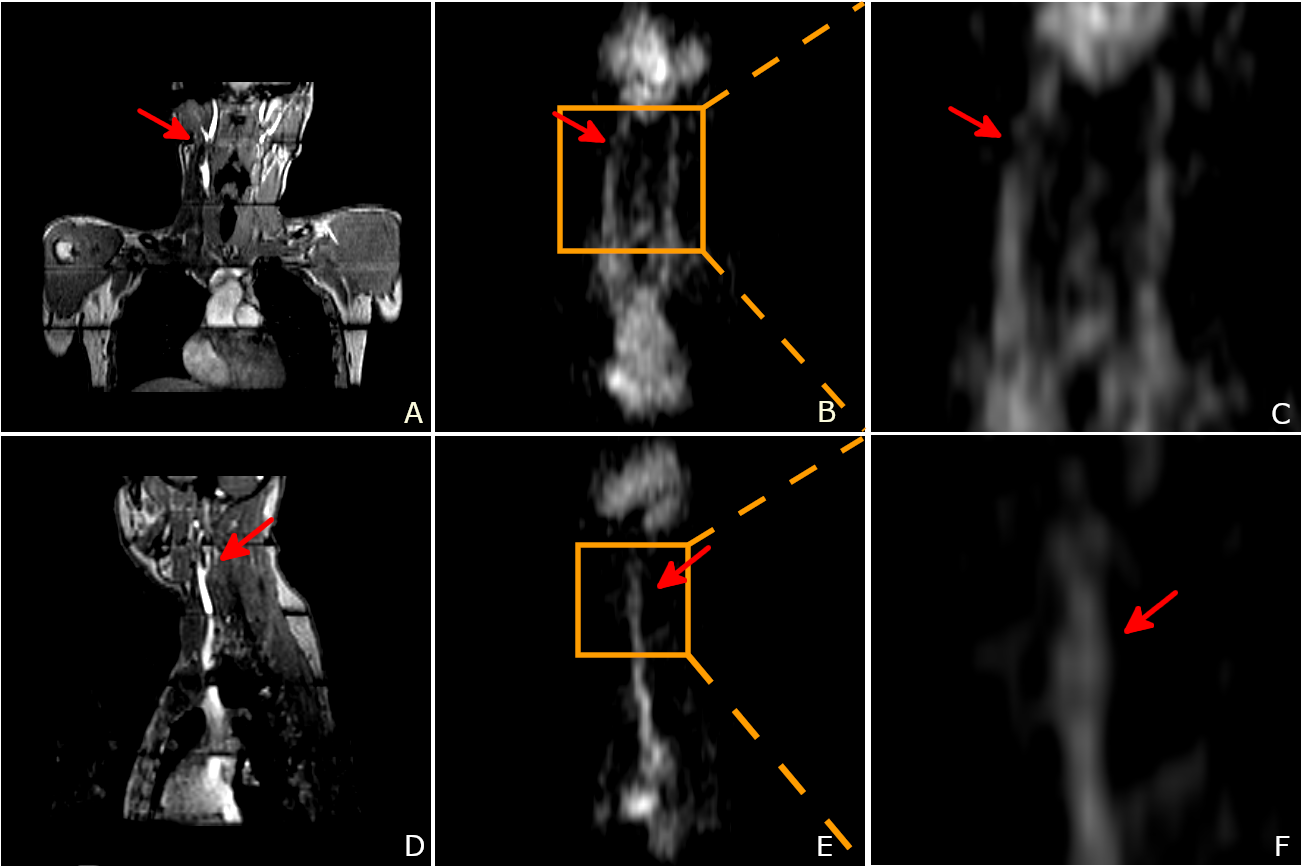
Carotid and aortic sodium MR images were acquired from four healthy volunteers, using a 3D cones trajectory and a birdcage sodium transmit/receive coil. Vascular structures such as the carotid bifurcation and aortic arch were observed in the sodium images. T1 maps were estimated via the variable flip angle fitting method. B1 maps were estimated with the dual angle method. Sodium concentration was estimated using a linear model with two fiducials as the reference. The results show sodium MR imaging can provide non-invasive and quantitative measurements of the sodium concentration near possible locations of vascular diseases.
Introduction
Vascular disease is the most common cause of global mortality1. Vascular diseases like atherosclerosis are focal diseases. Sodium plays a key role in vascular biological activities, such as the regulation of osmotic balance and endothelial dysfunction2. Excess dietary sodium intake has been identified as a risk factor for hypertension, adverse cardiovascular disease and stroke3. Studies also showed high sodium concentration in blood was associated with high blood pressure and increased endothelial dysfunction in carotid arteries4. Although serum sodium levels can be measured through blood samples, the measurements are sampled from the entire blood pool, and cannot reflect the sodium concentration near the lesions. To better understand the role of sodium in vascular diseases in vivo, a non-invasive quantitative sodium imaging method based on sodium magnetic resonance (MR) is desirable.Methods
Image acquisitionSodium images were acquired from four normal volunteers using a 3D cones trajectory with TR: 100ms, TE: 0.7ms, flip angle (FA): 70°, voxel size: 4x4x8mm3 with a 48cm field-of-view, averages: 5, interleaves: 1402, BW: ±166kHz, total scan time: 11:41 minutes. Sodium MR imaging was performed with a 50cm long 40cm inner diameter birdcage sodium transmit/receive coil (Rapid Biomedical, Rimpar, Germany). To estimate sodium concentrations, two fiducials with sodium concentrations of 40 and 80 mM were placed near the volunteers’ chests. Low resolution breath-hold sodium images were also acquired at flip angle of 40° and 80° to estimate either B1 (near the extremities of the coil, where the field is likely to be non-uniform) or T1 (centrally in the coil, where the field is likely to be uniform), with 196 interleaves and scan time = 24s per flip angle. Proton imaging was performed with the standard proton body coil and a multi-slab 3D gradient echo sequence was used to capture the anatomy of interest. Each slab was acquired in a separate breath-hold. (Axial, TR: 7.1ms, TE: 2.9ms, FA: 12°, voxel size: 1.6x2.5x3mm3, FOV: 40cm, phase FOV: 0.7, BW: ±31.25kHz, slab: 5, total scan time = 1:42 minutes). No other proton imaging was performed, other than a GRE localizer. All imaging was performed with informed consent and approval of the local review board
Image processing
Images were obtained via a regridding routine before Fourier transformation. The in vivo sodium concentrations ([Na]) were estimated with a linear model of the sodium signal intensities. The TR was sufficiently long that T1 was assumed to not significantly bias the concentration estimates. With the two sodium phantoms as reference:
$$[Na]_{tissue}=(\frac{S_{Na, tissue}}{S_{Na, reference}})[Na]_{reference}$$
B1 maps were calculated as the ratio of actual to nominal flip angle using the two low resolution sodium images. Where B1 was assumed uniform, T1 maps were estimated via a variable flip angle fitting method.
Results
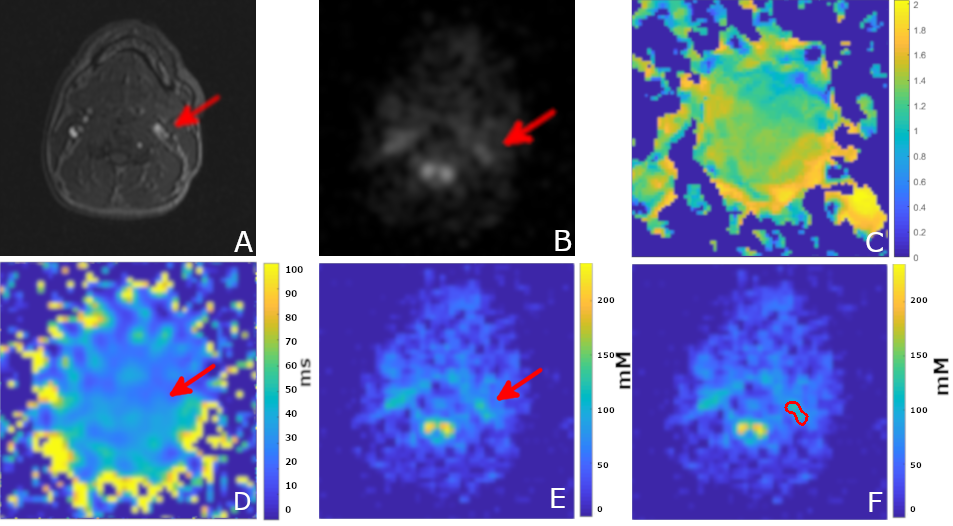
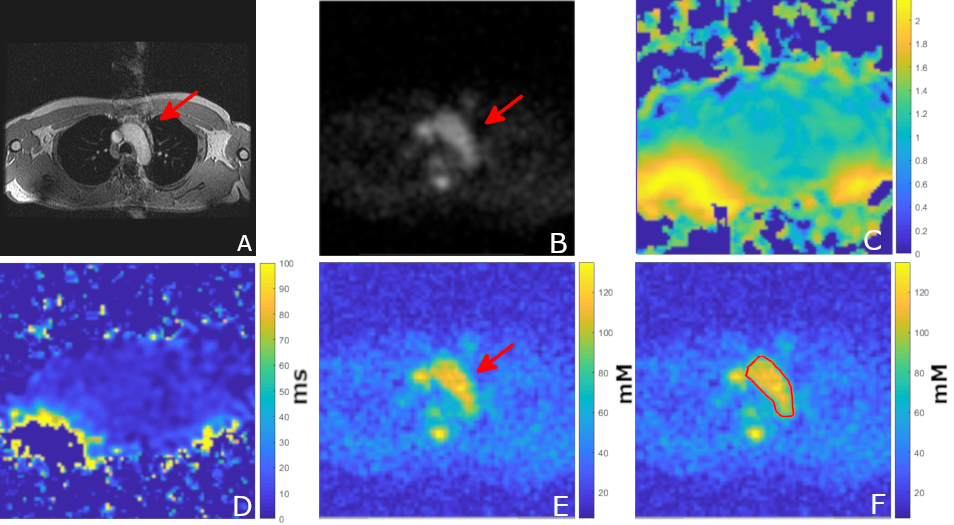
The average sodium concentration was 86.3±9.5mM in the carotid ROI and 122.1±32.6mM in the aortic arch ROI. The average T1 was 34.2±1.1ms in the carotid ROI and 34.9±1.4ms in the aortic arch ROI. The average B1 ratio was 1.17±0.22 in the carotid ROI and 1.05±0.17 in the aortic arch ROI.Discussion
The primary source of sodium signal in the image was extracellular fluid, primarily blood. Anatomical structures such as the carotid bifurcation and aortic arch were observed in the sodium images. The actual flip angle varied across the field of view but was relatively uniform in the centre of the FOV. The average sodium T1 and concentration was close to the values reported in literature5 for human blood. The flip angle was generally uniform throughout the volume, with the exception of a region at the back of the subject, where it was approximately twice as large due to the proximity to the coil. We stretched the pulses to 1ms for all sequences before imaging to reduce potential heating near the coil rungs.The sodium signal intensity can be influenced by T1, T2* relaxation, B1 transmit homogeneity, coil sensitivity, and sodium concentration. For sodium concentration estimation, we used a linear model, assuming that there was no T1 biasing due to the relatively long TR, and that B1 was uniform over the regions of interest. As Figure 2, 3 indicates, the T1 and B1 were not completely uniform (although the estimation of T1 and B1 assumed that other factors were constant). For more accurate sodium concentration estimation, corrections for these confounding factors are required.
We could not observe or analyse the vessel wall in the experiments due to limited spatial resolution and the large intensity difference between vessel wall and lumen. Potentially, blood suppression techniques from proton imaging can be transferred into sodium imaging to provide sodium vessel wall images. Even though we could obtain higher resolutions with smaller receive coils or multiple-coil arrays to maximize sensitivity, this work demonstrates the value of homogeneous transmission using the quadrature birdcage coil. This allows us to explore vessel imaging possibilities that were previously too difficult with surface transmit/receive coils. Thus, the local sodium concentration in carotid and cardiac vessels and within the vessel walls have the potential for further development and clinical analysis.
Conclusion
These preliminary results show sodium MR images of vessels and quantitatively reflect sodium concentrations. Further improvement in sequence design may enable separation of blood from other sodium compartments.Acknowledgements
This research is supported by NIHR Cambridge Biomedical Research Centre, GlaxoSmithKline, and Cancer Research UK.References
1. WHO. Global status report on noncommunicable diseases 2014. World Health 176 (2014). doi:ISBN 9789241564854
2. Kong, Y. W., Baqar, S., Jerums, G. & Ekinci, E. I. Sodium and its role in cardiovascular disease - The debate continues. Front. Endocrinol. (Lausanne). 7, (2016).
3. Whelton, P. K. et al. Sodium, blood pressure, and cardiovascular disease: Further evidence supporting the American Heart Association sodium reduction recommendations. Circulation 126, 2880–2889 (2012).
4. Gümrükçüoglu, H. A. et al. Effects of lowering dialysate sodium on carotid artery atherosclerosis and endothelial dysfunction in maintenance hemodialysis patients. Int. Urol. Nephrol. 44, 1833–1839 (2012).
5. Bottomley, P. A. Sodium MRI in human heart: A review. NMR Biomed. 29, 187–196 (2016).
Figures