2191
Myostrain characterization using fewer SENC cardiac phases – a preliminary study1MR, UIH America, Inc., Houston, TX, United States, 2MR, United Imaging Healthcare, Shanghai, China, 3Myocardial Solutions, Inc., Morrisville, NC, United States
Synopsis
SENC MRI is an important technique for myocardium strain quantification. We proposed a modified SENC EPI sequence to only acquire about half of the total cardiac phases in order to get higher SNR strain images. The minimum strains can still be calculated with better SNR from LT/HT images. With the imaging time kept the same at one heartbeat, the SNR of the images is higher and strain calculation is more accurate. The timing of the end-systole stage can be determined by running a CINE scan prior to the SENC protocol.
Introduction
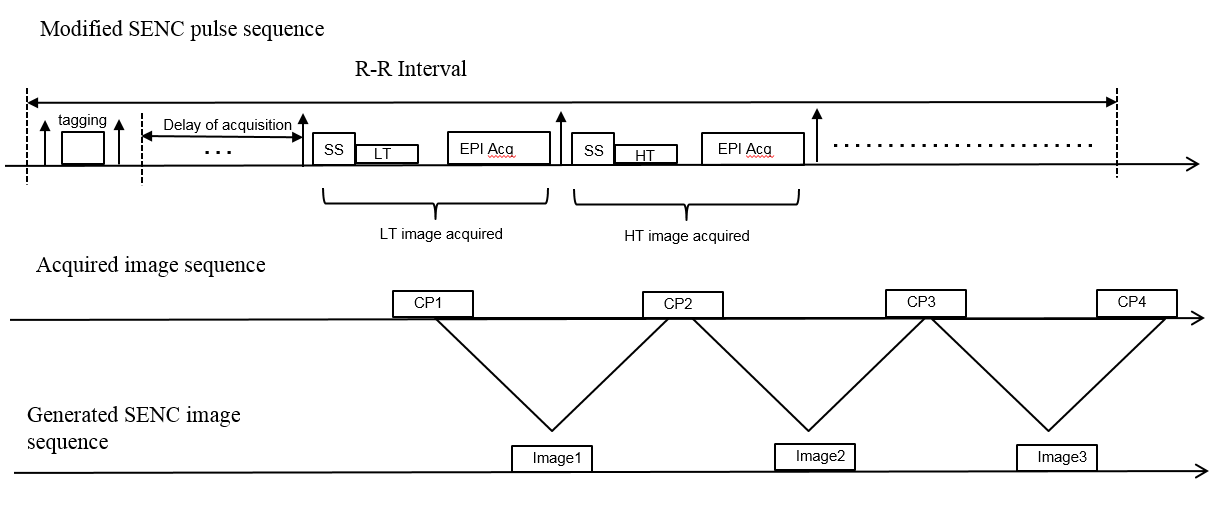
Strain-encoded (SENC) magnetic resonance imaging is an advanced tagging technique1,2, which provides both color-coded visual and quantitative assessment of myocardial strains. While in conventional tagging the tagging planes are applied in the orthogonal direction of the imaging slice, SENC applies them parallel to the imaging slice. The tagging planes in the through-plane direction compress together during myocardium contracting, and conversely become further distanced during stretching. This causes a shift in the location of the peak spectrum in k-space, which can be used to determine myocardial strain1,2. With the high and low tuning frequency encoded in slice selection, images are acquired during the cardiac phases. So that the acquisition of a single slice can be done as short as one heartbeat. With pairs of LT(low-tuning) and HT(high-tuning) images, the strains can be calculated for various regions of the myocardium1,2. However, the SNR can be very low in these LT or HT images compromising the ability to view more detailed regions of the myocardium. A modified version of SENC sequence is proposed to increase SNR by acquiring fewer images, which are selected around the end-systole during cardiac cycle.Methods
A SENC MRI sequence with single-shot EPI readout was implemented on a 1.5T MRI system (uMR 560, United Imaging Healthcare, Shanghai, China). Images of a healthy 30-year old female volunteer were acquired with IRB approval. With the fat saturation and selective tagging pulse module played out immediately following the end of diastole, single shot EPI was used to acquire tuned image during cardiac phase. With low and high tuning alternative imaged, a total of 16-20 images can be acquired during the cardiac cycle. With a pair of low and high tuning images, the strain can be calculated which corresponds to that cardiac phase. Not only we acquired the full phases of cardiac cycle, in comparison, we also acquired about half of the phases around end-systole stage (trigger delay time was determined by a CINE scan). Imaging parameters were: slice thickness = 10 mm, FOV = 360×180 mm2 with pixel 4.00×3.75 mm2 ,TR = 49 ms, TE = 23.9 ms, tagging distance = 3.92 mm, bandwidth = 2000 Hz/pixel. Single-shot EPI with ramped or constant flip angles was used to image each cardiac phase. The ramped flip angle considers T1 effect3 to maintain constant myocardial signal intensity during cardiac phases.Results
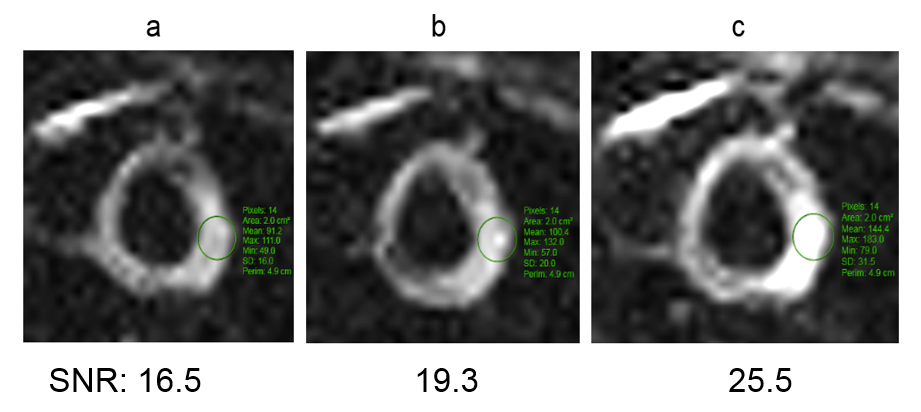
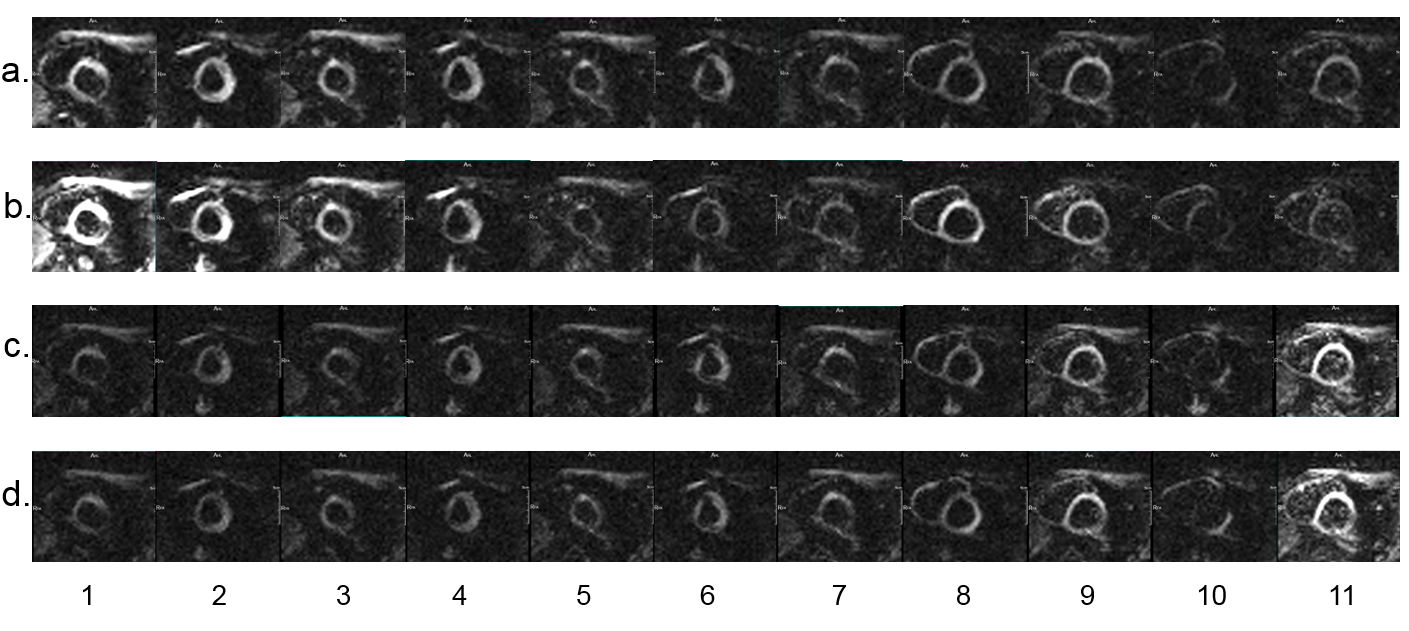
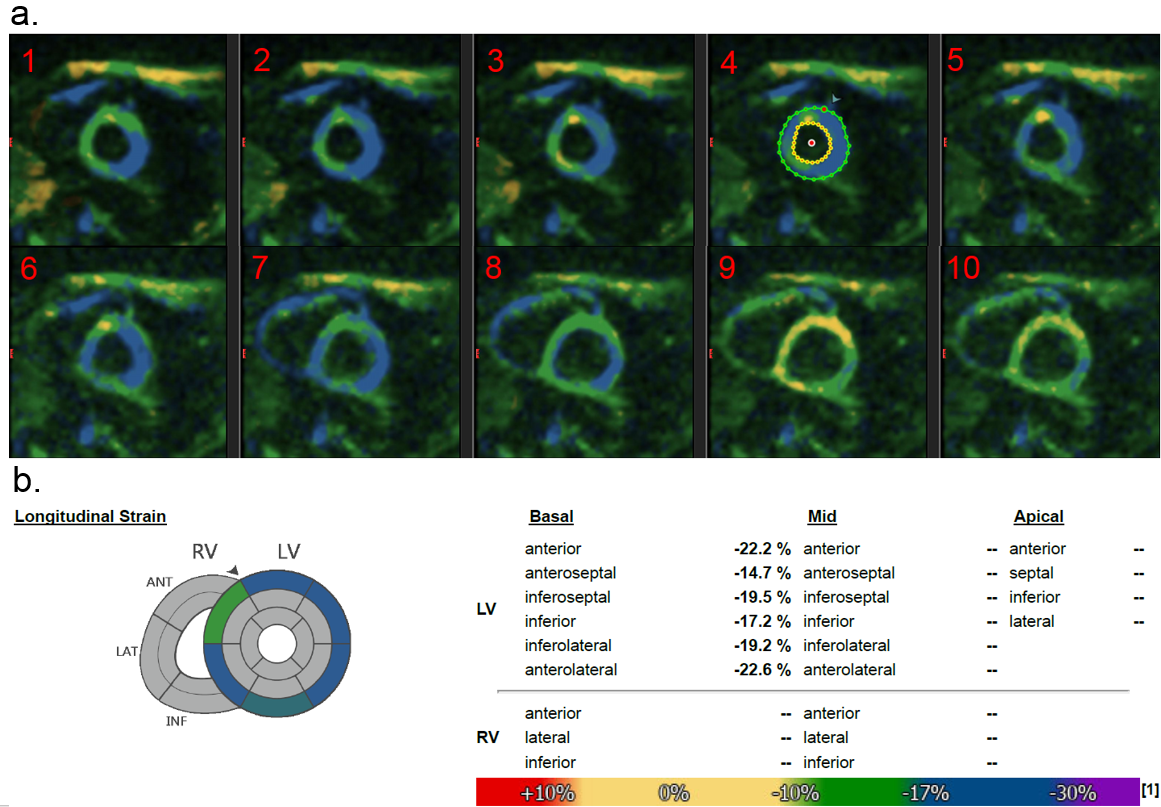
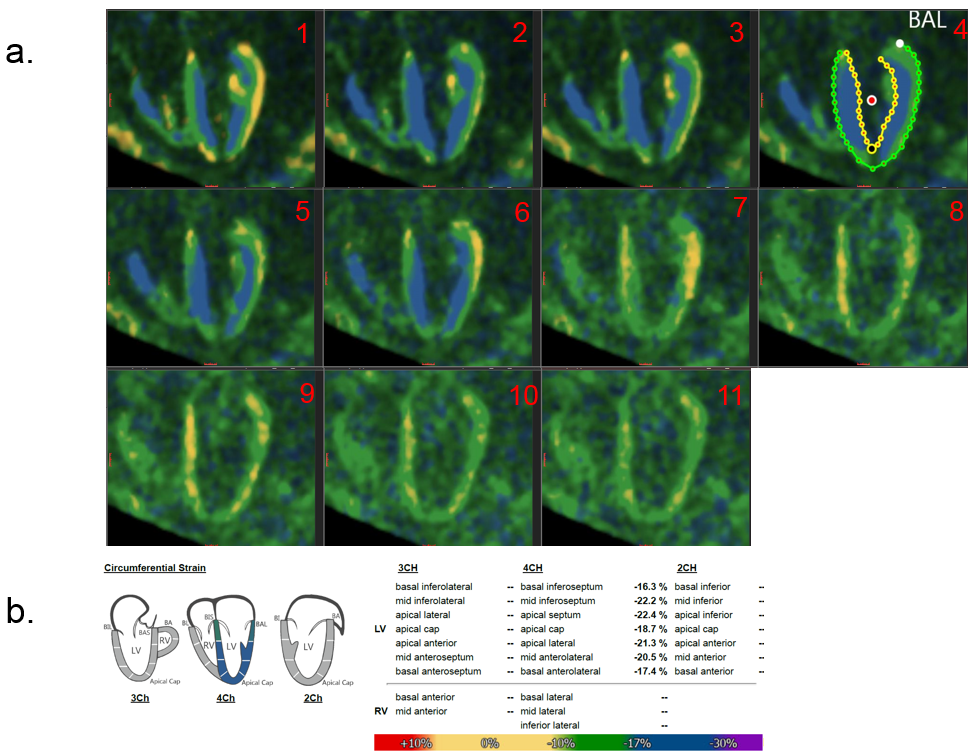
The modified SENC sequence generated more SNR compared to its regular version. In figure 2, we show the images at trigger time about 226 ms with three experiments: (a) FA = 30, regular SENC (b) FA = 30, fewer phases (c) FA = 60, fewer phases. The SNR was estimated as the mean value of ROI divided by the noise variation in the background, also with a correction factor $$$\sqrt{\frac{2}{4-\pi}} =1.53$$$ because of the Rayleigh distribution of background noise in magnitude images4. $$$m_{ROI}$$$ is the mean value of selected ROI, while $$$s_{noise}$$$ is the standard deviation of the background noise. $$SNR=\frac{S_{mean}}{\sigma_{stdv}}=\frac{m_{ROI}}{\sqrt{\frac{2}{4-\pi}}s_{noise}}$$ With fewer acquired cardiac phases, the SNR is higher compared to full phases. Also, with increased flip angle as shown in (c), the SNR increased as expected. With shortened RF train, higher flip angle increases the SNR in EPI acquisition. This helped us in the pixel by pixel calculation of the strain values, which gives us more accurate strain values for the heart. Figure 3 shows all the images from modified SENC sequence with different RF flip angles: (a) FA = 30 (b) FA = 60 (c) FA = ramped to 75 (d) FA = ramped to 90. The ramped RF train demonstrates that the signal is maintained more constant during the cardiac phases, compared to the constant RF pulse trains. The images can be assessed using the software provided my Myocardial Solution Inc(MSI), Morrisville, NC, USA. The DICOM images are imported by MSI software to do post-processing, and the strain images are generated with peak strains calculated. Figure 4 shows short-axis heart strain images and the longitudinal strain values for left ventricle (LV). Figure 5 shows the 4-chamber heart strain images and the circumferential strain values for LV. All these calculated strain values are expected for a healthy young volunteer.Discussion and Conclusion
We have proposed the modified SENC sequence for higher SNR in the myocardium strain quantification. With phantom and volunteer scans, we have demonstrated that the proposed method can generate higher SNR in the SENC images acquisition, and a direct comparison between the regular full cardiac phases acquisition and the selected cardiac phases acquisition around end-systole shows that our method generates more accurate strain calculation. Although we get fewer cardiac phases scanned and there are fewer detailed strains value regarding different phases, the most important one which is the peak strains can still be calculated with more accuracy.Acknowledgements
No acknowledgement found.References
1. Osman F., Sampath, S., Atalar, E., Prince, J., Imaging Longitudinal Cardiac Strain on Short-Axis Images Using Strain-Encoded MRI, Magn Reson Med, 2001; 46:324-334.
2. Pan, L., Stuber, M., Kraitchman, D., Fritzges, D., Gilson, W. and Osman N., Real-Time Imaging of Regional Myocardial Function Using Fast-SENC, Magn Reson Med. 2006; 55:386-395.
3. Fischer, S., McKinnon, G., Scheidegger, M., Prins, W., Meier, D., Boesiger, P., True Myocardial Motion Tracking, Magn Reson Med. 1994; 31:401-413.
4. Dietrich, O., Raya, J., Reeder, S., Reiser, M., & Schoenberg, S., Measurement of signal-to-noise ratios in MR images: Influence of multichannel coils, parallel imaging, and reconstruction filters. J of Magn Reson Imaging 2007; 26(2): 375–385
Figures