2187
Cardiac MRI for identifying radiation therapy effect on the heart
El-Sayed H Ibrahim1, Dhiraj Baruah1, Pierre Croisille2, Jadranka Stojanovska3, Jason Rubenstein1, Rachel Schlaak1, Anne Frei1, Elizabeth Gore1, and Carmen Bergom1
1Medical College of Wisconsin, Milwaukee, WI, United States, 2Jean-Monnet University, Lyon, France, 3University of Michigan, Ann Arbor, MI, United States
1Medical College of Wisconsin, Milwaukee, WI, United States, 2Jean-Monnet University, Lyon, France, 3University of Michigan, Ann Arbor, MI, United States
Synopsis
Lung cancer is the most frequently diagnosed cancer worldwide. Radiation therapy (RT) is standard-of-care in one-third of the patients, where the incidence of cardiac complications in lung cancer patients after RT reaches 33%. The current paradigm for cardiotoxicity detection and management relies primarily upon assessment of ejection fraction (EF). However, cardiac injury can occur without a clear change in EF. In this study, we investigate the effect of RT on global and regional cardiac function and myocardial T1/T2 values. The results show the capability of regional cardiac MRI for depicting early changes in myocardial contractility pattern and tissue characterization post-RT.
Introduction
Lung cancer is the leading cause of cancer-related deaths, accounting for about 25% of all cancer deaths.1 About one-third of lung cancer patients are treated with radiation therapy (RT), where the incidence of cardiac complications in lung cancer patients after RT is as high as 33%.2 The current paradigm for cardiotoxicity detection and management relies primarily upon the assessment of LV ejection fraction (EF), which may not reflect the underlying advancement of subclinical cardiovascular disease.3 Therefore, there is a need for identifying new markers capable of early detection of RT-induced cardiotoxicity in lung cancer. Myocardial strain, showed to be a sensitive measure for early recognition of cardiac dysfunction and identification of patients at risk of heart failure.3,4 Further, T1 and T2 mapping techniques showed capabilities for myocardial tissue characterization in different cardiovascular diseases.5 In this study, we investigate the capabilities of MRI strain imaging and T1/T2 mapping techniques for identifying early development of RT-induced subclinical cardiac dysfunction in a small-animal model of lung cancer RT.Methods
A total of 22 salt-sensitive (SS) adult rats were divided into two groups: control (n=7) and RT (n=15). The RT group received image-guided localized whole-heart RT to 24 Gy using 3 equally-weighted fields, and then was divided in two groups that were imaged at 8 weeks post-RT (n=6) and at 10 weeks post-RT (n=9). All rats (control and RT) were imaged when they are around the same age of 20 weeks on a Bruker 9.4T Biospec MRI scanner with 30-cm bore diameter and equipped with 4-element surface coil. The MRI scan included cine, tagging, and T1 (MOLLI) and T2 (spin-echo) mapping sequences. Total scan time was about one hour. The cine images were analyzed to measure EF, end-diastolic volume (EDV), and myocardial mass. The MOLLI and spin-echo images were analyzed to generate T1 and T2 maps, respectively. The tagged images were analyzed using the Sinusoidal Modulation (SinMod) technique to measure myocardial circumferential (Ecc) strain, radial (Err) strain, and longitudinal (Ell) strains.Results
Global cardiac function was normal in all rats (Figure-1), with increased EF and myocardial mass in the RT rats compared to controls. EF and mass were 67±7%, 78±2, 79±3% and 0.38±0.04g, 0.49±0.04g, 0.56±0.04g in the control, 8-week post-RT, and10-week post-RT rats, respectively. EDV values were slightly smaller in the RT rats. EDV = 0.29±0.02ml, 0.26±0.03ml, and 0.26±0.02ml in the control, 8-week post-RT, and10-week post-RT rats, respectively. Despite normal global function, strain measurements showed reduced (absolute) values in the RT rats compared to controls, where changes post-RT in Ecc were more than changes in Err or Ell. Global Ecc = -14.1±2.2%, -10.2±0.7%, and -8.4±0.5%; global Err = 23.3±4.0%, 21.7.2±3.7%, and 20.9.2±6.0%; and global Ell = -15.6±1.8%, -12.3±1.0%, and -12.7±1.9% in the control, 8-week post-RT, and10-week post-RT rats, respectively. The strain measurements showed larger change between the control and the 8-week post-RT rats compared to the change between the 8-week and 10-week post-RT rats. Err showed wider range of values, especially at the basal and apical sites, compared to Ecc and Ell ranges of values. On the regional basis, changes in strain values between different rat groups showed different patterns, as shown in Figure-2. Figure-3 shows representative T1 and T2 maps in a mid-ventricular SAX slice in control and RT rats. T1 maps showed average myocardium T1 values of 647±69ms, 619±41ms, and 655±46ms in the control, 8-week post-RT, and10-week post-RT rats, respectively. In general, T1 values were slightly affected by RT with no statistically significant differences between T1 values from different rat groups, although T1 values in the 10-week post-RT rats were closer to those in the control rats than to the values in the 8-week post-RT rats. The T2 maps showed average myocardium T2 values of 12.7±0.8ms, 16.2±1.1ms, and14.7±1.8ms in the control, 8-week post-RT, and10-week post-RT rats, respectively, where the T2 values post-RT were elevated in the 8-week post-RT rat group compared to the control rats, and then partially resolved in the 10-week post-RT rat group.Discussion
The most interesting finding in this study is the increased EF post-RT, where EF increased from 67% in the control rats to 78% and 79% in the 8-week and 10-week post-RT rats. This was accompanied by significant ventricular hypertrophy: 29% and 47% corresponding increases in myocardial mass, compared to control values. This reflects the nature of cardiac remodeling to maintain global function in the face of acute injuries from RT. Despite the normal global function, the MRI tagging-generated regional cardiac function parameters revealed deteriorated myocardial contractility. Specifically, myocardial strain showed to be a sensitive marker for detecting subclinical cardiac dysfunction, where different strain components helped characterize the nature of abnormal contractility patterns. The myocardial T1 and T2 values showed different changing pattern between different rat groups. T1 and T2 values have previously been used for assessment of changes in tissue composition, e.g. diffuse fibrosis (increased T1) and edema (increased T2) formation, which could be part of acute cardiac response to RT.Conclusion
In conclusion, regional cardiac functional imaging and tissue characterization by MRI provides detailed information about myocardial contractility pattern post-RT and allows for early detection of induced cardiotoxicity before global cardiac function is affected.Acknowledgements
Funding from Daniel M. Soref Charitable Trust, MCW, USA.References
- Verma V et al. Radiother Oncol 2018.
- Haque W et al. Int J Radiat Oncol Biol Phys 2018;100(2):470-7.
- Salerno M et al. Circ Cardiovasc Imaging 2017;10(6).
- Venkatesh BA et al. J Magn Reson Imaging 2015;42(1):153-9.
- Jordan JH et al. Circ Cardiovasc Imaging 2014;7(6):872-9.
Figures
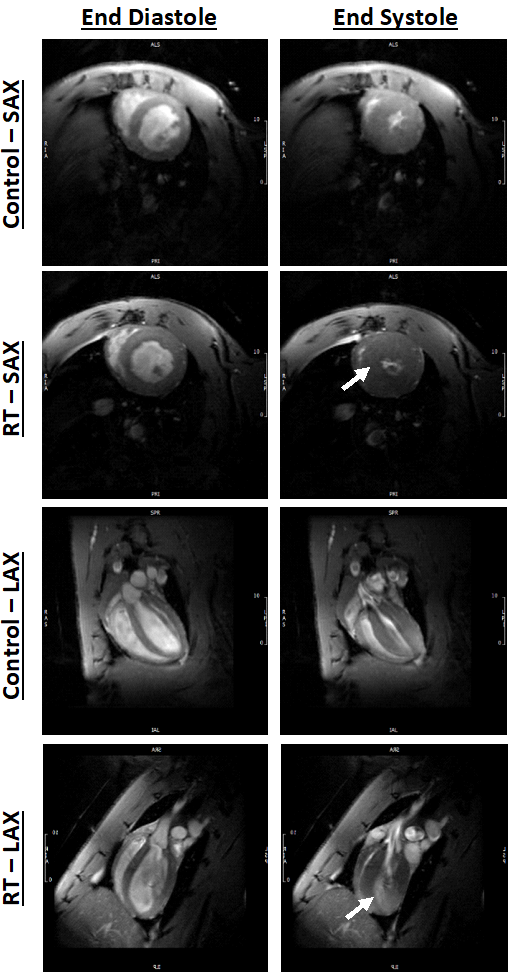
Figure 1. Short-axis (SAX) and long-axis (SAX) cine images showing
end-diastolic (ED) and end-systolic (ES) images in both control and radiation
therapy (RT) rats. The images show preserved cardiac function post-RT, along
with cardiac remodeling and hypertrophy (arrows) compared to controls.
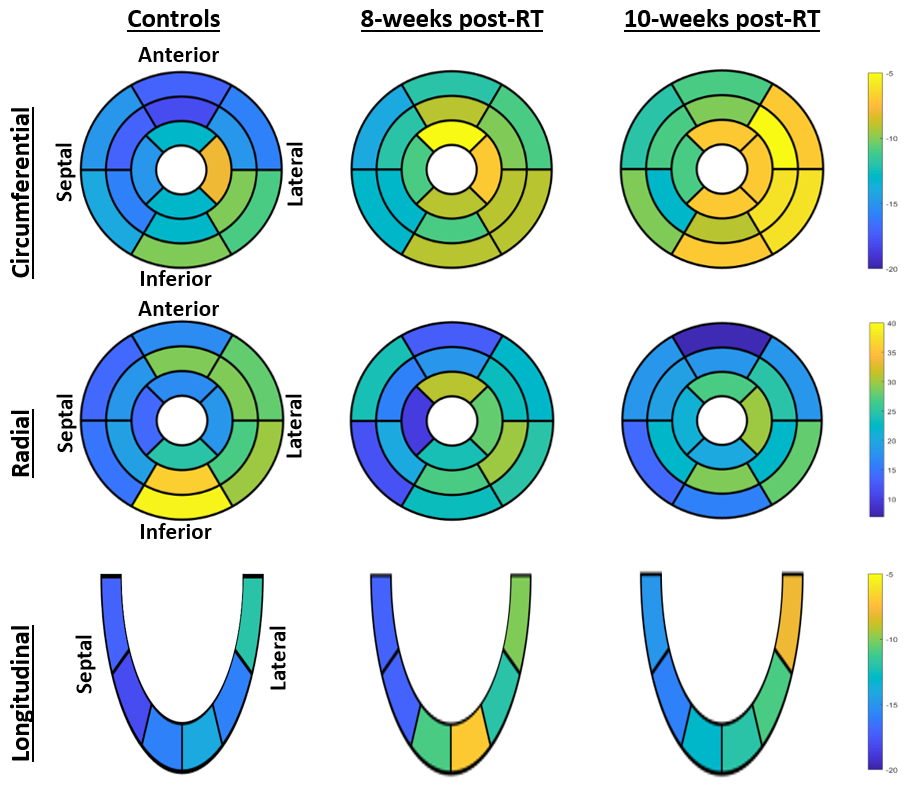
Figure 2. Segmental distribution of average percentage strain (Ecc, Err, and
Ell; %) in three rat groups (controls, 8-week post-RT, and 10-week post-RT).
AHA 17-segment model is used for presenting Ecc and Err, which shows basal,
mid-ventricular, and apical levels. Note reduced strain values post-RT, which
is different based on segment location and strain component.
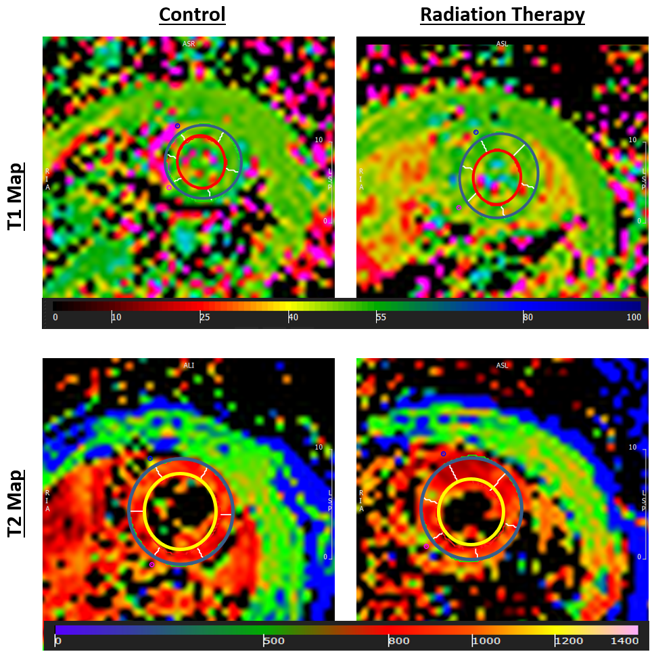
Figure 3. T1 and T2 maps of a mid-ventricular slice from control and RT rats
(T1 and T2 measurements are in ms). Note slight difference in values (color)
between control and RT rats.