2179
Quality prediction score: predicting the CNN-based segmentation performance for cine cardiac MR images1Department of Electrical Engineering, National Taiwan University of Science and Technology, Taipei, Taiwan
Synopsis
In this study, we evaluated the open-source toolbox for heart segmentation by using cross-institutional datasets. Furthermore, we proposed to use a quality prediction socre to provide the estimation of the qualitfy of the cardiac segmentation. The QPS values were highly correlated to the Dice coefficients of the test datasets.
Purpose
In our study presented in ISMRM 2019 [1], we implemented an open-source toolbox for heart segmentation in multi-phase cine cardiac images. The toolbox was based on the convolutional neural network. In this study, we explored the relatively low accuracy when deploying models cross institutes. In addition, we proposed to use a quality prediction score (QPS) to predict the performance of the model and identify the potentially failed segmentation.Material and Methods
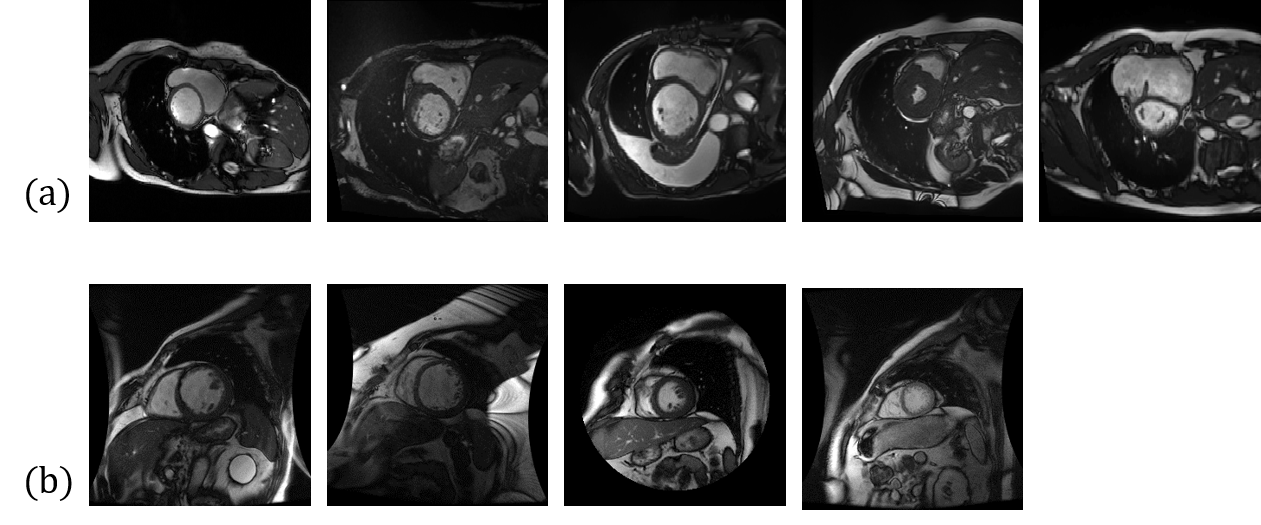
This study included two datasets of MR cardiac images, (1) the Automated Cardiac Diagnosis Challenge (ACDC) dataset [2, 3] and (2) the Sunnybrook Cardiac Data (SCD) dataset. The ACDC dataset was acquired in the the Hospital of Dijon (France). It consisted of 100 participants diagnosed as 5 groups, (1)normal (2) previous myocardial infarction, (3) dilated cardiomyopathy, (4) hypertrophic cardiomyopathy, (5) abnormal right ventricle.The SCD dataset is provided by Sunnybrook Health Sciences Centre, Toronto, Canada. It consists of 45 cine cardiac images collected 4 groups: (1) heart failure with infarction, (2) heart failure without infarction, (3)left ventricle hypertrophy, and (4) healthy group. The example of the ACDC and the SCD datasets are displayed in Figure 1.In the open-source toolbox, we implemented a U-Net model [1] with the ACDC dataset to achieve automatic cardiac segmentation and obtain a heart mask labeled as 0: background, 1: right ventricle blood pool (RVb), 2: left ventricle walls (LVw), and 3: left ventricle blood pool (LVb). The Dice coefficient of prediction was 0.91 to 0.96 in the test set of the ACDC. In this study, we evaluated the accuracy of the model with the SCD dataset to assess the inter-institutional variations. To calculate the QPS, we obtained the softmax values of the three output layers (RVb, LVw, LVb) of the U-Net model. The softmax values presented the probability of the category that the individual pixel belongs to. In general, higher softmax value indicates that the model is more confident one the prediction. Thus the QPS is derived from the the number of images with the average softmax value higher than 0.9 divided by the number of slices.Results
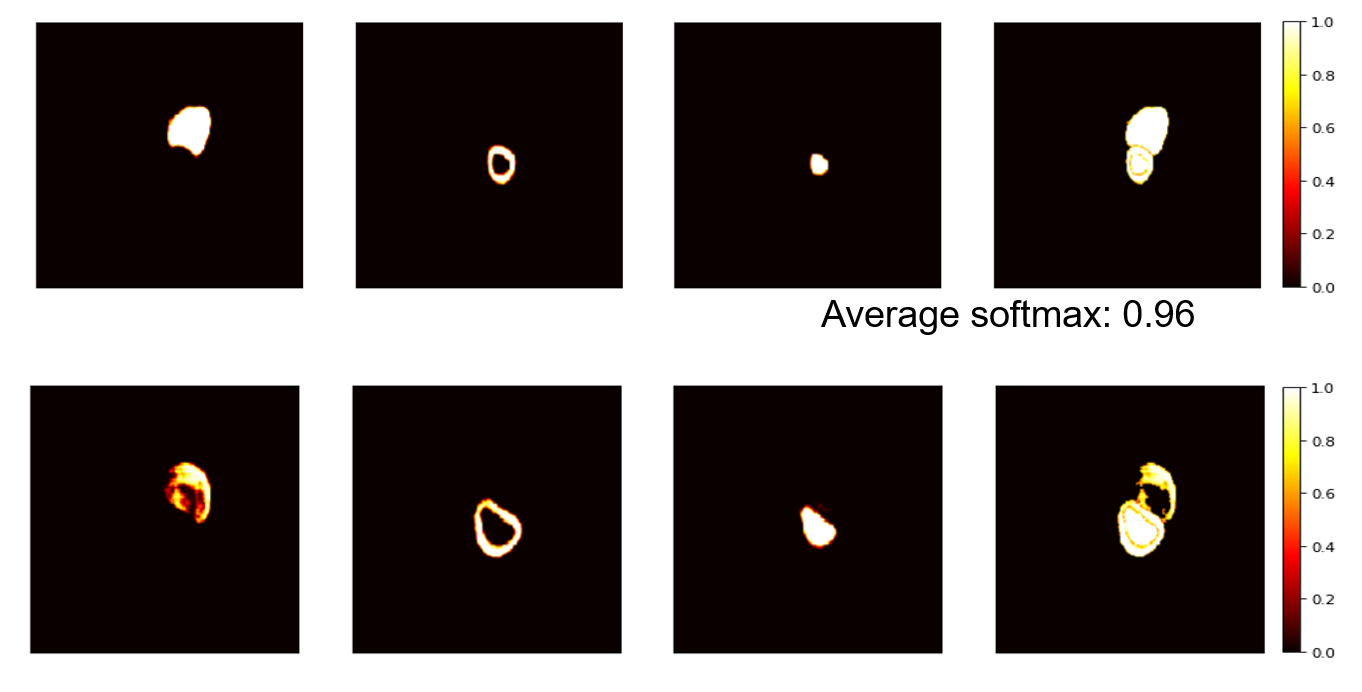
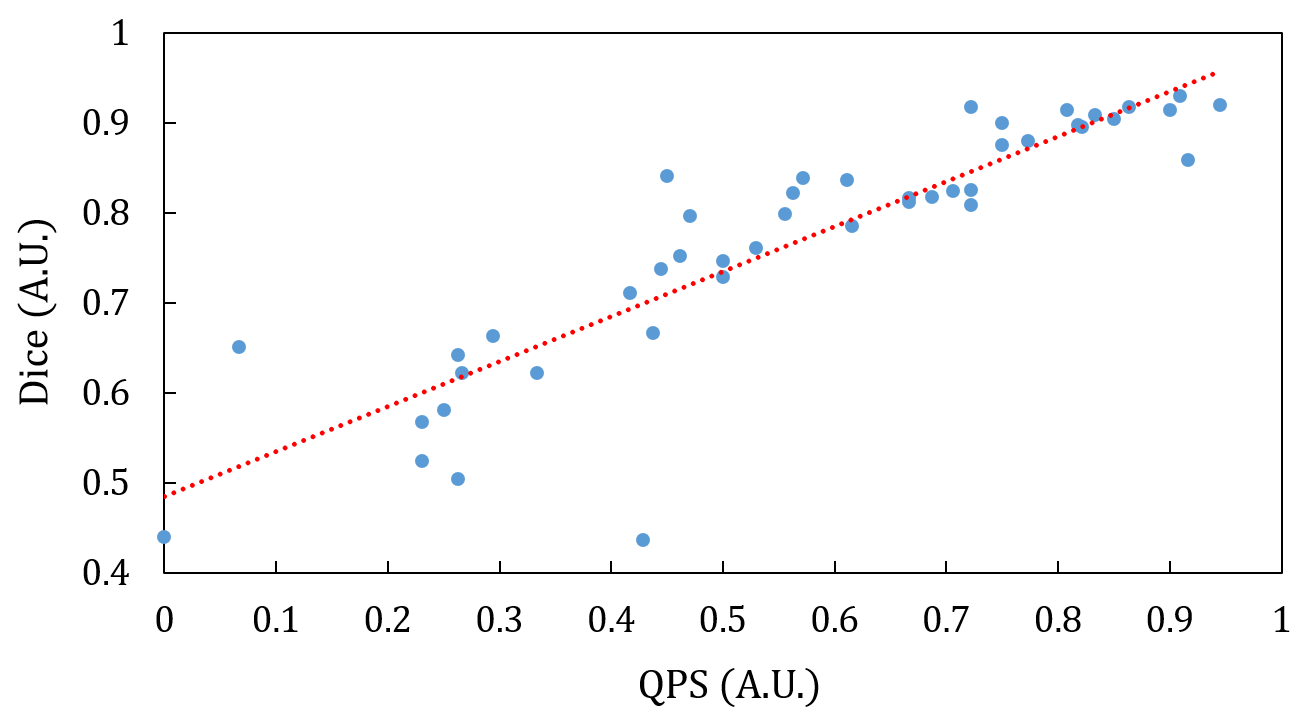
Figure 2 displays an example of the softmax maps of the SCD datasets. Notice that some images in the SCD dataset presents image inhomogenity and circle FOV is used in one of the example images. The average softmax values with the predicted heart region is 0.96 and 0.87 for Fig. 2(a) and Fig. 2(b), respectively. The average softmax value indicated the confidence of the predictions. The average Dice coefficients of the SCD datasets were 0.66, which was prominently worse than the test results of the ACDC datasets. Figure 3 displays the scatter plot of the Dice coefficients versus the QPS values (the Pearson’s correlation coefficients = 0.89).Discussions and Conclusions
In this study, we aimed to evaluate the prediction accuracy when we apply the deep-learning model cross institutes. In the results, the accuracy of the SCD datasets (Dice: 0.66) was worse that the ACDC dataset (Dice > 0.9). This discrepancy could be resulted from different MRI scanners and sequences. As we can observe in Fig. 1, some images in the SCD dataset were acquired using a circle FOV. Furthermore, we identified images with inhomogeneity in the SCD dataset. These factors could be the reason of inter-institutional variations of the model. The results suggest that cautions should be taken when we applied the “AI” system for help the image diagnosis. In our preliminary results, fine-tuning the SCD dataset can improve the average Dice coefficients to 0.93. In addition, we then proposed the QPS value to predict the outcome of the model. The QPS value was highly correlated of the Dice coefficients of the test results. It can provide a failure alarm for the user to notice the potential problems of the AI system. Using datasets from the local cohort to finetune the model to improve the accuracy. Selecting the datasets for finetuning according to the QPS values could improve the accuracy and warrants further investigations. In summary, we evaluated the inter-institutional variations of the deep-learning-based cardiac segmentation toolbox and proposed a QPS value to provide an estimate for the prediction. The analysis system is available at https://github.com/htygithub/CSEG.Acknowledgements
This study was supported by the Ministry of Science and Technology, Taiwan (MOST 107-2314-B-011-002-MY3). We are gratefulto the National Center for High-performance Computing for computer time and facilities.References
[1] Zheng-Shen Lin, Teng-Yi Huang, Fully automatic segmentation of cine cardiac MR images based on deep learning: an open-source toolbox with a failure alarm mechanism
[2] Olaf Ronneberger, Philipp Fischer, Thomas Brox, “U-Net: Convolutional Networks for Biomedical Image Segmentation”, Medical Image Computing and Computer-Assisted Intervention (MICCAI), Springer, LNCS, Vol.9351: 234--241, 2015, available at arXiv:1505.04597
[3] Automated Cardiac Diagnosis Challenge https://www.creatis.insa-lyon.fr/Challenge/acdc/. Accessed on 2019/11/1
Figures