2178
Comprehensive assessment of the left ventricle using cardiac magnetic resonance in patients with pre-capillary pulmonary hypertension1Radiology, Northwestern University, Chicago, IL, United States, 2Siemens Medical Solutions USA, Chicago, IL, United States, 3Medicine, Northwestern University, Chicago, IL, United States, 4Biomedical Engineering, Northwestern University, Chicago, IL, United States
Synopsis
Cardiac MR provides valuable information of the cardiac structure-function, but it is underutilized in the diagnosis and monitoring patients with pulmonary hypertension. In this study, we performed a comprehensive evaluation of the left ventricle in patients with pre-capillary pulmonary hypertension including feature-tracking strain, T1 mapping, and tissue phase mapping. We also evaluated the association of these CMR-derived quantitative measures with right heart catheterization derived pressure measurements.
Introduction
Pulmonary hypertension (PH) is a life-threatening disease affecting the pulmonary circulation represented by a complex hemodynamic and pathophysiological state [1]. The current diagnosis of PH relies heavily upon measurements taken during invasive right heart catheterization (RHC). Recently, cardiac magnetic resonance (CMR) is emerging as a promising diagnostic and prognostic modality in PH [2-4]. This study performed a CMR-based evaluation of the left ventricle (LV) in patients with pre-capillary PH, including quantification of ejection fraction (EF), volumes and mass, global and segmental myocardial CMR-feature tracking (CMR-FT) strain, myocardial T1 relaxation times and extracellular volumes (ECV), and myocardial tissue velocities derived from tissue phase mapping (TPM). We also evaluated the correlation of the quantified CMR parameters with RHC-derived pressures.Methods
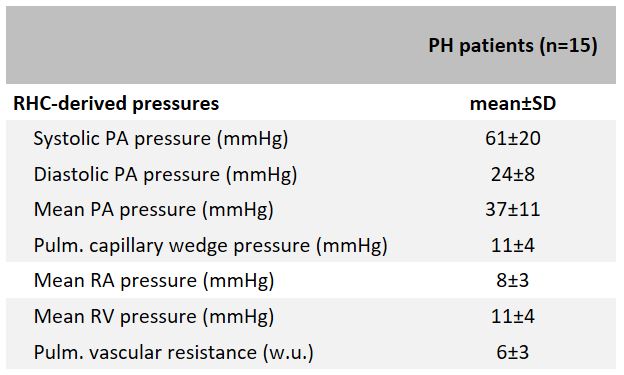
Study cohort: After informed consent, n=15 patients (mean age, 55±15 years; male/female, 7/8; mean heart rate, 71±10 bpm) with pre-capillary PH (mean pulmonary artery (mPAP) ≥25 mm Hg and pulmonary capillary wedge pressure [PCWP] ≤15 mm Hg at rest as assessed by RHC [1]) were prospectively recruited to undergo CMR within 30 days of RHC as part of an ongoing IRB-approved study. N=15 age and sex-matched healthy controls (mean age, 53±14 years; male/female, 9/6; mean heart rate, 66±7 bpm) were also recruited under the same IRB for CMR imaging.Right heart catheterization: RHC was performed using a Swan-Ganz catheter introduced via femoral or internal jugular approach and the hemodynamic measurements included mean right atrial pressure (mRAP; mmHg), systolic PA pressure (sysPAP; mmHg), diastolic PA pressure (diasPAP; mmHg), mPAP (mmHg), PCWP (mmHg), and pulmonary vascular resistance (PVR; 1 w.u. = 1 mmHg min/L). Table 1 shows the mean RHC pressures in our patient cohort.
CMR acquisition: CMR was performed at 1.5T (Aera, Siemens Healthcare, Erlangen, Germany) and included: (1) retrospectively ECG-gated breath-hold bSSFP cine-imaging at multiple short-axes, two-chamber, three-chamber, and four-chamber views; (2) short-axis diastolic myocardial T1 maps at the basal, mid-ventricular, and apical levels using a prototype MOdified Look-Locker Inversion Recovery (MOLLI) sequence; (3) k–t accelerated prospectively ECG-gated, black-blood prepared gradient echo sequence with three-directional velocity encoding for TPM was also acquired in 11 patients and 6 controls.
Data analysis: LV volumes, EF, and mass was assessed by manually delineating the epicardial and endocardial borders on the short-axis cines at the systolic and diastolic images (cvi42, Circle Cardiovascular Imaging, Calgary, Canada) and was adjusted for body surface area. LV global and segmental peak radial (Err), circumferential (Ecc) and longitudinal strains (Ell) were quantified by manually segmenting the diastolic phase on the short-axis and the three long-axes cine images (cvi42, Calgary, Canada). The software automatically propagated the contours using feature-tracking to calculate the strain values. Segmental native T1 and ECVs were derived by manually segmenting the T1 maps based on the 16-segment AHA model in cvi42. Global myocardial T1 and ECV were calculated as the mean over all 16 segmental values. Post-processing and data analysis were performed using a custom software package developed in MATLAB (The MathWorks, Natick, MA, USA). Wilcoxon rank-sum test was used for statistical comparisons and Spearman correlation was used to test associations.
Results
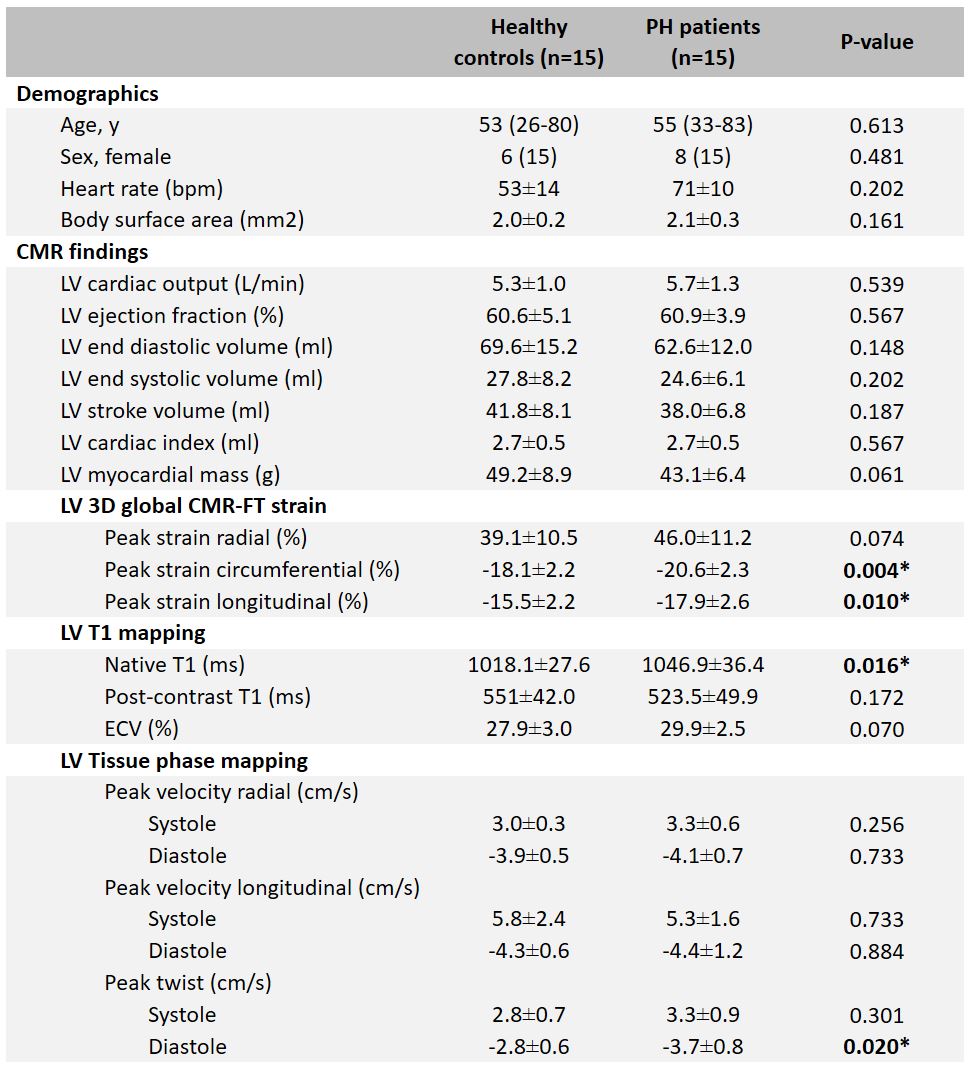
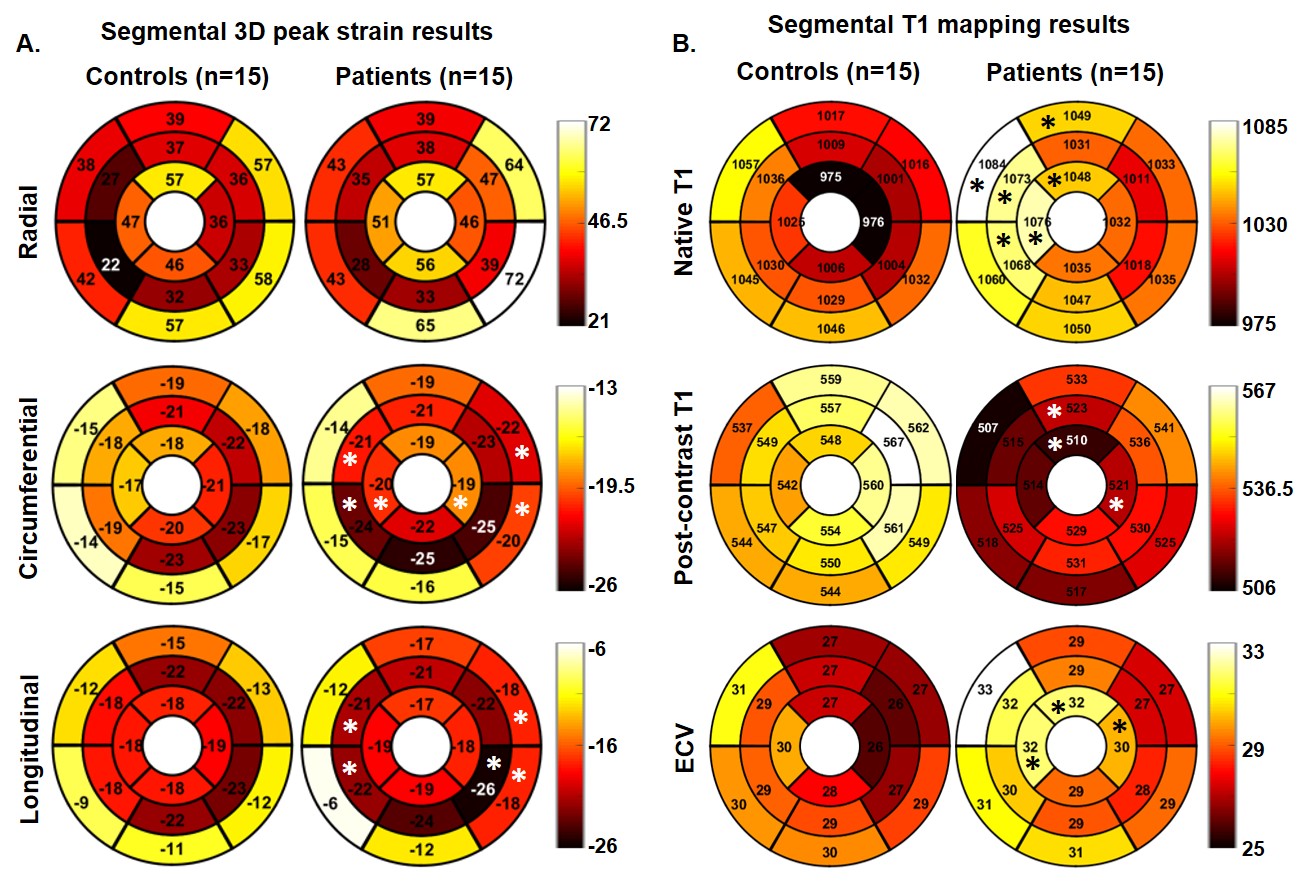
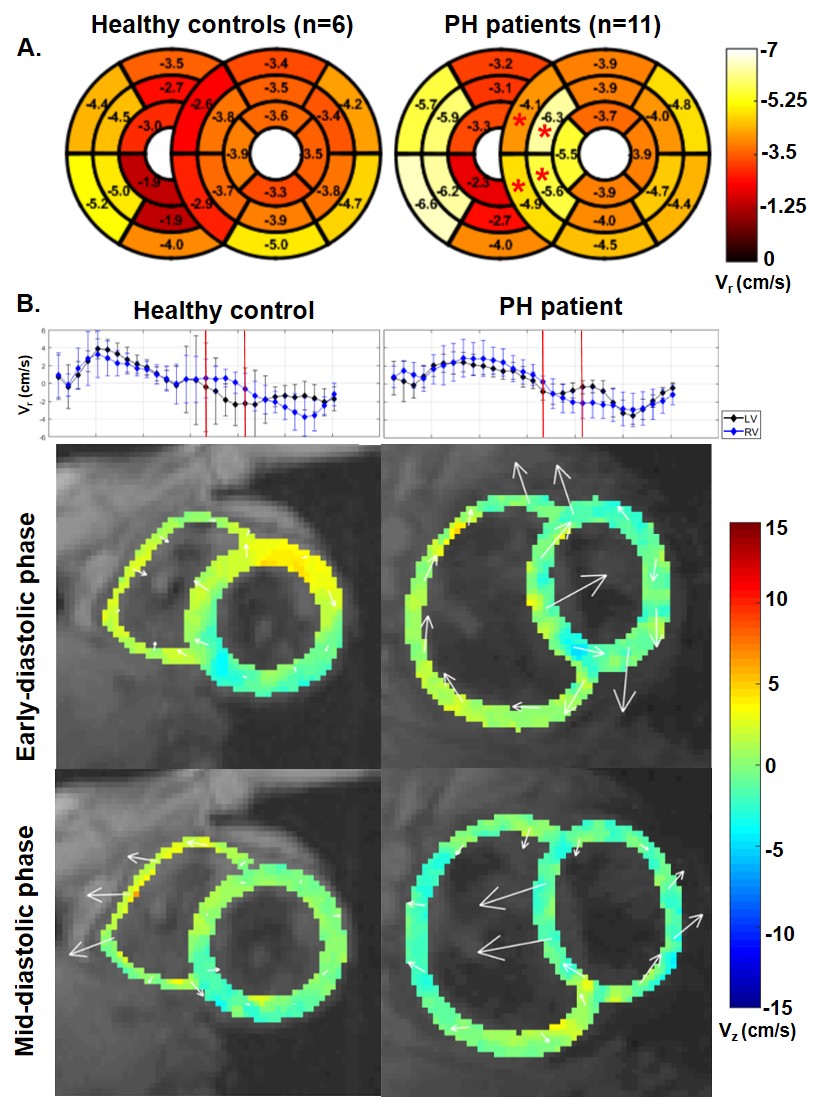
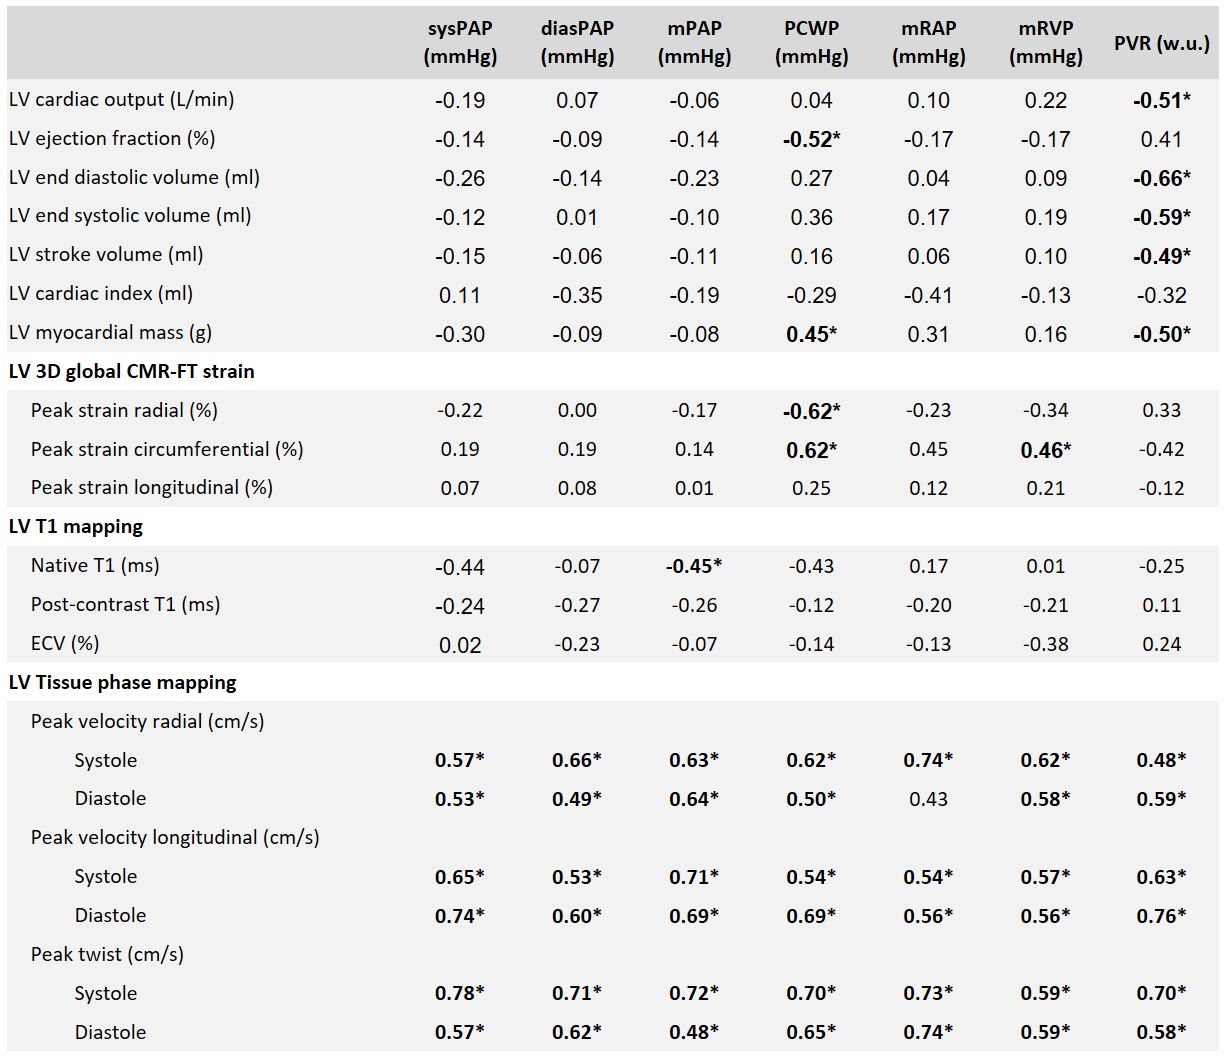
Table 2 provides detailed results of comparison of the CMR-derived quantitative measures between the controls and PH patients. Global peak Ecc (-20.6±2.3% vs. -18.1±2.2 %, p=.004) and Ell (-17.9±2.6% vs. -15.5±2.2 %, p=.010) were significantly higher in PH patients when compared to controls. Segmental results are shown in figure 1. Global native T1 was significantly higher in PH patients when compared to controls (1052±31 ms vs. 1012±32 ms, p=.016). Segmental results are shown in figure 1. Even though the global LV myocardial velocities were not significantly different between the patients and controls, PH patients had significantly elevated septal peak diastolic radial velocities when compared to controls (-5.3±1.7 cm/s vs. -3.4±0.6 cm/s, p<.001) (figure 2). An increase in septal leftward in-plane velocities during early diastole and rightward in-plane velocities during mid-diastole were seen in several cases (figure 2). Diastolic peak twist was higher in patients when compared to controls (-3.7±0.8 cm/s vs. -2.8±0.6 cm/s, p=0.020). Table 2 provides detailed results of correlation of the CMR-derived quantitative measures with RHC-derived pressures.Discussion
The findings of this study showed that several CMR-derived quantitative measures including global Ecc and Ell, native T1 times, and peak diastolic twists were significantly different in PH patients when compared to controls. On segmental evaluation, we found that the significant differences for most of the quantified parameters (peak strain, native T1, diastolic radial tissue velocities) tends to be localized at the interventricular septum. The increased septal velocities may be due to septal bouncing due to severe PH [5, 6]. We also demonstrated significant correlations between the RHC-derived pressures and various CMR-derived measures.Conclusion
Quantification of various CMR-derived metrics for left ventricular function evaluation provides valuable information and may aid RHC in the diagnosis and monitoring of PH. Future studies with larger PH patient cohorts are warranted to further study the impact of these altered CMR-metrics on patient outcomes and associations with disease severity.Acknowledgements
Financial support from Bayer Healthcare, Berlin, GermanyReferences
1. Galiè, N., et al., 2015 ESC/ERS Guidelines for the diagnosis and treatment of pulmonary hypertension: The Joint Task Force for the Diagnosis and Treatment of Pulmonary Hypertension of the European Society of Cardiology (ESC) and the European Respiratory Society (ERS): Endorsed by: Association for European Paediatric and Congenital Cardiology (AEPC), International Society for Heart and Lung Transplantation (ISHLT). European Heart Journal, 2015. 37(1): p. 67-119.
2. Swift, A.J., et al., Quantitative magnetic resonance imaging of pulmonary hypertension: a practical approach to the current state of the art. Journal of thoracic imaging, 2014. 29(2): p. 68-79.
3. Grünig, E. and A.J. Peacock, Imaging the heart in pulmonary hypertension: an update. European Respiratory Review, 2015. 24(138): p. 653-664.
4. Freed, B.H., et al., MR and CT Imaging for the Evaluation of Pulmonary Hypertension. JACC. Cardiovascular imaging, 2016. 9(6): p. 715-732.
5. Clancy, D.J., et al., Paradoxical septal motion: A diagnostic approach and clinical relevance. Australasian Journal of Ultrasound in Medicine, 2018. 21(2): p. 79-86.
6. Tanaka, H., et al., Diastolic bulging of the interventricular septum toward the left ventricle. An echocardiographic manifestation of negative interventricular pressure gradient between left and right ventricles during diastole. Circulation, 1980. 62(3): p. 558-63.
Figures