2167
Myocardial and Intraventricular Kinetic Energy in Patients with Fontan Circulation
Xue-Zhe Lu1, Ming-Ting Wu2, Ken-Pen Weng3,4, and Hsu-Hsia Peng1
1Department of Biomedical Engineering and Environmental Sciences, National Tsing Hua University, Hsinchu, Taiwan, 2Department of Radiology, Kaohsiung Veterans General Hospital, Kaohsiung, Taiwan, 3Department of Pediatrics, Kaohsiung Veterans General Hospital, Kaohsiung, Taiwan, 4Department of Pediatrics, National Yang-Ming University, Taipei, Taiwan
1Department of Biomedical Engineering and Environmental Sciences, National Tsing Hua University, Hsinchu, Taiwan, 2Department of Radiology, Kaohsiung Veterans General Hospital, Kaohsiung, Taiwan, 3Department of Pediatrics, Kaohsiung Veterans General Hospital, Kaohsiung, Taiwan, 4Department of Pediatrics, National Yang-Ming University, Taipei, Taiwan
Synopsis
We aimed to investigate the interaction between systolic myocardial and intraventricular kinetic energy (KEmyo, KEven) in Fontan patients. The tissue phase mapping and 4D flow datasets were acquired for calculation of KEmyo and KEven. The Fontan group showed decreased peak and mean systolic KEven, and decreased peak and mean systolic KEmyo. The KE delay, describing the subtraction of time-to-peak KEmyo from time-to-peak KEven, in Fontan group significantly correlated with peak and mean systolic KEven. In conclusion, the correlation between KE delay and KEven illustrated the adverse impact of abnormal energy transferring mechanism on the single functional ventricle in Fontan patients.
Introduction
The Fontan operation is a palliative procedure for maintaining cardiac function in patients with single functional ventricle1. The ventricular dysfunction and heart failure were reported in long-term studies of Fontan patients2,3. The global cardiac function was quantified to evaluate the risks of the complications4. The decreased diastolic intraventricular kinetic energy (KE), which is a new insight into cardiac function, was reported in patients with Fontan5,6. However, the energy transferring from myocardium to intraventricular blood flow has not been discussed. In this study, we evaluated the myocardial and intraventricular KE by using tissue phase mapping (TPM) magnetic resonance imaging and 4D flow, respectively. The purpose of this study was to investigate the interaction between systolic myocardial and intraventricular KE in patients with Fontan circulation.Methods
The study population recruited 16 Fontan patients (17.8±4.1 y/o, 10 males, 6 females) and 16 age- and sex-appropriate normal volunteers (22.0±1.2 y/o, 9 males, 6 females). The TPM and 4D flow data were acquired in a 3 Tesla MR scanner (Tim Trio or Skyra, Siemens, Erlangen, Germany) with prospective ECG trigging, sampling 90% of cardiac cycle and navigator-guided free-breathing technique. 4D flow datasets were obtained with scanning parameters of TR/TE=5.5/2.9 ms, flip angle=15∘, voxel size= 1.75 × 1.05 × 3.5 mm3, and Venc=150 cm/s. Region of intra-ventricle were determined manually on steady-state free precession images of short-axis planes covered whole-heart and applied to 4D flow data. The TPM datasets were acquired in a short-axis view at base, mid, and apex with parameters of TR/TE=6.6/4.4 ms, flip angle=7∘, voxel size= 1.37 × 1.37 × 6 mm3, and Venc=15 cm/s in-plane and 25 cm/s through-plane. The segmentation of myocardium was implemented manually on magnitude images and applied to phase images for calculation of myocardial KE. The voxel-wise KE in both intraventricular blood flow and myocardium was calculated by:$${KE} = \frac{1}{2} L \rho {\vec{v}}^2$$where L was the volume of voxel, $$$\vec{v}$$$ represented velocity, and ρ was the density. We use the value of 1.05 g/ml as the blood density and the value of 1.063 g/ml for myocardium7,8. The KE of the whole intraventricular flow (KEven) and myocardium (KEmyo) was evaluated by summing up of the KE of each voxel within the ROI. The cardiac phase was normalized as percentage of end-systole (%ES). The time-to-peak KEven and time-to-peak KEmyo were represented as TTPven and TTPmyo. The KE delay was calculated by the subtraction of TTPmyo from TTPven. Two-Sample T Test and Pearson’s r correlation coefficient were employed and p < 0.05 was considered statistical significance.Results
The demographics and cardiac MRI volumetric parameters in normal volunteers and Fontan patients were listed in Table 1. Figure 1 shows the time courses of KEven and KEmyo of a normal volunteer, and Fontan patients with normal KE delay and short KE delay during systole. Compared to normal group, the Fontan group showed decreased peak and mean systolic KEven (2.29 ± 0.84 mJ vs. 1.45 ± 0.85 mJ, 1.37 ± 0.44 mJ vs. 0.88 ± 0.36 mJ, p<0.01), and decreased peak and mean systolic KEmyo (0.10 ± 0.06 mJ vs 0.02 ± 0.02 mJ, 0.05 ± 0.02 mJ vs 0.02 ± 0.01 mJ, both p<0.001), as shown in Figure 2. Figure 3 illustrates that the Fontan group presented more diverse KE delay distribution in comparison with normal group. Longer TTPven (59.3 ± 9.1 %ES vs 47.4 ± 7.5 mJ, p<0.001) and TTPmyo (39.4 ± 12.1 %ES vs 22.1 ± 4.2 %ES, p<0.001) was shown in Fontan group. No significant difference of KE delay was shown between normal and Fontan groups, while the Fontan group presented larger coefficient of variation of intragroup KE delay (79.7% vs 29.6%). The KE delay in Fontan group significantly correlated with peak systolic KEven (r=0.546, p=0.029) and with mean systolic KEven (r=0.584, p=0.018), while no significant correlation was found in normal group.Discussion and Conclusions
In this study, Fontan patients exhibited decreased myocardial and intraventricular KE and prolonged TTPmyo and TTPven during systole. The correlation between KE delay and KEven was observed solely in Fontan group. Sjöberg et al previously reported that Fontan patients showed decreased intraventricular KE during diastole, reflecting the impaired ventricular filling6. In the current study, the decreased systolic KEven potentially revealed the reduced regional systolic mechanical force, as reported in the previous study7. The KE delay, describing the interaction between myocardium and intraventricular flow, can be employed as an energy transferring mechanism. The positive correlation between KE delay and reflected that short KE delay may have adverse impact on the KE accumulation in the ventricle before the ejection of blood flow to the aorta. Some of Fontan patients showed extremely short KE delay, of some even with negative KE delay, indicated altered energy transferring mechanism. Although the KEmyo calculated in this study only involved three slices, the decreased KEmyo can markedly revealed the decreased motion capability of myocardium in Fontan patients. In conclusion, the interaction between myocardium and intraventricular blood flow on Fontan patients in systole was explored from an insight of KE. The correlation between KE delay and KEven illustrated the adverse impact of abnormal energy transferring mechanism on the single functional ventricle in patients with Fontan circulation.Acknowledgements
No acknowledgement found.References
- d’Udekem Y, et al. The Fontan procedure: contemporary techniques have improved long-term outcomes. Circulation. 2007;116(11_supplement):I-157.
- Goldstein BH, et al. Relation of systemic venous return, pulmonary vascular resistance, and diastolic dysfunction to exercise capacity in patients with single ventricle receiving Fontan palliation. The American Journal of Cardiology. 2010;105(8):1169-1175.
- Khairy P, et al. Long-term survival, modes of death, and predictors of mortality in patients with Fontan surgery. Circulation. 2008;117(1):85-92.
- Sieweke JT, et al. Prediction of heart failure and death in an adult population of Fontan patients. Cardiology in the young. 2019;1-8.
- Wong J, et al. Exploring kinetic energy as a new marker of cardiac function in the single ventricle circulation. Journal of Applied Physiology. 2018;125(3): 889-900.
- Sjöberg P, et al. Decreased diastolic ventricular kinetic energy in young patients with Fontan circulation demonstrated by four-dimensional cardiac magnetic resonance imaging. Pediatric cardiology. 2017;38(4):669-680.
- Garg P, et al. Left ventricular blood flow kinetic energy after myocardial infarction-insights from 4D flow cardiovascular magnetic resonance. Journal of Cardiovascular Magnetic Resonance. 2018;20(1):61.
Figures
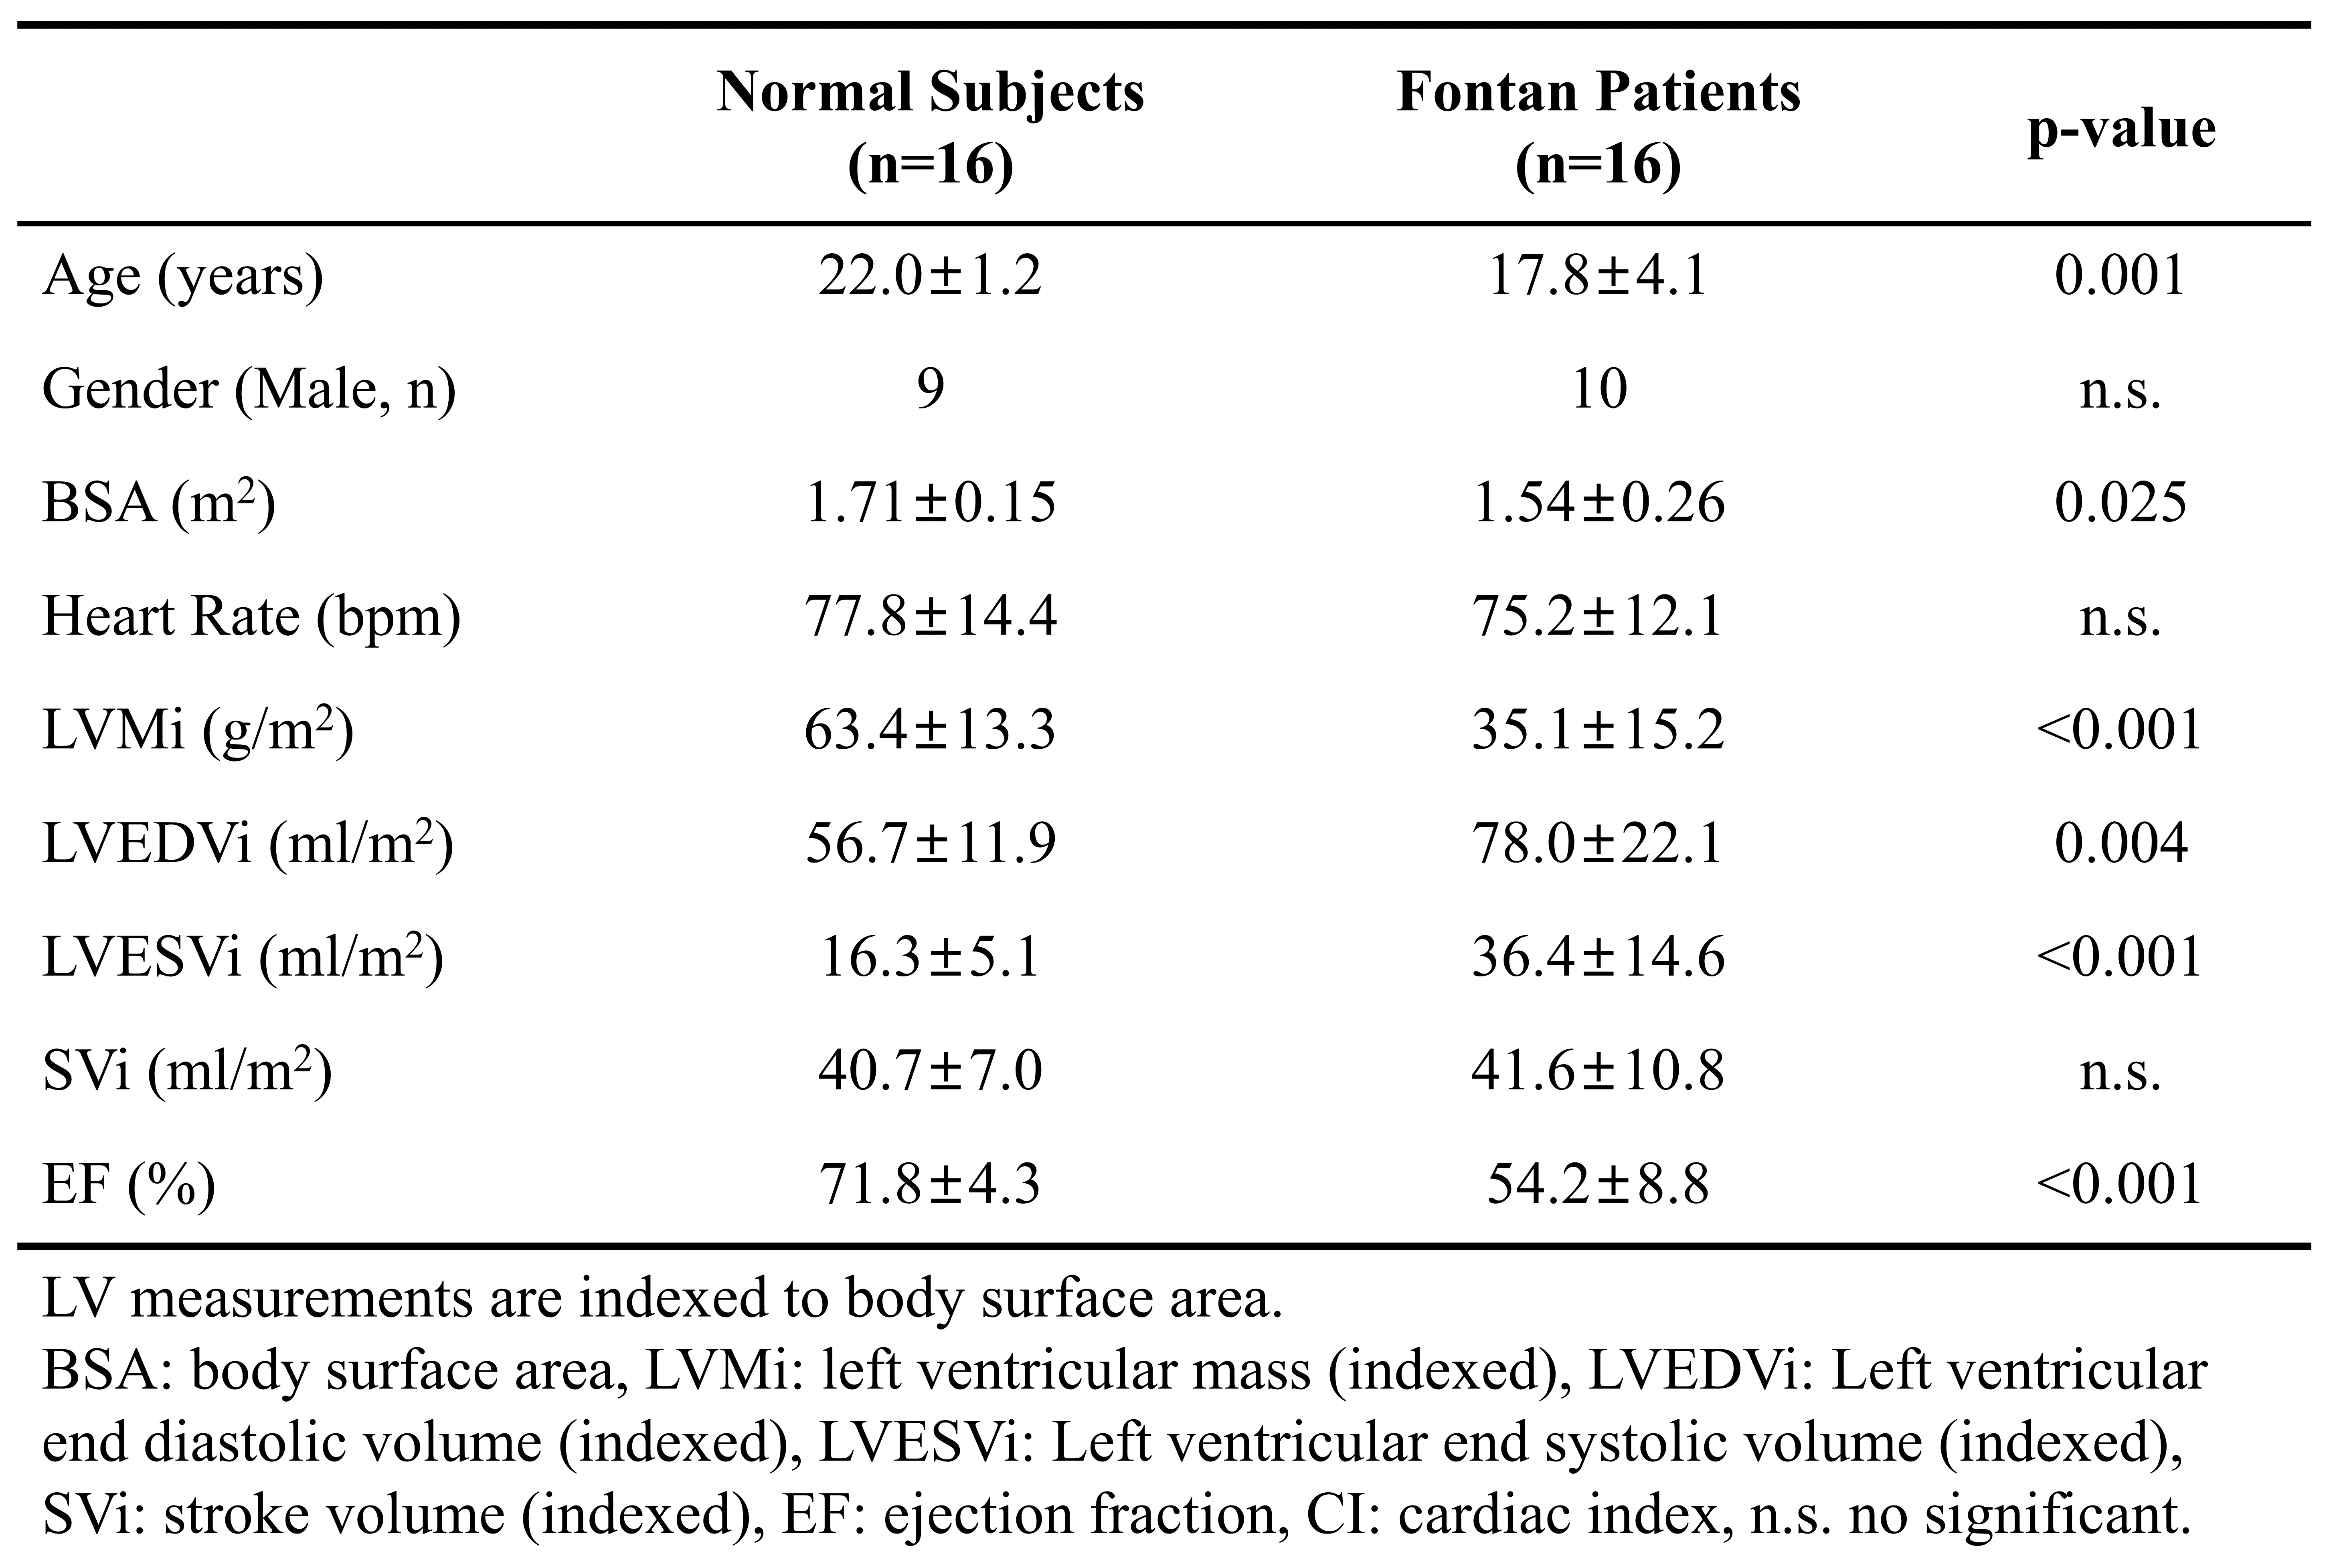
Table 1. Demographics and CMR
parameters in normal subjects and Fontan patients.
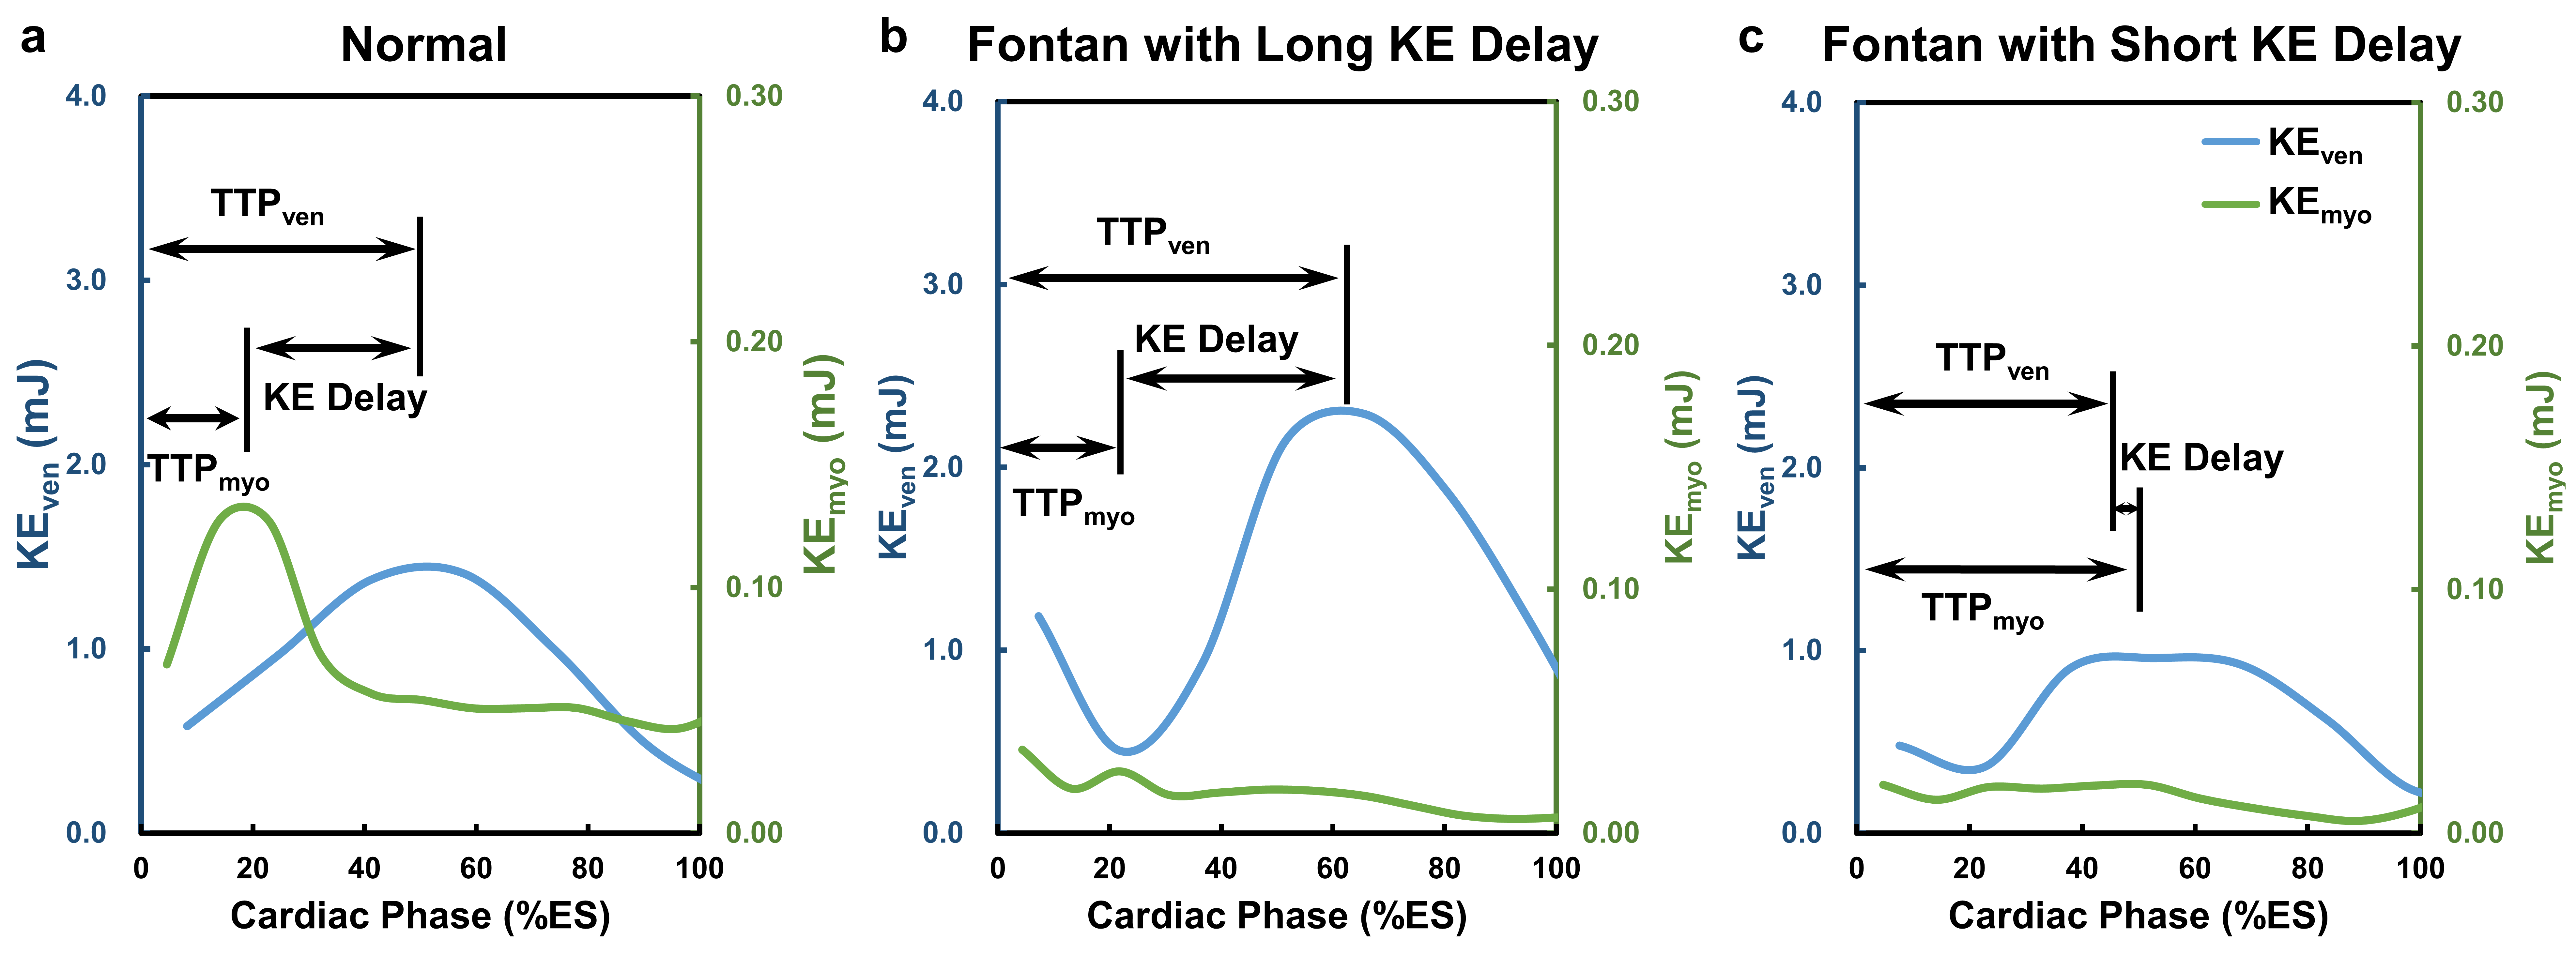
Figure 1.
The KE delay was defined as the time between peak myocardial KE (KEmyo)
and peak intraventricular KE (KEven) during systole. The time
courses of intraventricular KE and myocardial KE of a normal subject (a), a Fontan
patient with normal KE delay (b), and a Fontan patient with short KE delay (c)
during systole.
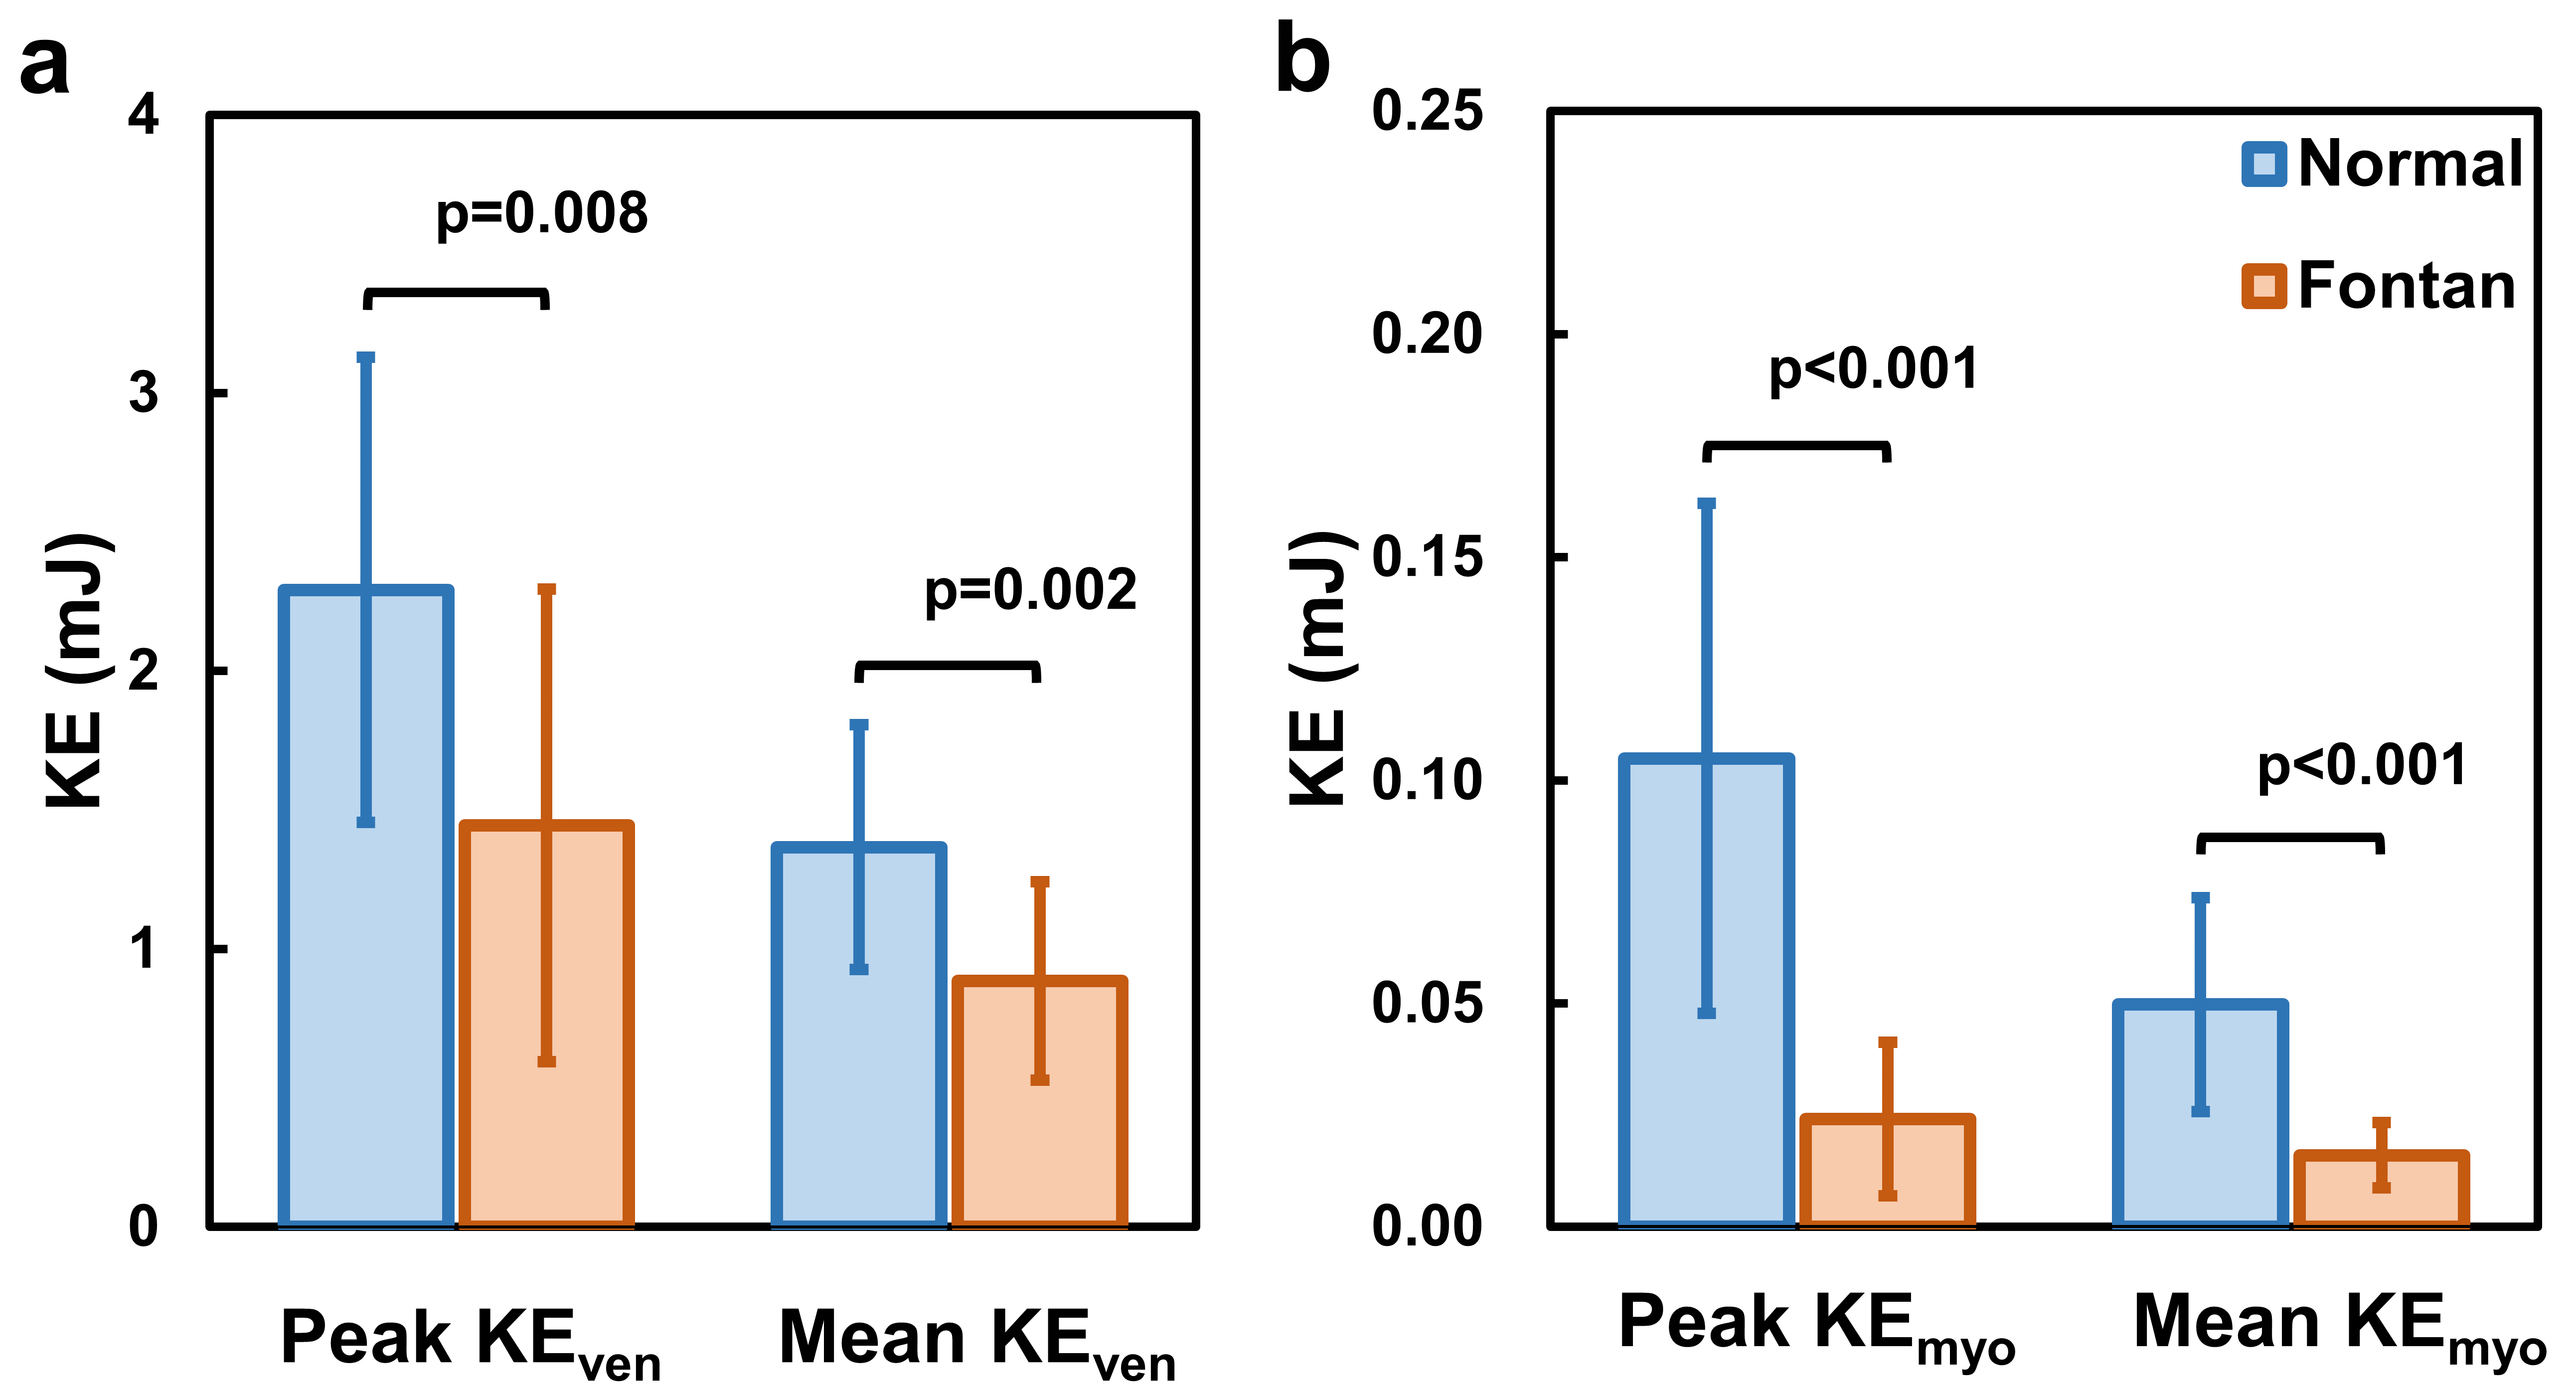
Figure 2.
(a) Peak and mean systolic intraventricular KE, (b) peak and mean systolic
myocardial KE. Significant differences between two groups were found in both
peak and mean KE of myocardium and intraventricle.
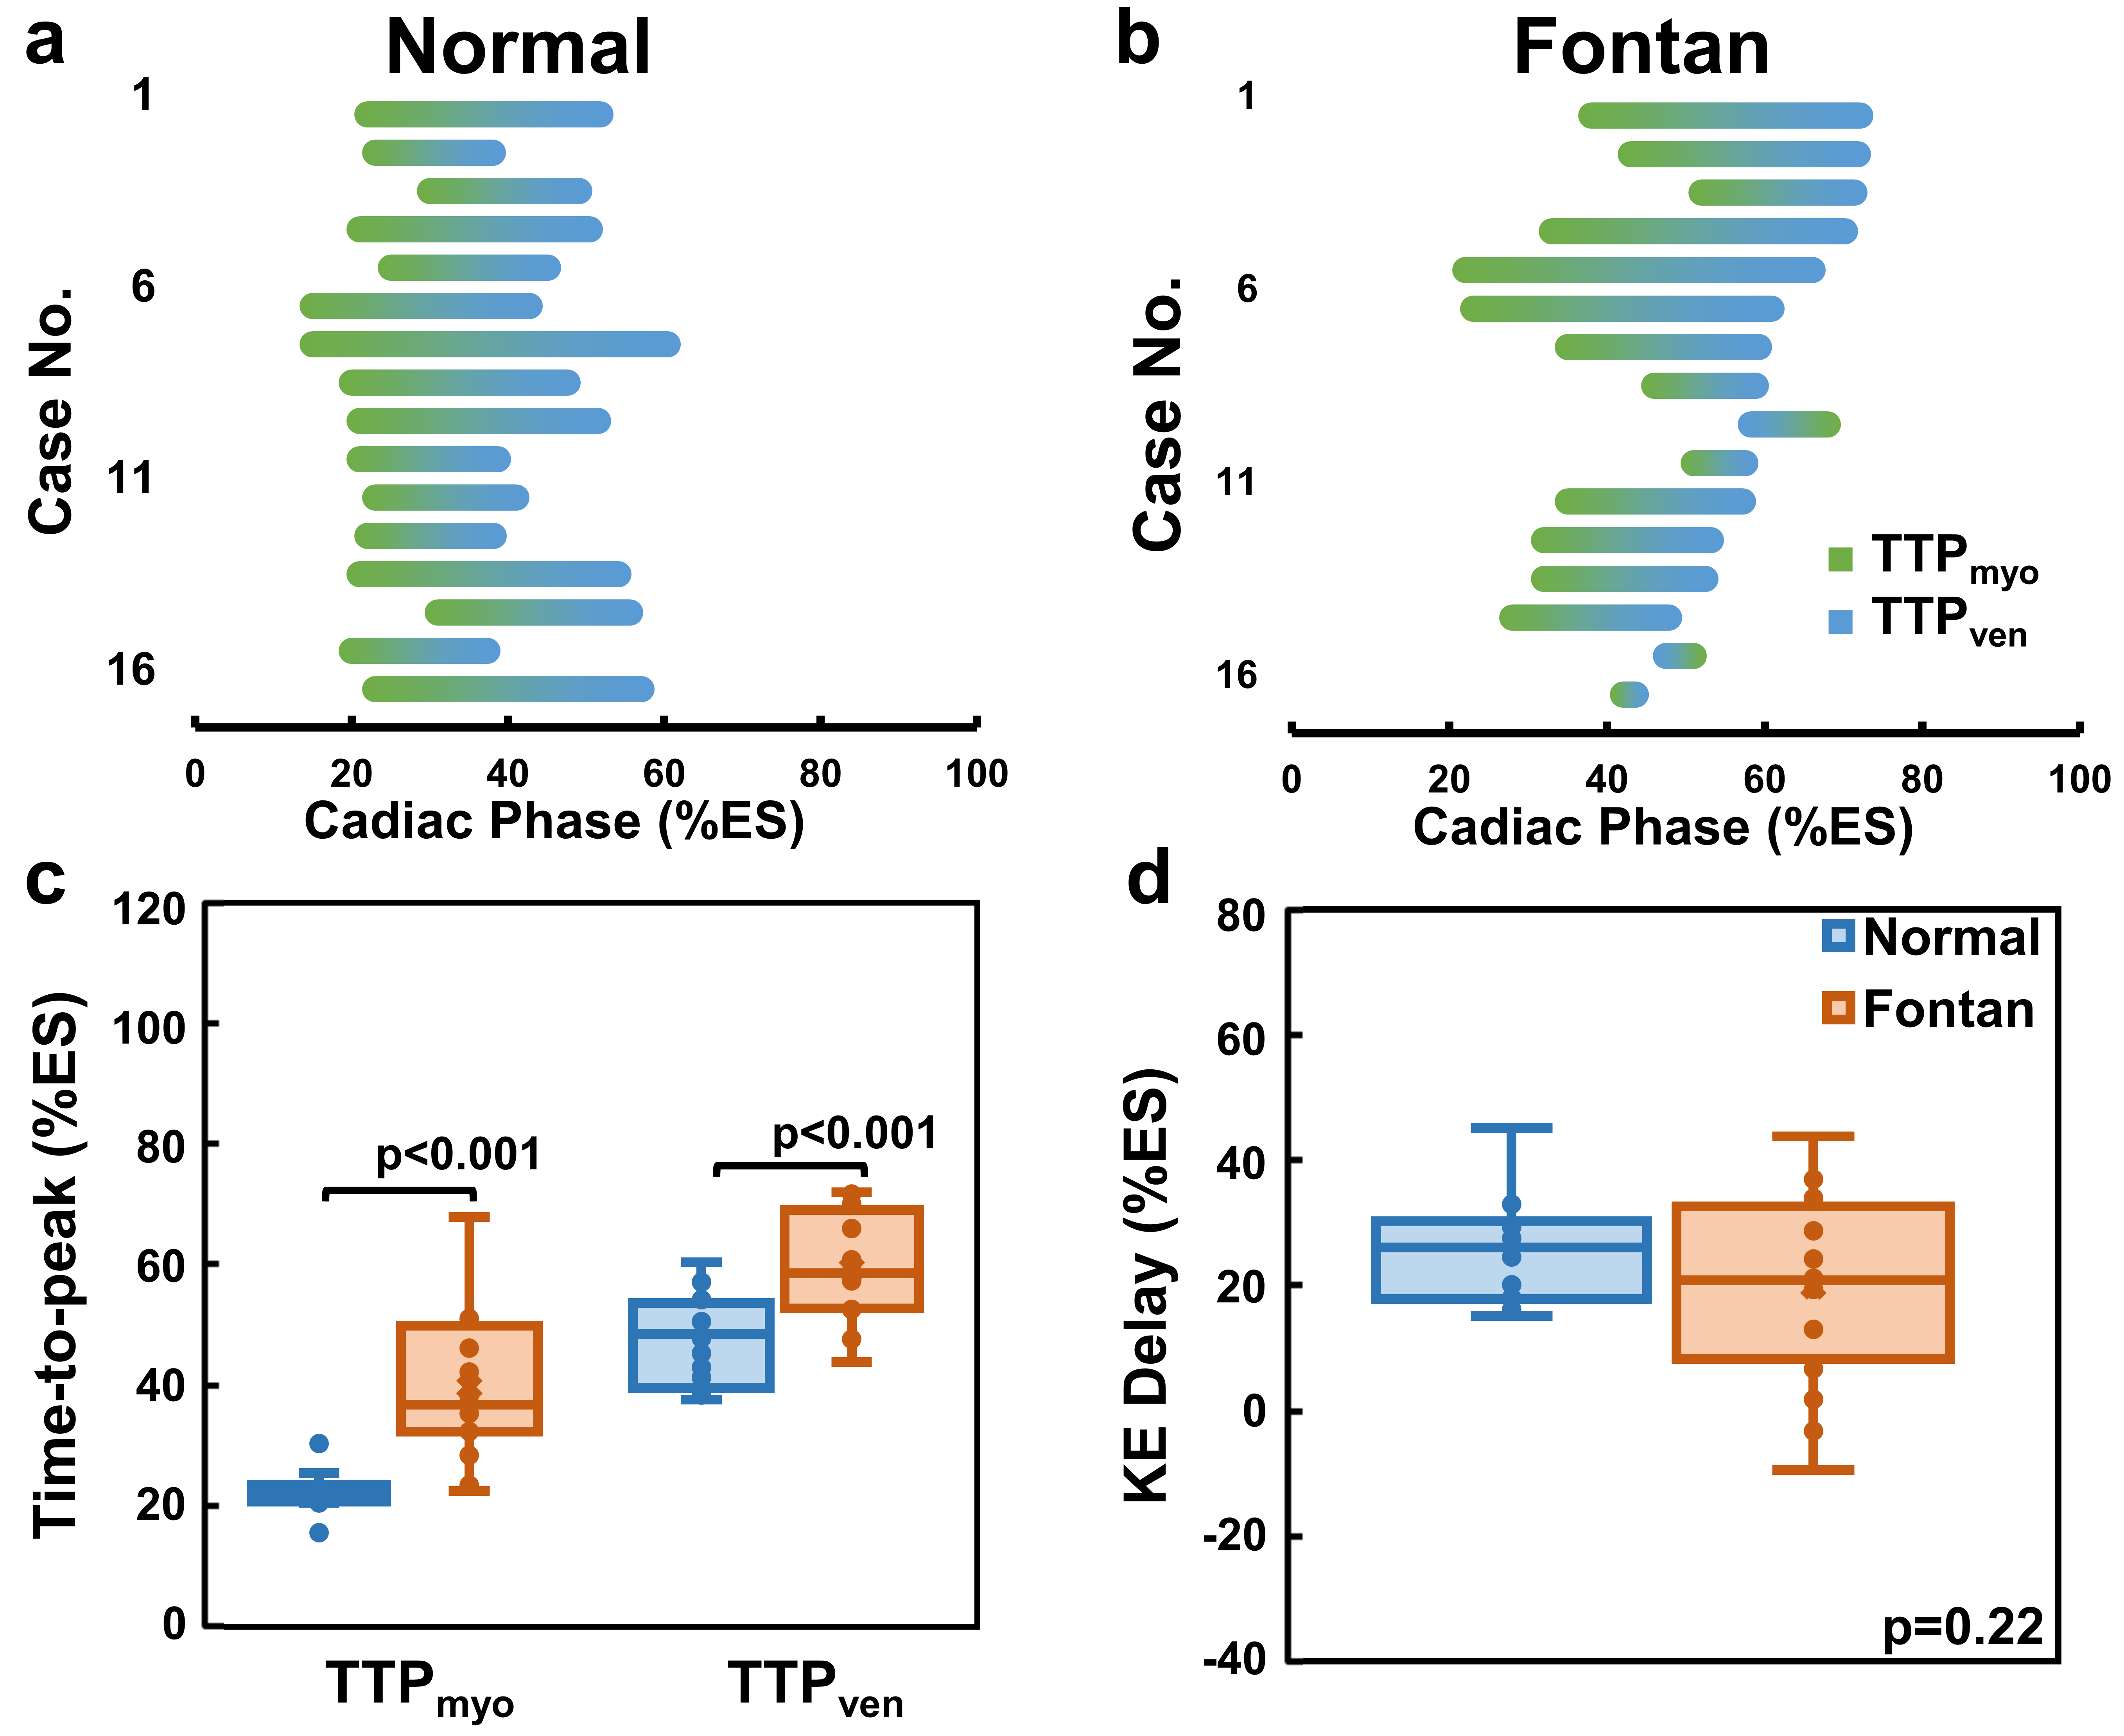
Figure 3. The KE delay
distribution between the TTPmyo(green) and TTPven (blue)
in normal group (a) and Fontan group (b). Compared to normal group, the Fontan
group presented more diverse KE delay distribution. Group comparison were
showed in (c) TTPmyo and TTPven, and (d) KE delay.
Significant differences between two groups were found beside KE delay.
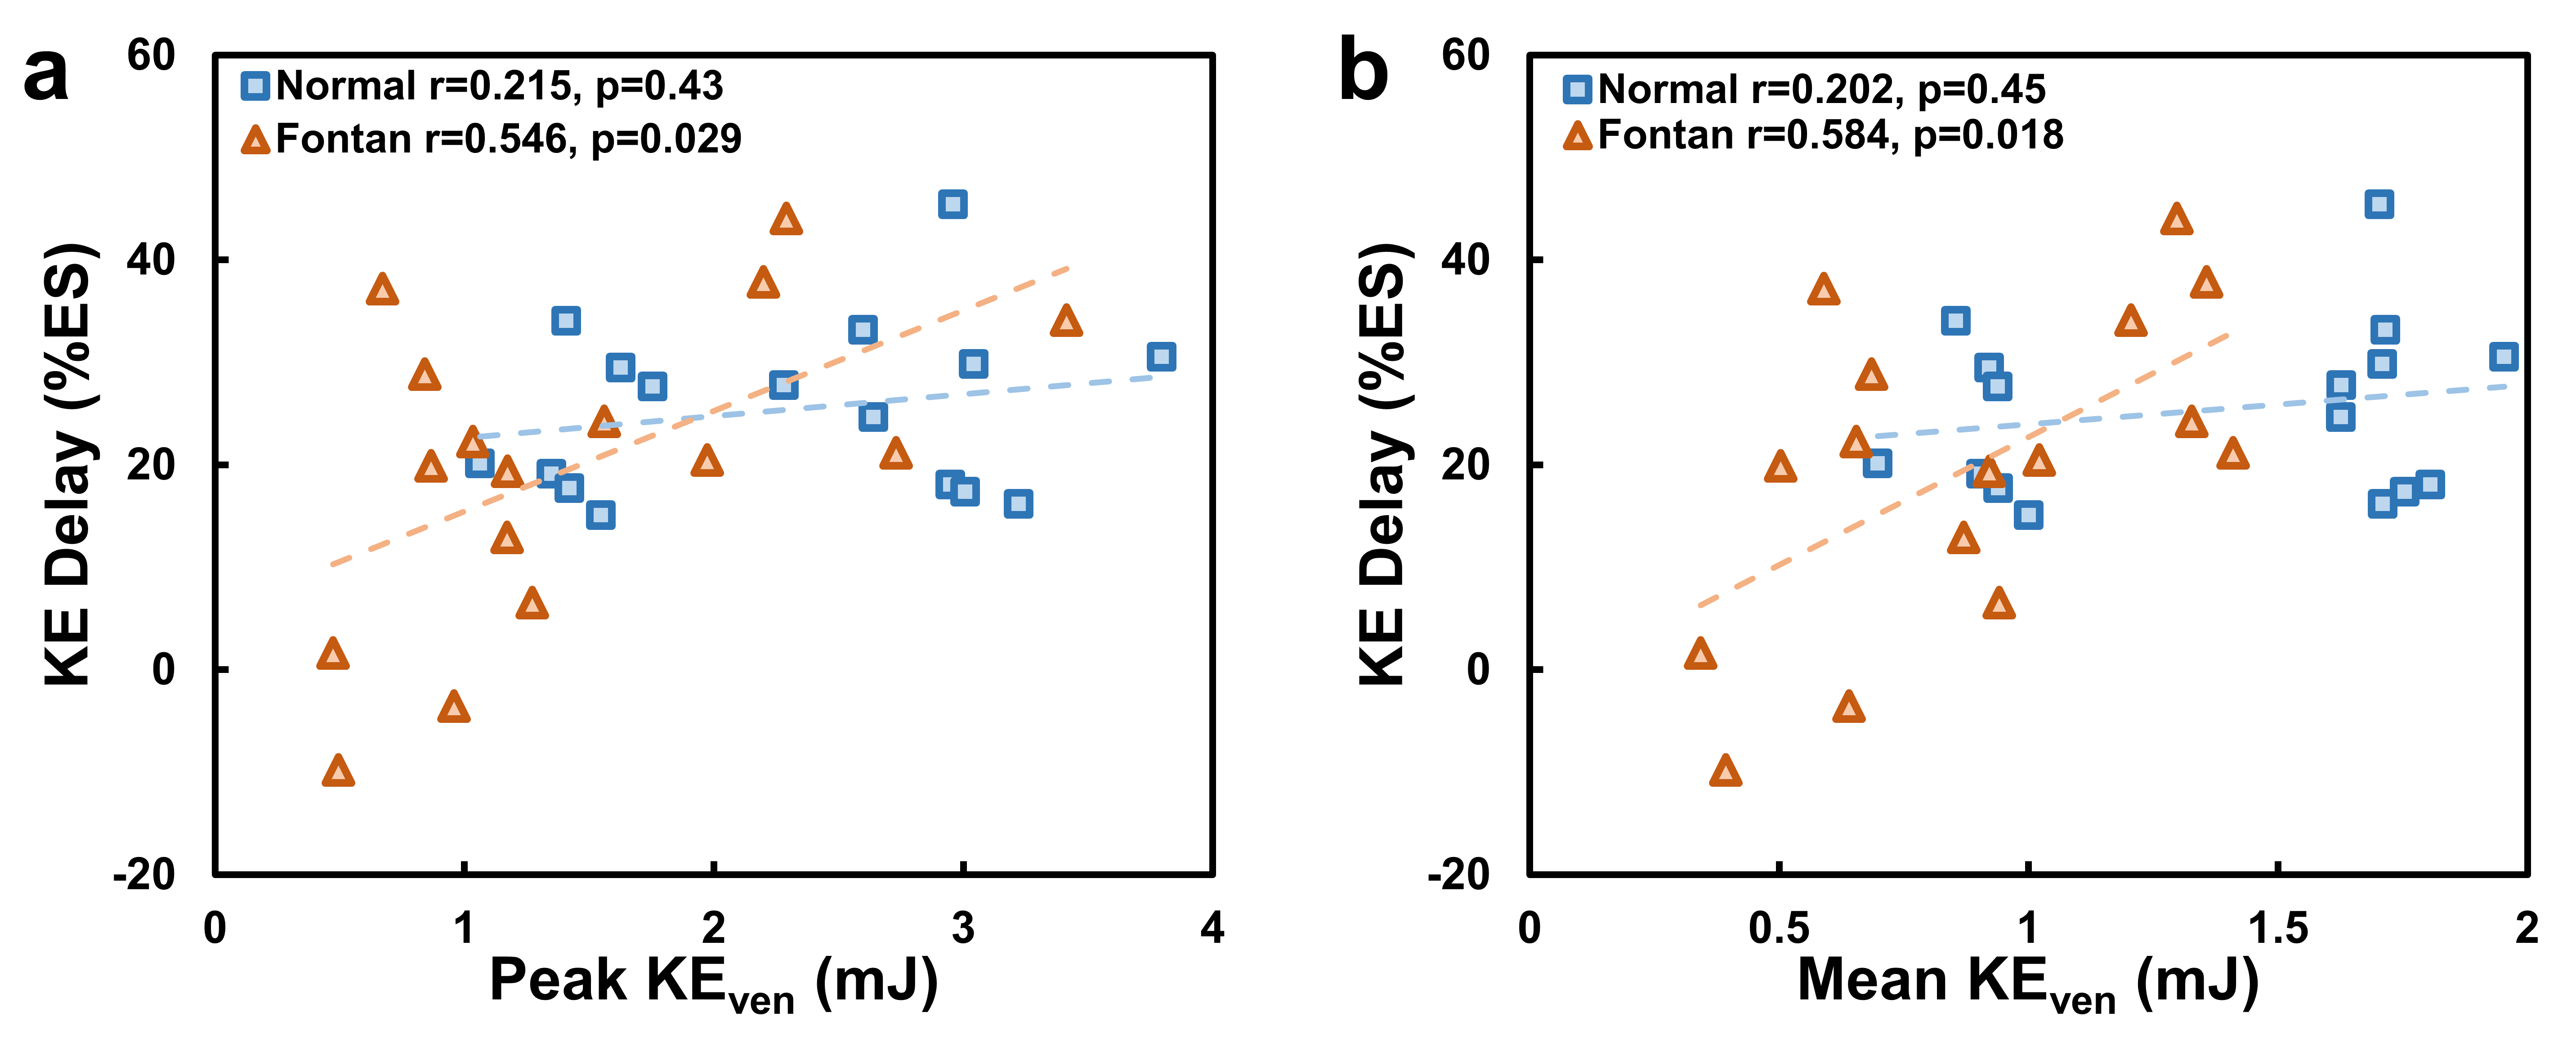
Figure 4.
The
KE delay significantly correlated to peak systolic intraventricular KE (a) and
mean systolic intraventricular KE (b) only in the Fontan group.