2165
Comparing intradialytic effects of standard vs cooled haemodialysis on cerebral blood flow and cardiac function using MRI1Sir Peter Mansfield Imaging Centre, University of Nottingham, Nottingham, United Kingdom, 2Centre for Kidney Research and Innovation, University of Nottingham, Derby, United Kingdom, 3Renal Unit, University Hospitals of Derby and Burton NHS Foundation Trust, Derby, United Kingdom, 4Fresenius Medical Care, Bad Homburg, Germany
Synopsis
12 patients received standard (SHD) and cooled (CHD) haemodialysis in a randomized cross-over study. Participants underwent serial cardiac and brain multiparametric MRI before, during and after dialysis. Cerebral blood flow velocities fell significantly during dialysis (carotid artery -19±2%, p<0.001; basilar artery -16±3%, p=0.004). Cardiac index and stroke volume index fell significantly during dialysis (-29±2% and -32±2%, both p<0.001). After two weeks of CHD, pre-dialysis left ventricle (LV) myocardial T1 and wall mass (WM) were lower compared to SHD (T1: 1266(37)ms vs. 1311±18ms, p=0.02; LV WM: 128±12g vs. 137±12g, p=0.003), indicating reduced myocardial tissue oedema with CHD.
Introduction
Ischemic end-organ damage during haemodialysis (HD) is a significant problem that may be ameliorated by intradialytic cooling.1,2 We performed a randomized trial to compare acute hemodynamic effects of standard HD (SHD) and cooled HD (CHD), using intradialytic magnetic resonance imaging (MRI) to provide concurrent assessments of cerebral blood flow and cardiac function.Methods
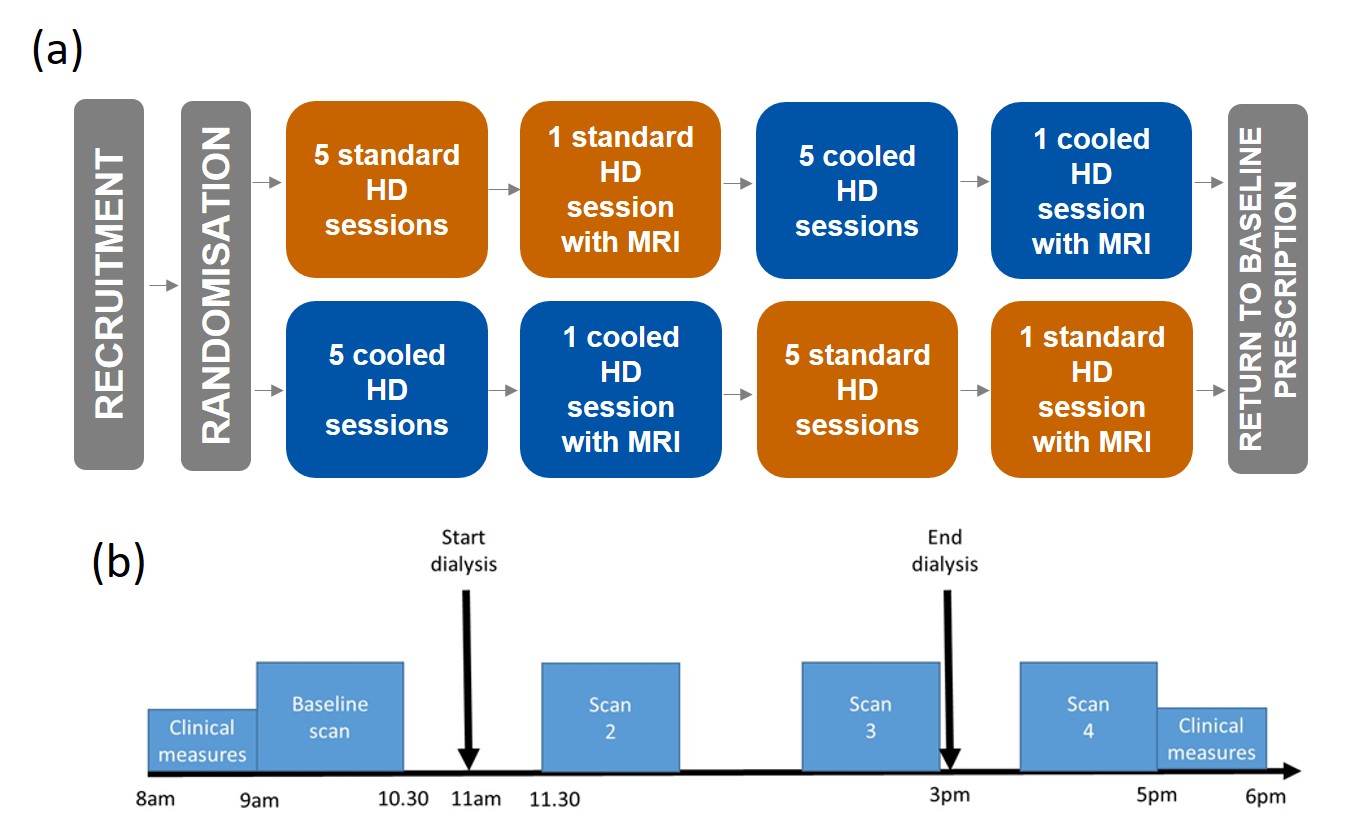
12 prevalent HD patients were randomly allocated to receive 4 hours of SHD (dialysate temperature 37⁰C) or CHD (programmed cooling to 0.5⁰C below body temperature, using Fresenius Blood Temperature Management, BTM®). All other HD prescription and operating conditions remained constant. Participants underwent the initial modality for two weeks before undergoing serial cardiac and brain multiparametric MRI (Phillips 3T Ingenia) before, during (30 min and 180 min) and 30 min after dialysis (Fig. 1). Cognitive function was assessed before and after dialysis using a Montreal Cognitive Assessment (MoCA) and Trail Making Test (TMT): Parts A and B. Participants then crossed to the other modality and the study protocol was repeated.The MRI protocol included:
Short axis cine images acquired through the left ventricle (LV) using a multi-slice TFE sequence with 30 phases (12 slices, 2x2x10 mm3 voxel, TR/TE = 3.9/1.94 ms, FA 60⁰, 4 breath-holds).
Native LV myocardial T1 measured using a MOLLI 5(3)3 acquisition scheme (3 slices, FA 20⁰, SENSE 2.5, TR/TE 2.3/1.03 ms, 3 breath-holds).3
Phase contrast (PC) MRI data collected for the internal carotid arteries and basilar artery.4 A single slice TFE sequence, with the imaging slice perpendicular to each vessel was used to collect 30 phases across the cardiac cycle. (TR/TE = 9.1/5.5 ms, VENC = 90 cm/s, FA 10⁰, NEX 1, recon. voxel 0.59x0.59x5 mm3). Scan time ~40 seconds.
Data Analysis
Short axis cine: Intellispace LV analysis software (Philips Medical Systems) was used to draw epi- and endo-cardial wall contours over the LV to calculate cardiac output (L/min), stroke volume (mL), LV wall mass (g) (corrected for body surface area (BSA) (m2)) and ejection fraction (EF) (%). To assess diastolic dysfunction, the derivative of the LV blood volume curve was computed (Matlab) to provide a curve with 2 peaks corresponding to the early and late filling phases. For each peak, the peak filling rate (ml/s), time to peak (ms), and filling volume (ml) were computed, as well as the ratio of early to late filling volume.5
MOLLI: A three parameter fit was performed (Matlab) to provide a LV myocardial T1 map.
PC-MRI: Viewforum Q-flow software (Philips Medical Systems) was used to draw a region of interest (ROI) over the vessel, from which to estimate vessel area, mean velocity and flux of blood flow (ml/s) over the cardiac cycle, across the vessel.
Statistical Analysis
GraphPad Prism 8.0.1 was used, with a significance level of p<0.05. Data were tested for normality with a Shapiro-Wilk test. Normal data are expressed as mean±std. dev and non-normal data as median (interquartile range). Pre-dialysis comparisons were made with a paired test (t-test or Wilcoxon test). Effect of time and treatment were assessed with a Mixed Effects model. Correlations were assessed with either a Pearson or Spearman test.
Results
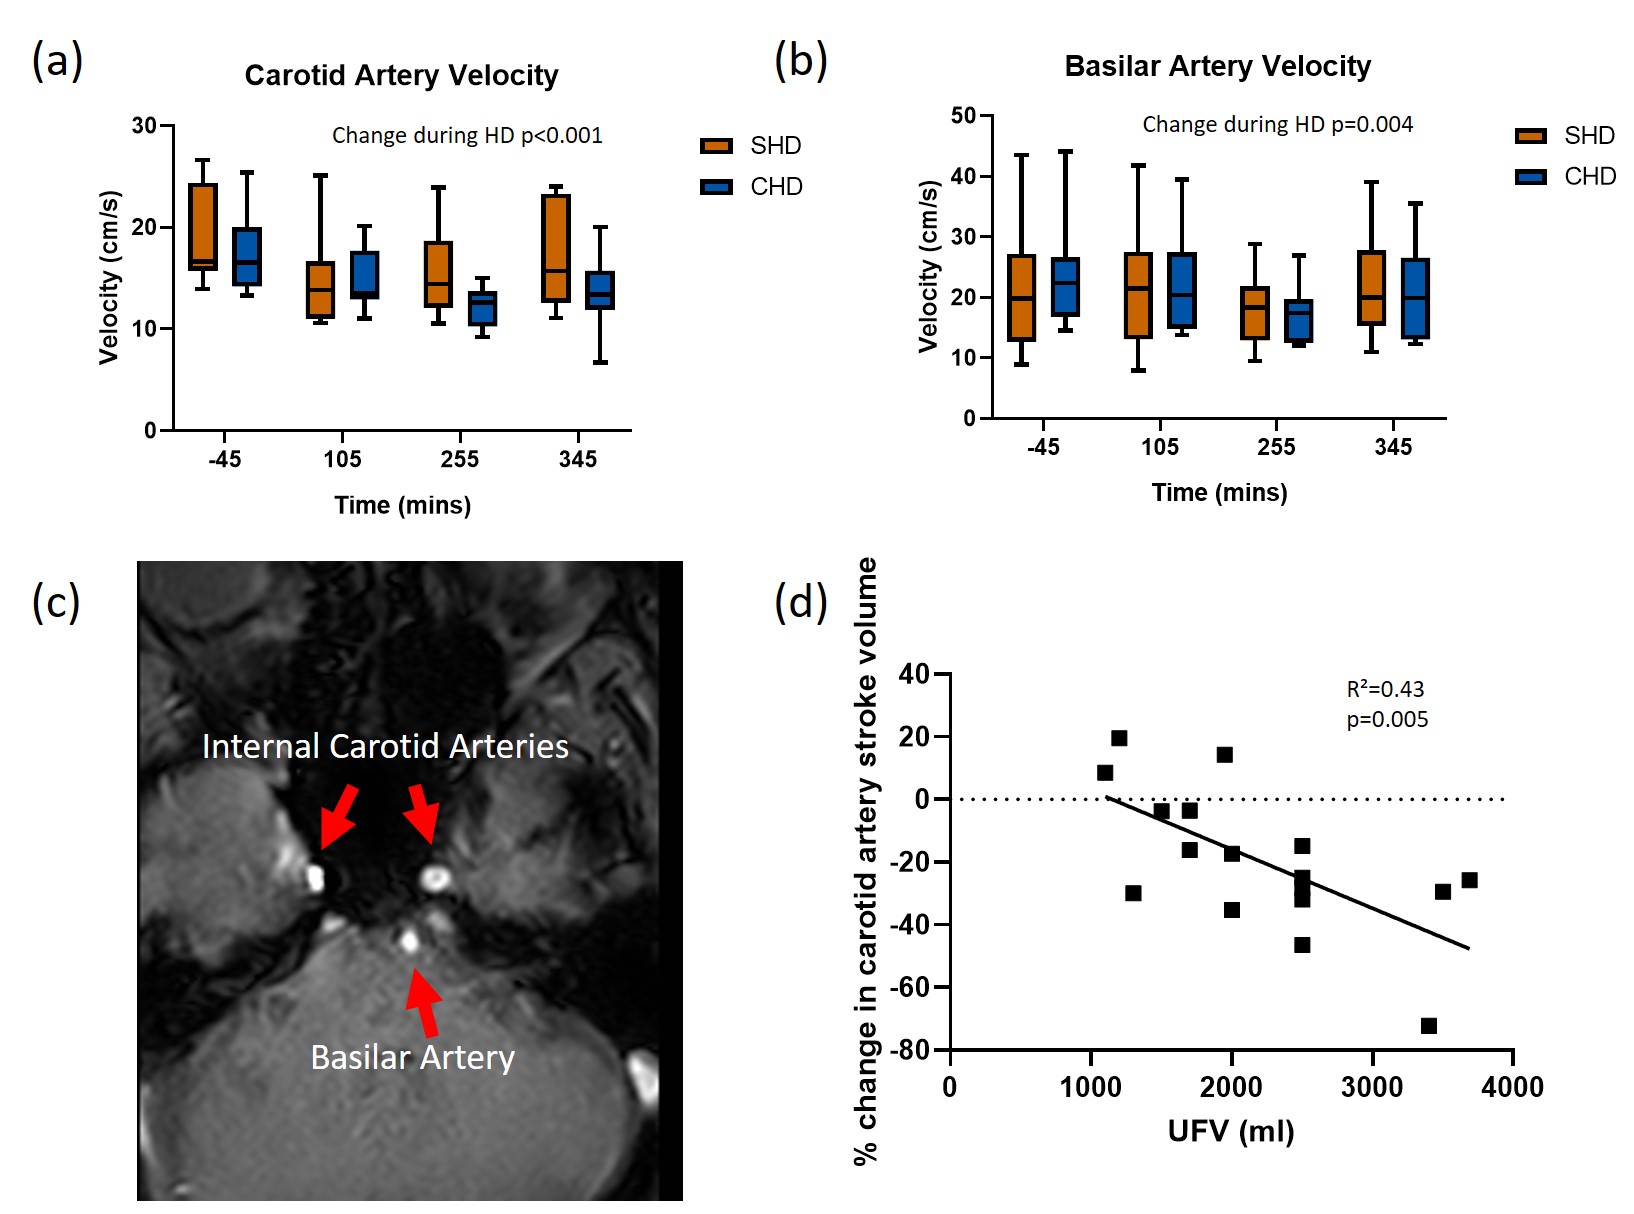
The median age of participants was 60(25) years, 10M/2F, three had diabetes and dialysis vintage was 19 (52) months. Participants were significantly cooled during CHD (CHD -0.40±0.31⁰C vs SHD 0.28±0.24⁰C; p=0.02). Ultrafiltration rate was 7.5±2.6 ml/kg/hr in CHD vs 6.9±2.7 ml/kg/hr in SHD (p=0.3). Ultrafiltration volume was 2300±240 ml in CHD vs 2120±230 ml in SHD (p=0.3). Blood pressure and pulse rate did not differ between SHD and CHD. No significant differences were seen in pre- and post-dialysis bioimpedance between SHD and CHD. No differences were seen in the TMTs or MoCA between SHD and CHD or pre- and post-dialysis.Figure 2c shows example PC-MRI through the internal carotid and basilar arteries. Cerebral blood flow velocities fell significantly during dialysis and reached nadir in the fourth hour (carotid artery -19±2%, p<0.001, Fig. 2a; basilar artery -16±3%, p=0.004, Fig. 2b). Reduction in carotid blood flow was associated with higher ultrafiltration volumes (R²=0.43, p=0.005, Fig. 2d). There were no significant differences between SHD and CHD.
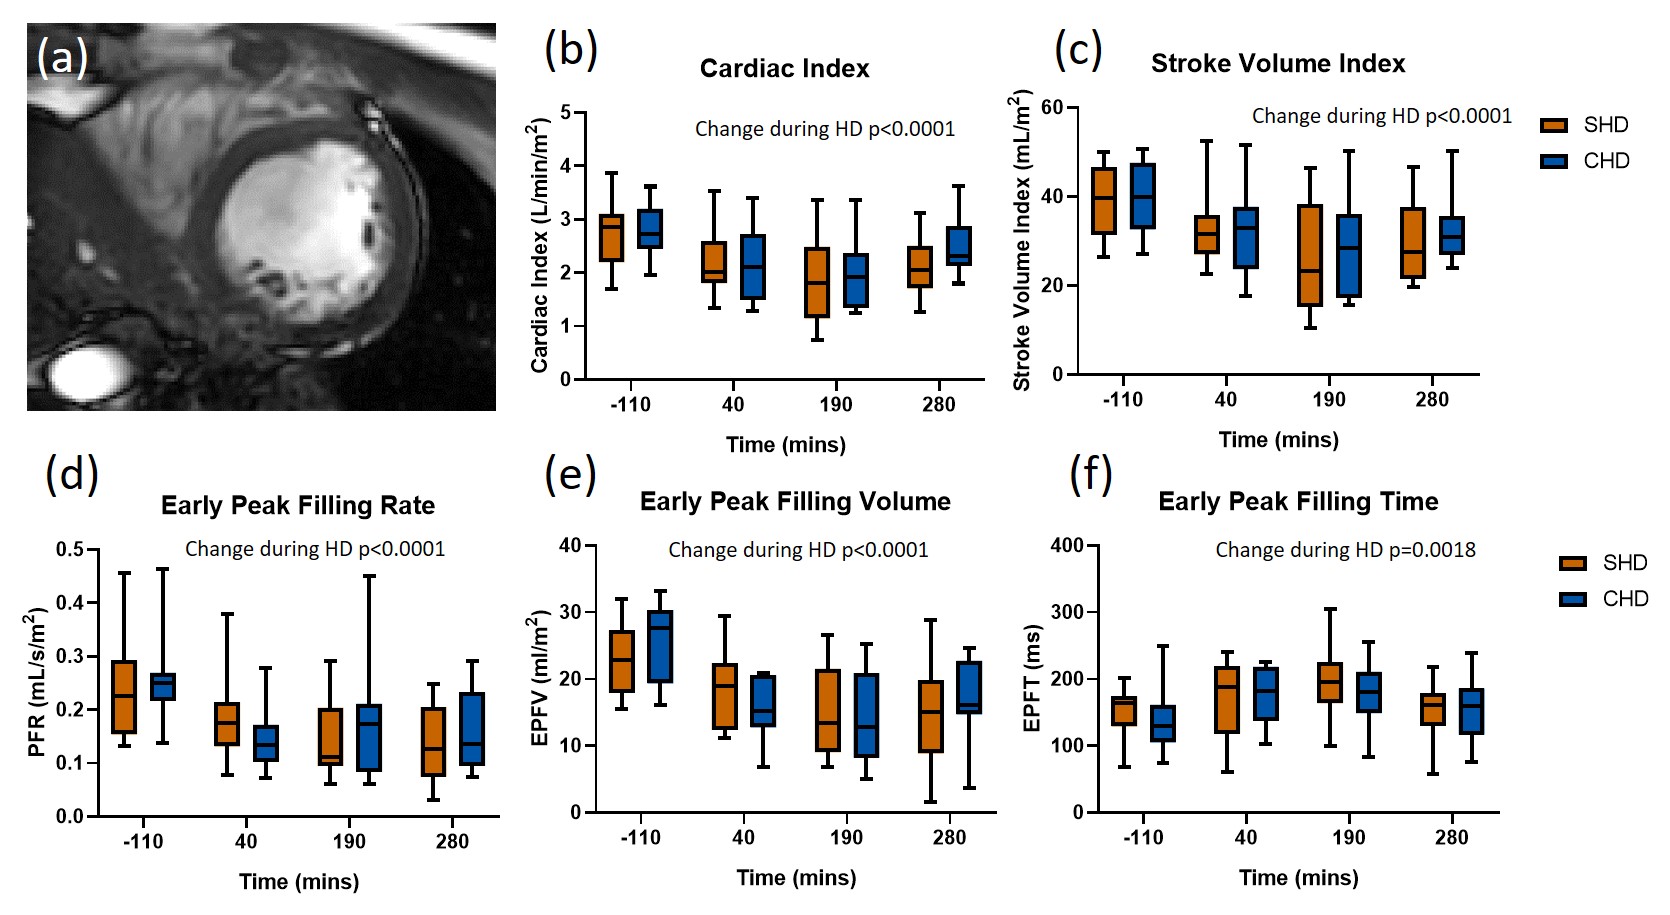
Cardiac index (CI) and stroke volume index (SVI) as estimated from the short axis image (Fig. 3a) fell significantly during dialysis (-29±2% and -32±2%, both p<0.001, Fig. 3b-c). Reductions in LV early peak filling rate (-37±5%, p<0.0001, Fig. 3d) and volume (-38±5%, p<0.0001, Fig. 3e) occurred during dialysis, with an increase in early peak filling time (39±7%, p=0.0018, Fig. 3f). There were no differences between SHD and CHD.
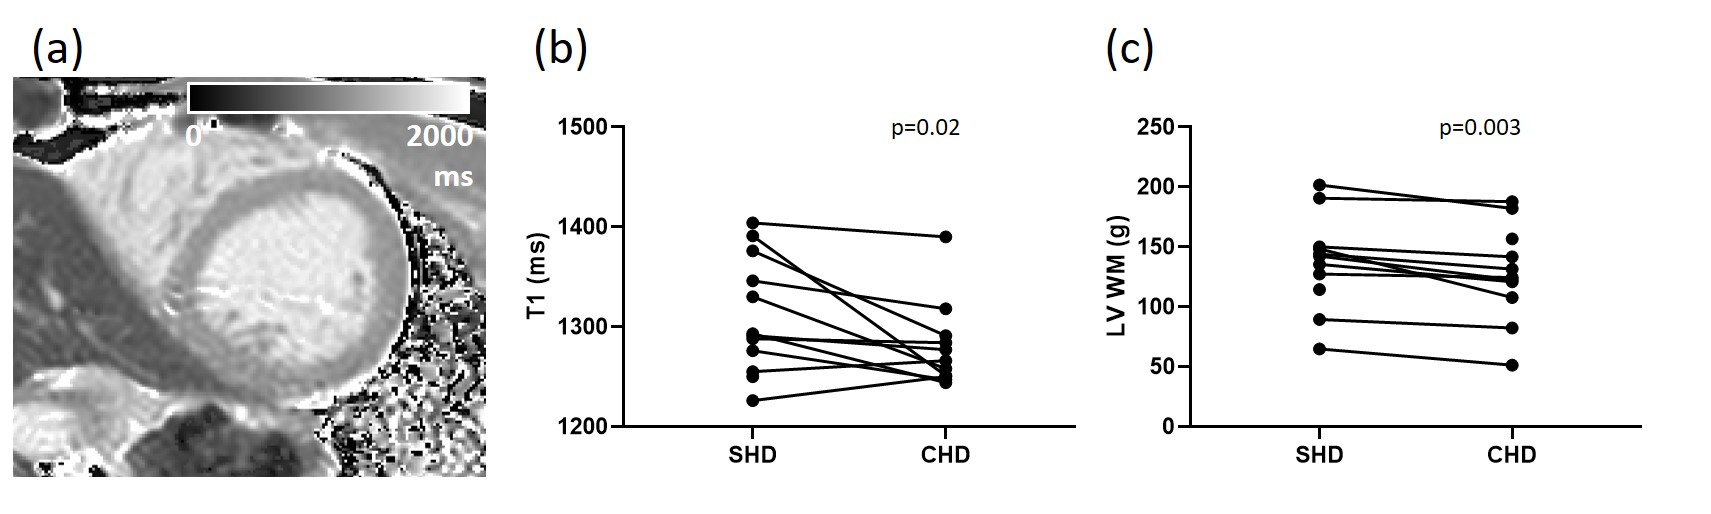
After two weeks of CHD, pre-dialysis myocardial T1 (Fig. 4a) was lower as compared to SHD (1266±37 ms vs. 1311±18 ms, p=0.02, Fig. 4b). Pre-dialysis LV wall mass was also lower with CHD as compared to SHD (128±12 g vs. 137±12 g, p=0.003, Fig. 4c).
Discussion
HD and fluid volume reduction adversely affects cardiac function, carotid and basilar artery blood flow, with acute changes being similar during SHD and CHD. However, lower myocardial T1 and left ventricular wall mass may indicate reduced myocardial tissue oedema with CHD, but not detected with bioimpedance.Acknowledgements
This study was funded by Fresenius Medical Care, Germany.References
1. Selby, N. M., Burton, J. O., Chesterton, L. J. & McIntyre, C. W. Dialysis-induced regional left ventricular dysfunction is ameliorated by cooling the dialysate. Clin. J. Am. Soc. Nephrol. 1, 1216–1225 (2006).
2. McIntyre, C. W. et al. Hemodialysis-induced cardiac dysfunction is associated with an acute reduction in global and segmental myocardial blood flow. Clin. J. Am. Soc. Nephrol. 3, 19–26 (2008).
3. Messroghli, D. R. et al. Modified Look-Locker inversion recovery (MOLLI) for high-resolutionT1 mapping of the heart. Magn. Reson. Med. 52, 141–146 (2004).
4. Debatin, J. F. MR quantification of flow in abdominal vessels. Abdom. Imaging 23, 485–95 (1998).
5. Caudron, J., Fares, J., Bauer, F. & Dacher, J.-N. Evaluation of Left Ventricular Diastolic Function with Cardiac MR Imaging. RadioGraphics 31, 239–259 (2011).
Figures