2162
Evaluation of Myocardial Strain in Patients With Early Hypertrophic Cardiomyopathy and Hypertensive Heart Disease Using CMR-FT1Shanxi Cardiovascular Hospital, TaiYuan, China, 2GE Healthcare, MR Research China, BeiJing, China
Synopsis
This work assessed the application of cardiovascular magnetic resonance feature tracking (CMR-FT) technique in evaluation of myocardium deformation in patients with early hypertrophic cardiomyopathy and hypertensive heart disease. From the results we can see that the CMR-derived feature tracking technology could detect impairment of left ventricula myocardial deformation in patients with early hypertrophic cardiomyopathy and early hypertensive heart disease, even in patients with normal LVEF.
Introduction
Cardiac MRI is frequently used in the diagnosis of hypertrophic cardiomyopathy and hypertensive heart disease[1] . Cardiovascular magnetic resonance feature tracking is a novel method for the analysis of myocardial strain at the myocardial borders[2]. The purpose of this work is to assessed the application of cardiovascular magnetic resonance feature tracking (CMR-FT) in the evaluation of myocardium deformation in patients with early hypertrophic cardiomyopathy and hypertensive heart disease.Methods
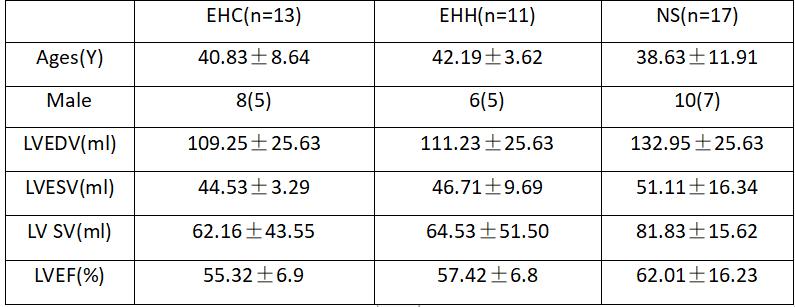
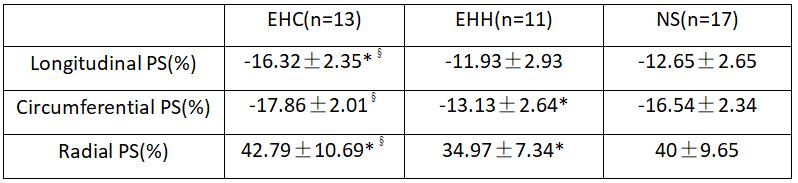
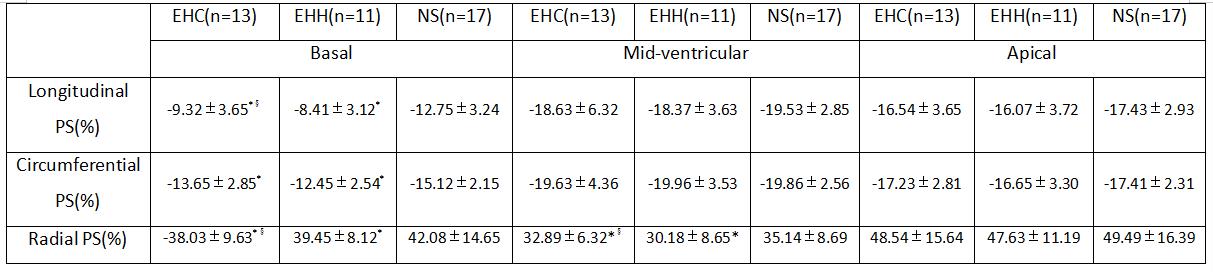
CMR scans was performed on 1.5 T MR scanner (General Electric Company, Signa HDxt) in 13 patients with early hypertrophic cardiomyopathy, 11 patients with early hypertensive heart disease, and 17 controls. Conventional short-axis, vertical long-axis, and 4-chamber steady-state free precession images were used to generate radial, circumferential, and longitudinal myocardial strain maps using feature tracking software (CVI 42). The radial, circumferential, and longitudinal strain values of the global and regional peaks were computed. Differences between groups were assessed by using chi-square test for categorical variables and by using student’s t test and Mann–Whitney U test for continuous variables according to the results of normality tests. P value < 0.05 was considered statistically significant.Results and discussion
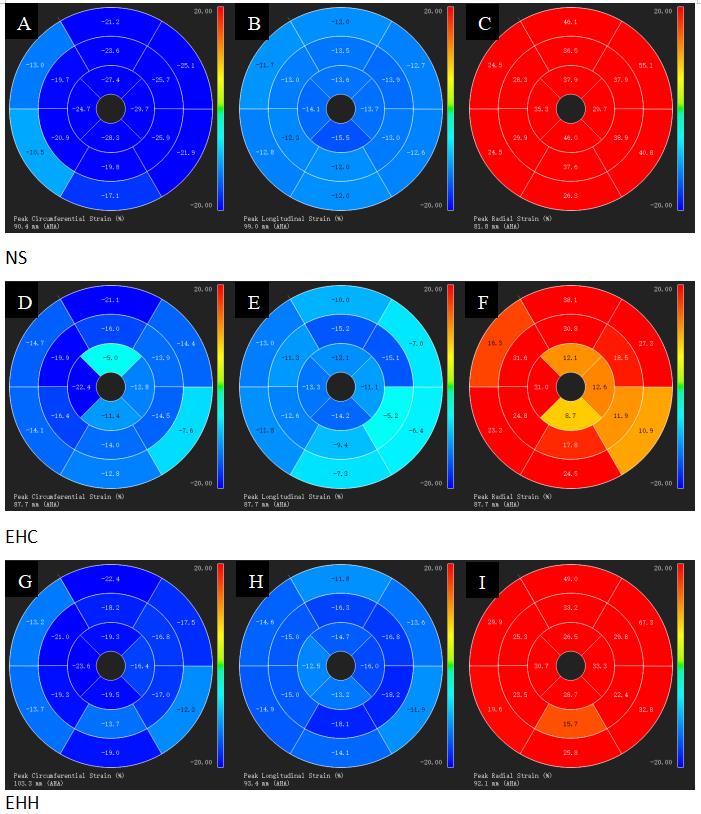
Baseline values of patients with early hypertrophic cardiomyopathy, patients with early hypertensive heart disease, and the normal healthy were exhibited in Table 1. Values of left ventricular deformation parameters obtained using feature tracking for different values of all study groups were shown in Table 2 and 3. From these tables ,we can see that there was significant difference in global longitudinal PS and radial PS between EHC group and EHH group. Also, there was significant difference in the base and part mid-ventricular peak radial strain values between these two groups. In addition, different colors can also reflect these differences in figure 1. For the bulls eye pattern of peak circumferential strain and peak longitudinal strain, the deeper the blue color, the larger the negative value is, while for the bulls eye pattern of peak radial strain, the darker the red, the larger the positive value. The color of each segment in the normal control group was similar, indicating that the myocardium of this segment was in good motion. In contrast, in patients with early hypertrophic cardiomyopathy and early hypertensive heart disease, the myocardial strain was significantly reduced, showing in lighter colors in the base and part mid ventricular level with relatively preserved strain at the apex (Fig 1 D-I). These differences are mainly concentrated in the base and part mid ventricular level.Conlusion
The CMR-derived feature tracking technology could detect impairment of LV myocardial deformation in patients with early hypertrophic cardiomyopathy and early hypertensive heart disease[3],even in patients with normal LVEF. In addition, the abnormal myocardial deformation parameters, especially global and the base and part mid-ventricular peak radial strain values, were correlated with impaired LV myocardial microvascular dysfunction. As a valuable supplement to cardiac MRI, feature tracking strain analysis can play a valuable role in the diagnosis and prognosis of early hypertrophic cardiomyopathy and early hypertensive heart disease.Acknowledgements
No acknowledgement found.References
[1] Moore CC,McVeigh ER,Zerhouni EA.Quantitative tagged magnetic resonance imaging of the normal human left ventricle.Top Magn Reson Imaging.2000;11(6):359-71.
[2] Burris NS,Lima APS,Hope MD,Ordovas KG.Feature Tracking Cardiac MRI Reveals Abnormalities in Ventricular Function in Patients With Bicuspid Aortic Valve and Preserved Ejection Fraction.Tomography.2018 Mar;4(1):26-32.
[3] Lapinskas T,Bučius P,Urbonaitė L,Stabinskaitė A,Valuckienė Ž,Jankauskaitė L, Benetis R,Žaliūnas R.Left atrial mechanics in patients with acute STEMI and secondary mitral regurgitation:A prospective pilot CMR feature tracking study.Medicina (Kaunas).2017;53(1):11-18.
Figures