2161
An In-Vivo Assessment of Velocity Sensitivity for TOF MRA and SNAP MRA
Anders Gould1, Zhensen Chen1, Zechen Zhou2, Niranjan Balu1, Thomas Hatsukami3, and Chun Yuan1
1Vascular Imaging Lab and Bio-Molecular Imaging Center, Radiology, University of Washington, Seattle, WA, United States, 2Philips Research North America, Cambridge, MA, United States, 3Surgery, University of Washington, Seattle, WA, United States
1Vascular Imaging Lab and Bio-Molecular Imaging Center, Radiology, University of Washington, Seattle, WA, United States, 2Philips Research North America, Cambridge, MA, United States, 3Surgery, University of Washington, Seattle, WA, United States
Synopsis
TOF and SNAP are both useful angiographic imaging sequences. In this study, we compared signal patterns of intracranial arteries depicted by the two techniques and explored their relationship with blood flow velocity. Twenty-four subjects with carotid atherosclerosis were imaged. The number of distal intracranial branches were scored based on the MRA images. SNAP showed more variation across subjects than TOF. TOF MRA score seems more strongly correlated with carotid velocity. This suggests TOF MRA may be more robust, while SNAP MRA may be more sensitive to flow change, although the underlying mechanism needs further clarification in the future.
Introduction
Time-of-flight (TOF) has been extensively used in intracranial magnetic resonance angiography (MRA) imaging. TOF utilizes rapid radiofrequency excitation pulses that suppress the signal from background tissues. Any incoming blood to the imaging slice will undergo fewer excitation pulses and results in a high signal intensity.1Simultaneous non-contrast angiography and intraplaque hemorrhage (SNAP) imaging is a recently developed technique that takes advantage of the short T1 of IPH components, which results in hyperintensities on T1-weighted images. The SNAP sequence is able to generate images with negative signal corresponding to MRA and a strong positive signal corresponding to IPH. The SNAP sequence is able to detect luminal stenosis and IPH in a single scan.2
Multiple studies have compared the performance of SNAP to TOF MRA with conflicting findings. For example, one study found that SNAP provided similar stenosis detection when compared to TOF. It also showed SNAP providing better small artery delineation than TOF.3 There have also been studies that utilized theoretical simulations to explain the role of velocity in determining the signal intensity profile for SNAP. One study mentioned that the contrast ratio for both SNAP and TOF increased as travel distance decreased and blood flow velocity increased. It also mentioned that when blood velocity is too low, or when the travel distance is too short for SNAP, TOF is still able to generate effective MRA contrast.4 In addition, another study used theoretical simulations to conclude that the SNAP signal intensity profile is stable within a velocity range of $$$ \frac{6.8cm}{TI} \le v \le \frac{28 cm}{TI} $$$.5
These studies offer a convincing theoretical framework to evaluate the performance of SNAP, but the blood flow velocity has been oversimplified (i.e. assumed constant) in the calculation. Therefore, an in-vivo validation of SNAP MRA against blood flow velocity is still needed. This study aims to assess flow velocity sensitivity in the performance of both TOF and SNAP MRA in intracranial vascular imaging.
Methods
24 patients with carotid atherosclerosis were imaged on a Philips Ingenia 3T MRI scanner with a 32-ch head coil. The University of Washington IRB approved the imaging protocol and informed consent was obtained from all patients. All patients were imaged with brain 3D TOF, 3D SNAP and 2D carotid Phase Contrast MRI. Imaging parameters for the TOF were: TR/TE 20/3.5 ms, flip angle 18°, voxel size 0.5×0.5×1 mm3, FOV 190×180×105 mm3, total acquisition time 6 min 37 sec; imaging parameters for SNAP were: TR/TE 10/5.6 ms, flip angle 11°/5°, voxel size 0.8×0.8×0.8 mm3, FOV 180×180×70 mm3, time interval between two consecutive IR pulses 2000 ms, inversion delay time 500 ms, total acquisition time 3 min 46 sec; image parameters for 2D PC were: single slice at extracranial carotid, oriented to be perpendicular to the two internal carotid arteries and two vertebral arteries, single phase, encoding velocity 100 cm/s in feet-head direction, flip angle 10°, voxel size 0.7×0.7×5 mm3, FOV 180×180 mm2, total acquisition time 30 sec. The TOF volume was cropped to match the FOV of SNAP. Then, transverse maximum intensity projection images and minimum projection images were generated for both TOF and SNAP data sets respectively. The SNAP projection images were inverted to have a similar appearance to TOF. The 48 images were manually ranked, in random order, by two reviewers together on a scale from 1 to 10. A score of “10” corresponded to the highest number of distal branches and a score of “1” corresponded to the lowest number of distal branches. 18 of the patients had the 2D phase contrast velocity measurement. These velocity values were then plotted against the branching scores. A correlation coefficient was calculated.Results
The branching score in TOF tends to show a higher correlation with internal carotid artery velocity than SNAP, though not all correlation tests significant (Figure 1). The standard deviation of the branching score for SNAP (2.39) is larger than TOF (1.46). The SNAP images showed a greater variation in the number of distal intracranial branches (Figure 2).Discussion and Conclusion
Our findings suggest that visibility of vessels on TOF MRA may have a simpler relation with flow velocity than SNAP and is more robust across subjects. The larger branching score variation and weaker correlation with carotid velocity for SNAP suggest that the in-vivo SNAP signal may have a more complicated relation with blood flow velocity, and velocity measurement at a single location (i.e. carotid in this study) cannot explain the overall variation of intracranial SNAP arterial signal. Note that since in this study the TOF and SNAP sequences used different spatial resolution, we did not compare their mean values of branching score. Future study, as being performed in our lab, that includes velocity measurement at multiple arterial locations and the travel distance of blood spins is needed, in order to unravel potential influential factors and the signal mechanism of in vivo intracranial SNAP arterial signal. In conclusion, our findings suggest that TOF may be preferred if a robust visualization of intracranial vessels is required. However, SNAP may be preferable if detection of flow alteration is of interest.Acknowledgements
This research is supported by the R01HL103609 grant from the National Institutes of Health.References
-
Hartung MP, Grist TM,
François CJ. Magnetic resonance angiography: current status and future
directions. J Cardiovasc Magn Reson. 2011;13(1):19.
doi:10.1186/1532-429X-13-19
-
Wang J, Börnert P,
Zhao H, et al. Simultaneous Non-contrast Angiography and intraPlaque hemorrhage
(SNAP) imaging for carotid atherosclerotic disease evaluation. Magn Reson
Med Off J Soc Magn Reson Med Soc Magn Reson Med. 2013;69(2):337-345.
doi:10.1002/mrm.24254
-
Wang J, Guan M,
Yamada K, et al. In Vivo Validation of Simultaneous Non-Contrast Angiography
and intraPlaque Hemorrhage (SNAP) Magnetic Resonance Angiography: An
Intracranial Artery Study. PLoS ONE. 2016;11(2).
doi:10.1371/journal.pone.0149130
-
Zhang Q, Chen Z, Chen
S, et al. Angiographic contrast mechanism comparison between Simultaneous
Non-contrast Angiography and intraPlaque hemorrhage (SNAP) sequence and Time of
Flight (TOF) sequence for intracranial artery. Magn Reson Imaging.
September 2019. doi:10.1016/j.mri.2019.09.001
-
Xiong Y, Zhang Z, He
L, et al. Intracranial simultaneous noncontrast angiography and intraplaque
hemorrhage (SNAP) MRA: Analyzation, optimization, and extension for dynamic
MRA. Magn Reson Med. 2019;82(5):1646-1659. doi:10.1002/mrm.27855
Figures
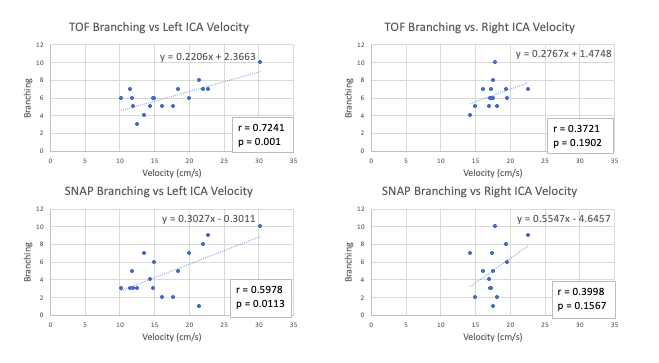
Figure 1. Graphs
of left and right internal carotid artery velocity plotted against ranking of
branching in both TOF and SNAP sequences. TOF branching shows smaller deviation
than SNAP across velocities. TOF branching seems to have a higher correlation
with carotid velocity.
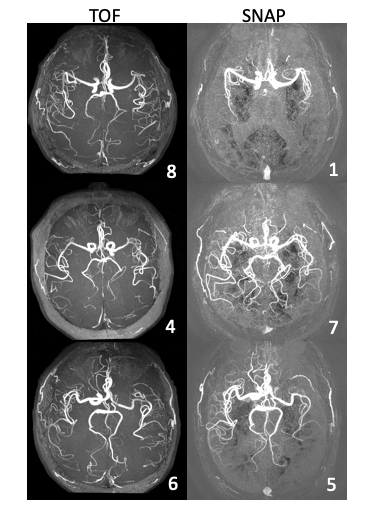
Figure 2. MRA
images of three subjects highlighting the robust performance of TOF
compared to SNAP MRA. The branching score is shown in the lower right corner of
each image. The SNAP images show more variation in their branching score, which
could be due to variation in flow velocity. The first subject (row 1) is a 65
year old male, the second subject (row 2) is a 77 year old female, the third subject
(row 3) is a 73 year old male.