2155
Optimisation of Poisson-disk Sampling Pattern for Highly Accelerated Femoral NCE-MRA1Department of Radiology, University of Cambridge, Cambridge, United Kingdom, 2Department of Radiology, Addenbrooke’s Hospital, Cambridge, United Kingdom
Synopsis
NCE-MRA techniques have a long acquisition time but can be accelerated by compressed sensing, parallel imaging and partial Fourier sampling using, for example, a Poisson-disk sampling pattern. In this study, we optimised the parameters in sampling pattern design with different acceleration factors for the 3D accelerated femoral fresh-blood-imaging sequence. The NCE-MRA data were reconstructed using weighted subtraction in k-space combined with phase correction. In a comparison using retrospective acceleration by subsampling of a full dataset, the optimised patterns outperformed the non-optimised patterns.
Introduction
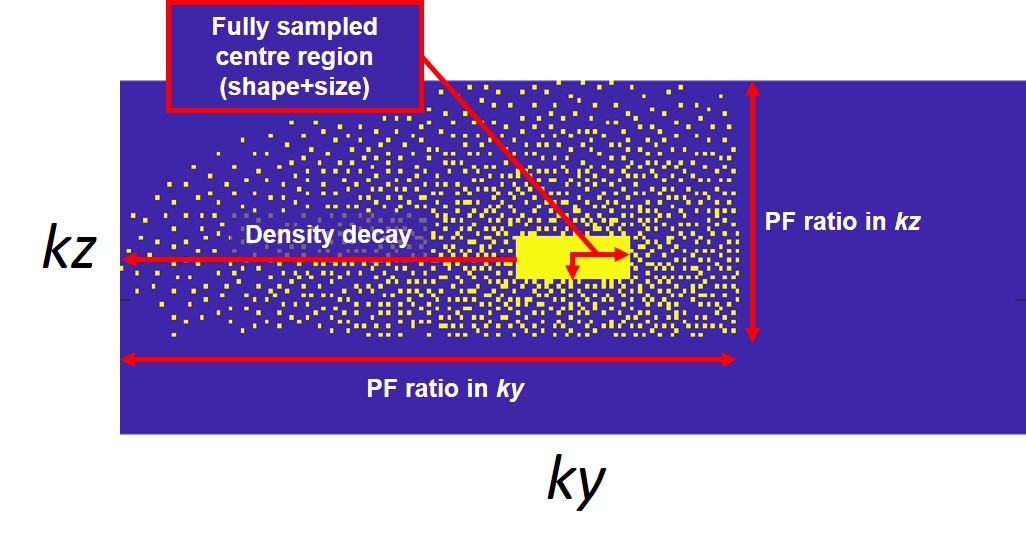
NCE-MRA techniques such as fresh blood imaging (FBI)1 suffer from long acquisition times, which not only limits the clinical acceptance of these techniques but also renders them sensitive to artefacts from patient motion. Compressed sensing (CS), parallel imaging (PI) and partial Fourier (PF) sampling can be used to accelerate the acquisition by using, for example, a Poisson-disk sampling pattern (Fig. 1)2. However, the design of the optimal sampling pattern, and parameters still needs to be evaluated.Conventionally the sampling pattern reflects the underlying signal density of k-space, which is most densely sampled in the centre of k-space3. Typically, a variable sampling density of the Poisson-disk distribution is preferred4. The density decay factor, determining the reduction of sampling density towards the periphery of k-space, needs to be optimised.
PF Sampling can be applied by covering only a fraction of k-space in both ky and kz dimensions (for 3D acquisitions) and using conjugate symmetry to fill the missing sections5. It remains unclear whether the introduction of PF can further improve acceleration performance or not in comparison with only using CS and PI, and what fraction of k-space in two dimensions should be filled in pattern design.
The fully sampled centre region of k-space is used for calibration in PI and phase estimation for PF homodyne detection. The shape and size of the calibration region can also influence the reconstruction quality and needs to be optimised.
This study investigates the optimal values for the above characteristics of sampling pattern design. Retrospective sub-sampling, i.e. acceleration, was performed on ten fully sampled datasets using different sampling patterns to determine the optimal ranges for parameters. The performance of the optimised patterns was then compared with typical non-optimised patterns.
Methods
Fully sampled femoral FBI datasets were acquired from ten healthy volunteers using a 1.5 T MR450 system (GE Healthcare, Waukesha, WI). Parameters included 224×224×80, ETL 80-90, FOV 40-44 cm, slice thickness 2 mm, TE 45ms, TR 2 or 3 heartbeats and total acquisition time 360 TRs. Retrospective simulated acceleration was performed using patterns with different parameters but the same total number of sampling points. Images were reconstructed using the k-space subtraction with phase and intensity correction method6.Peak signal-to-noise ratio (PSNR) and structural similarity index measure (SSIM)7 were calculated to evaluate reconstruction accuracy, using fully sampled images as the reference. Contrast-to-noise ratio (CNR) of artery-to-background8 was used as a no-reference matrix to evaluate the arterial signal intensity level. Arterial and background signal was calculated by applying arterial and background tissue masks obtained from bright-blood images and subtracted images respectively. The standard deviation of the difference image (subtraction images of the reconstructed angiograms from the reference fully sampled angiograms) was used for noise estimation.
An automatic method was implemented to assess the sharpness of the vessel edges. Arterial regions were detected on the individual axial slices by the circular Hough transform9. The sharpness is then evaluated on the profiles of the arterial edges in two directions using a least-squares curve fit based on the sigmoid function10.
Results
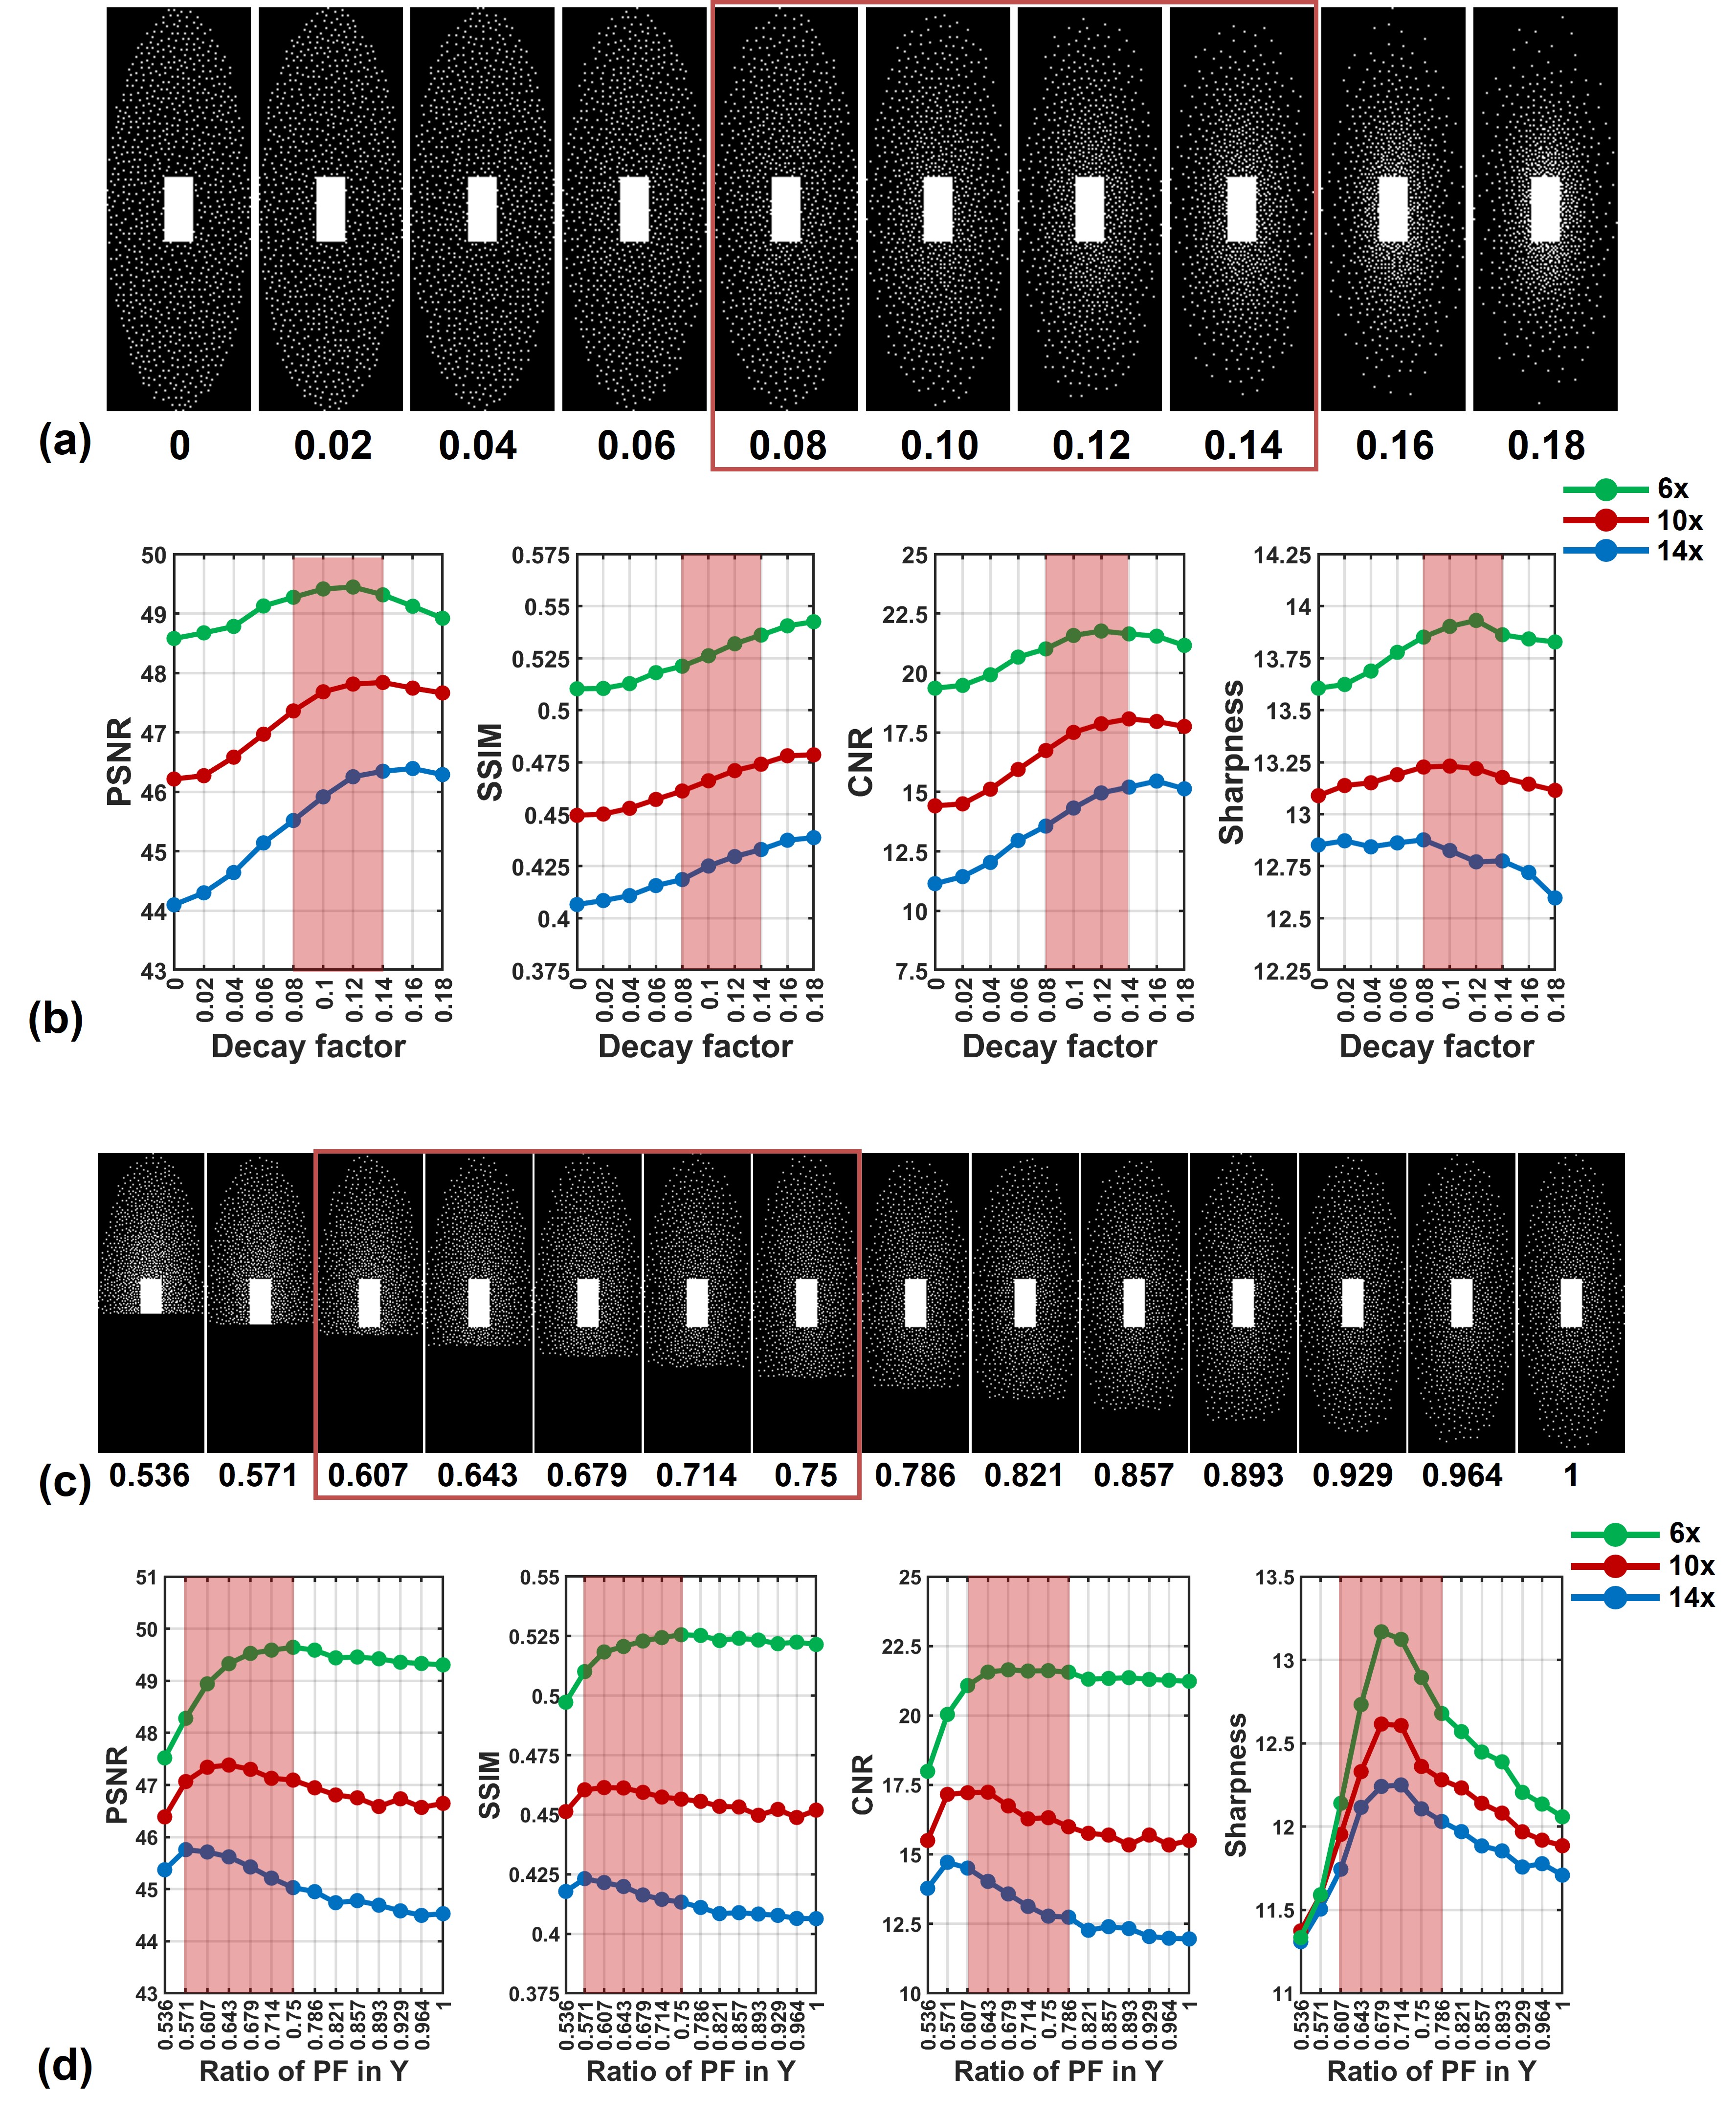
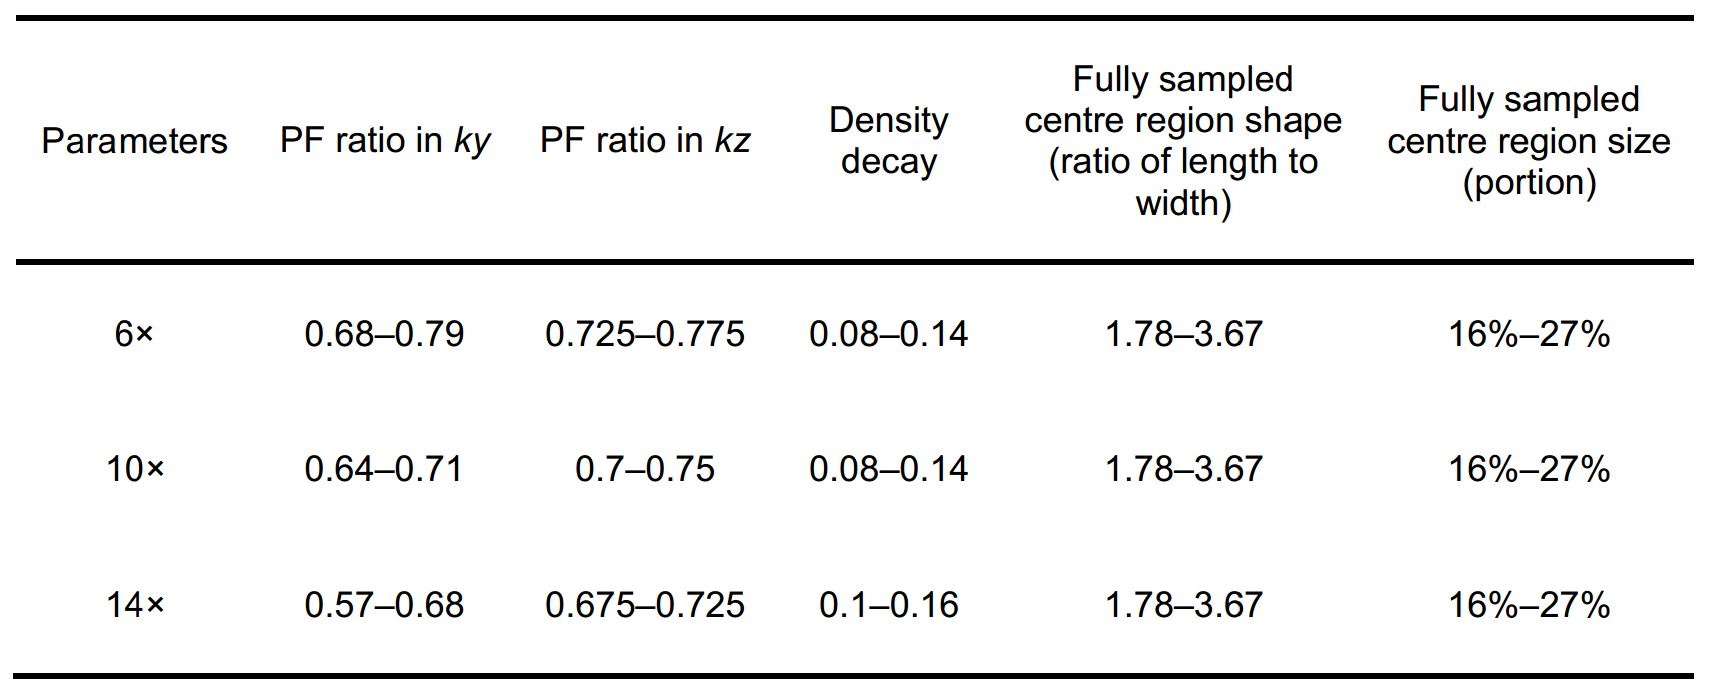
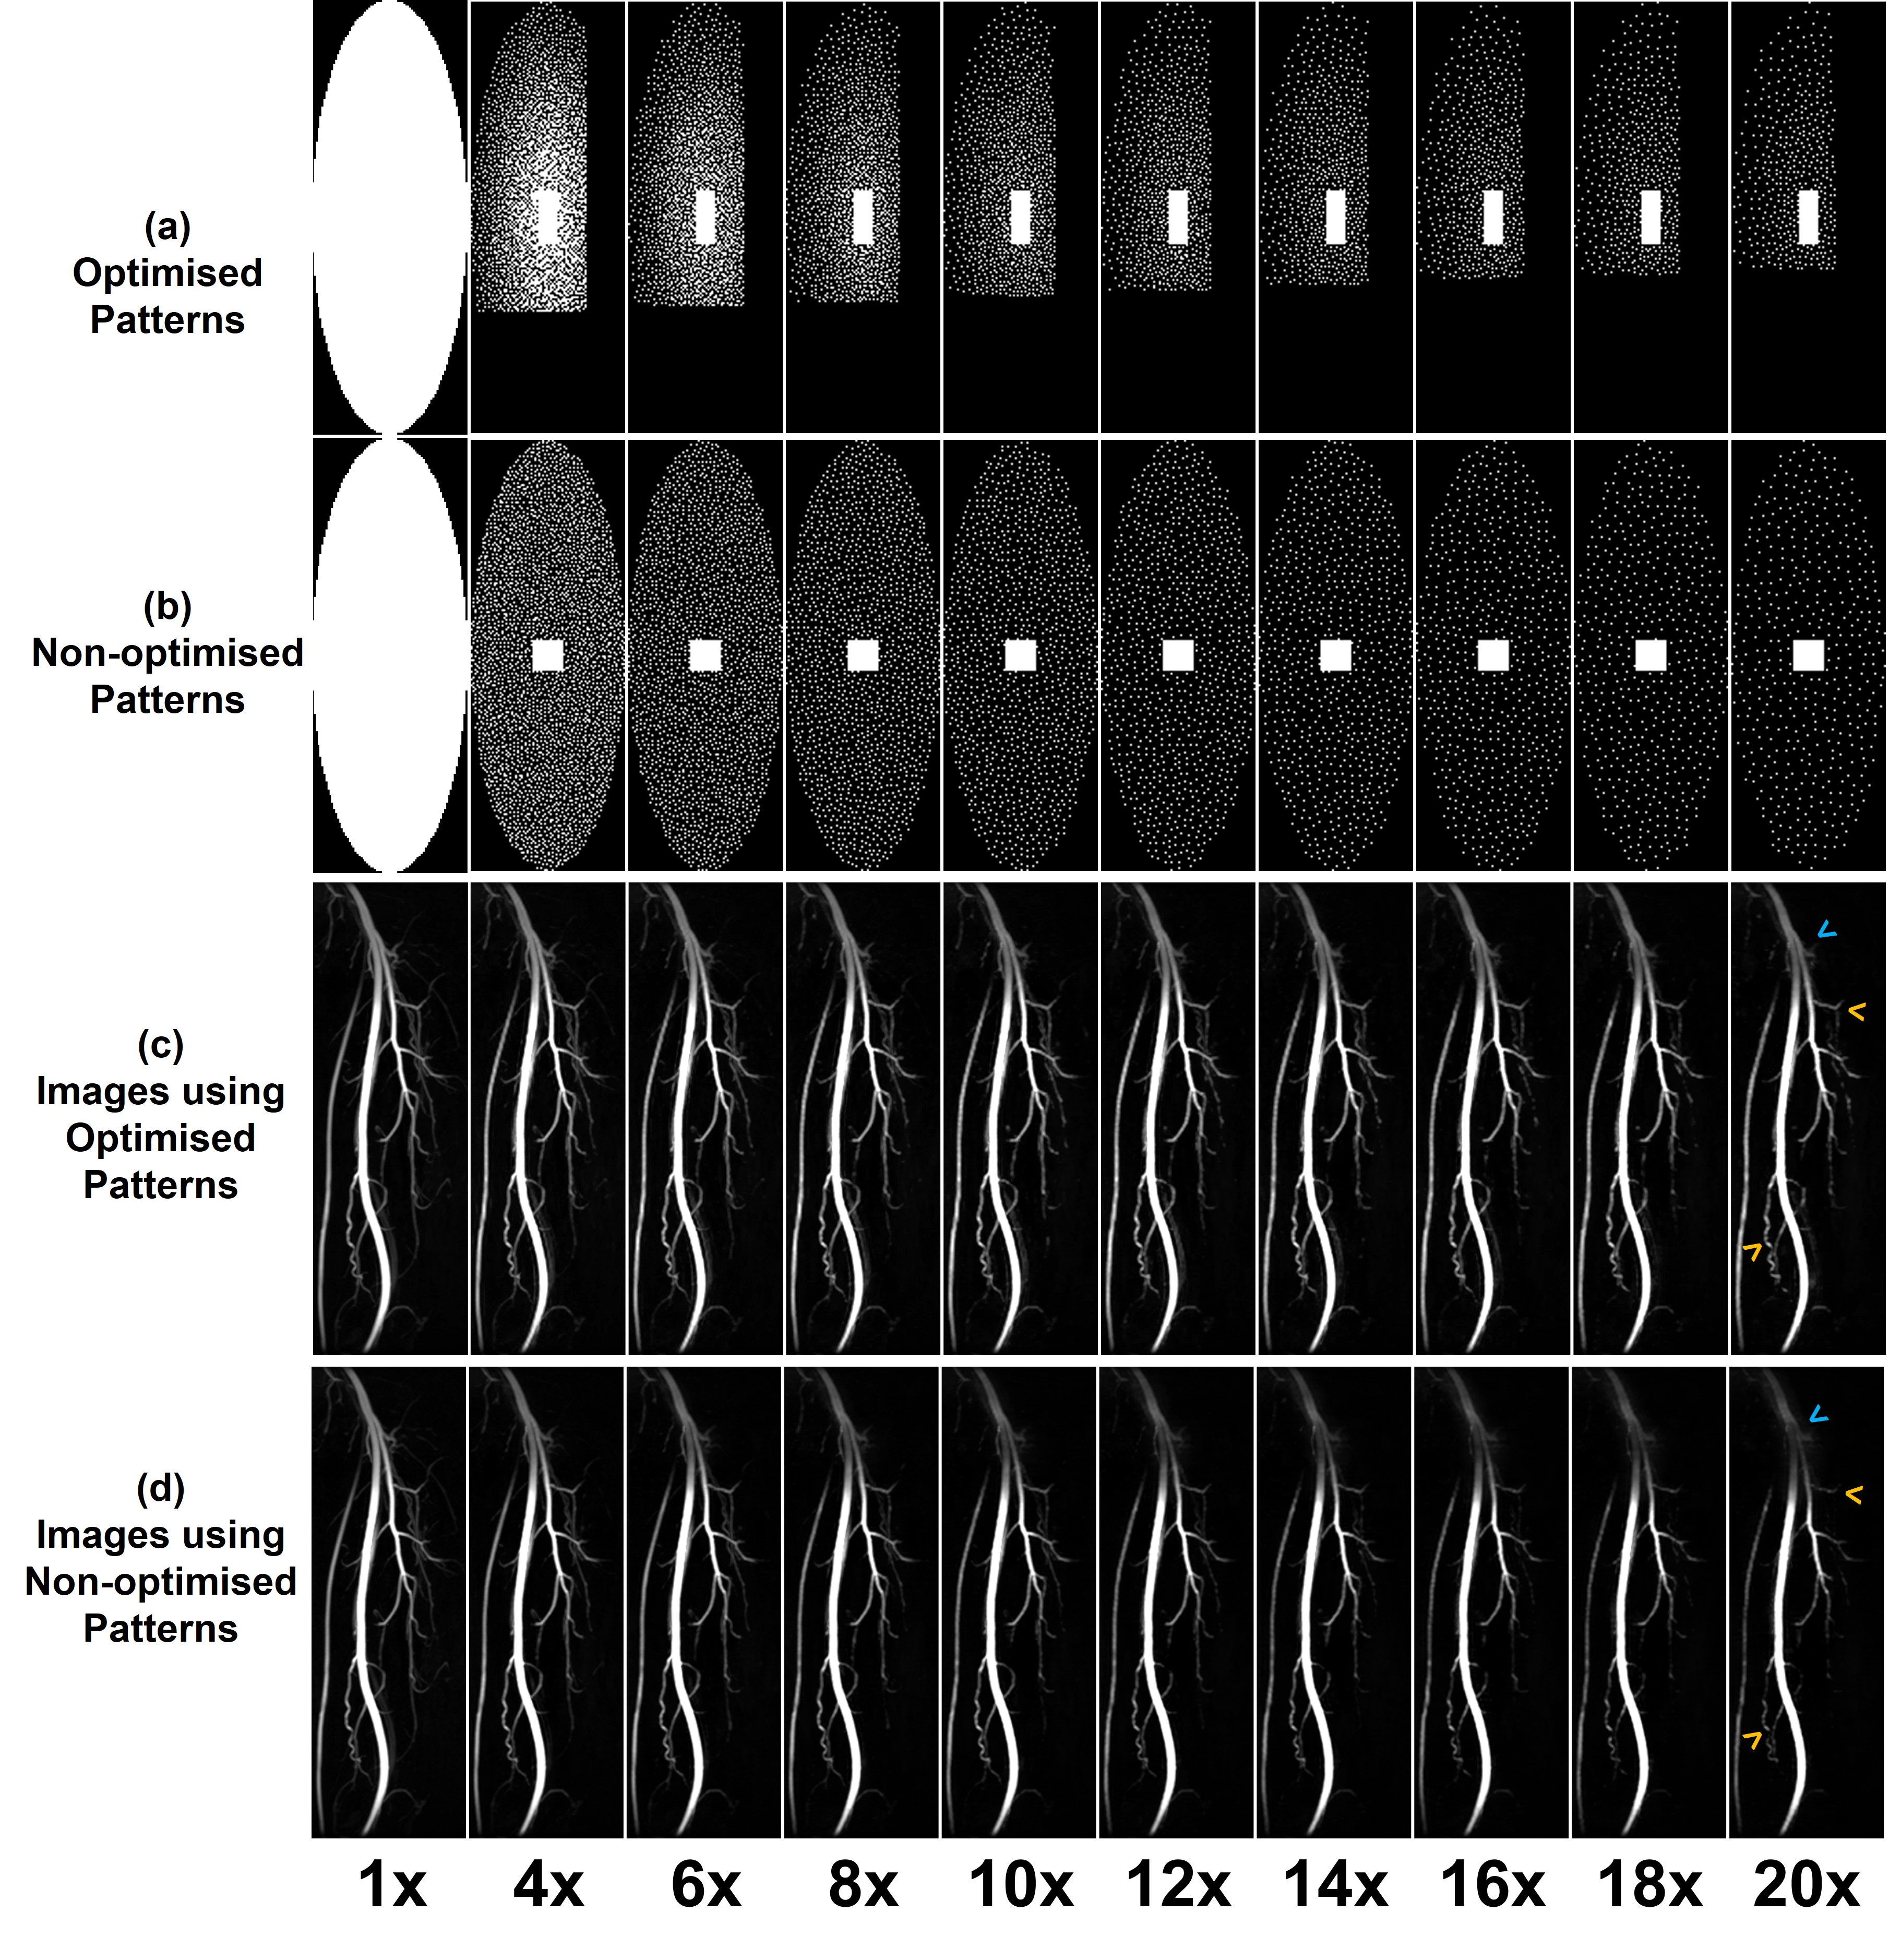
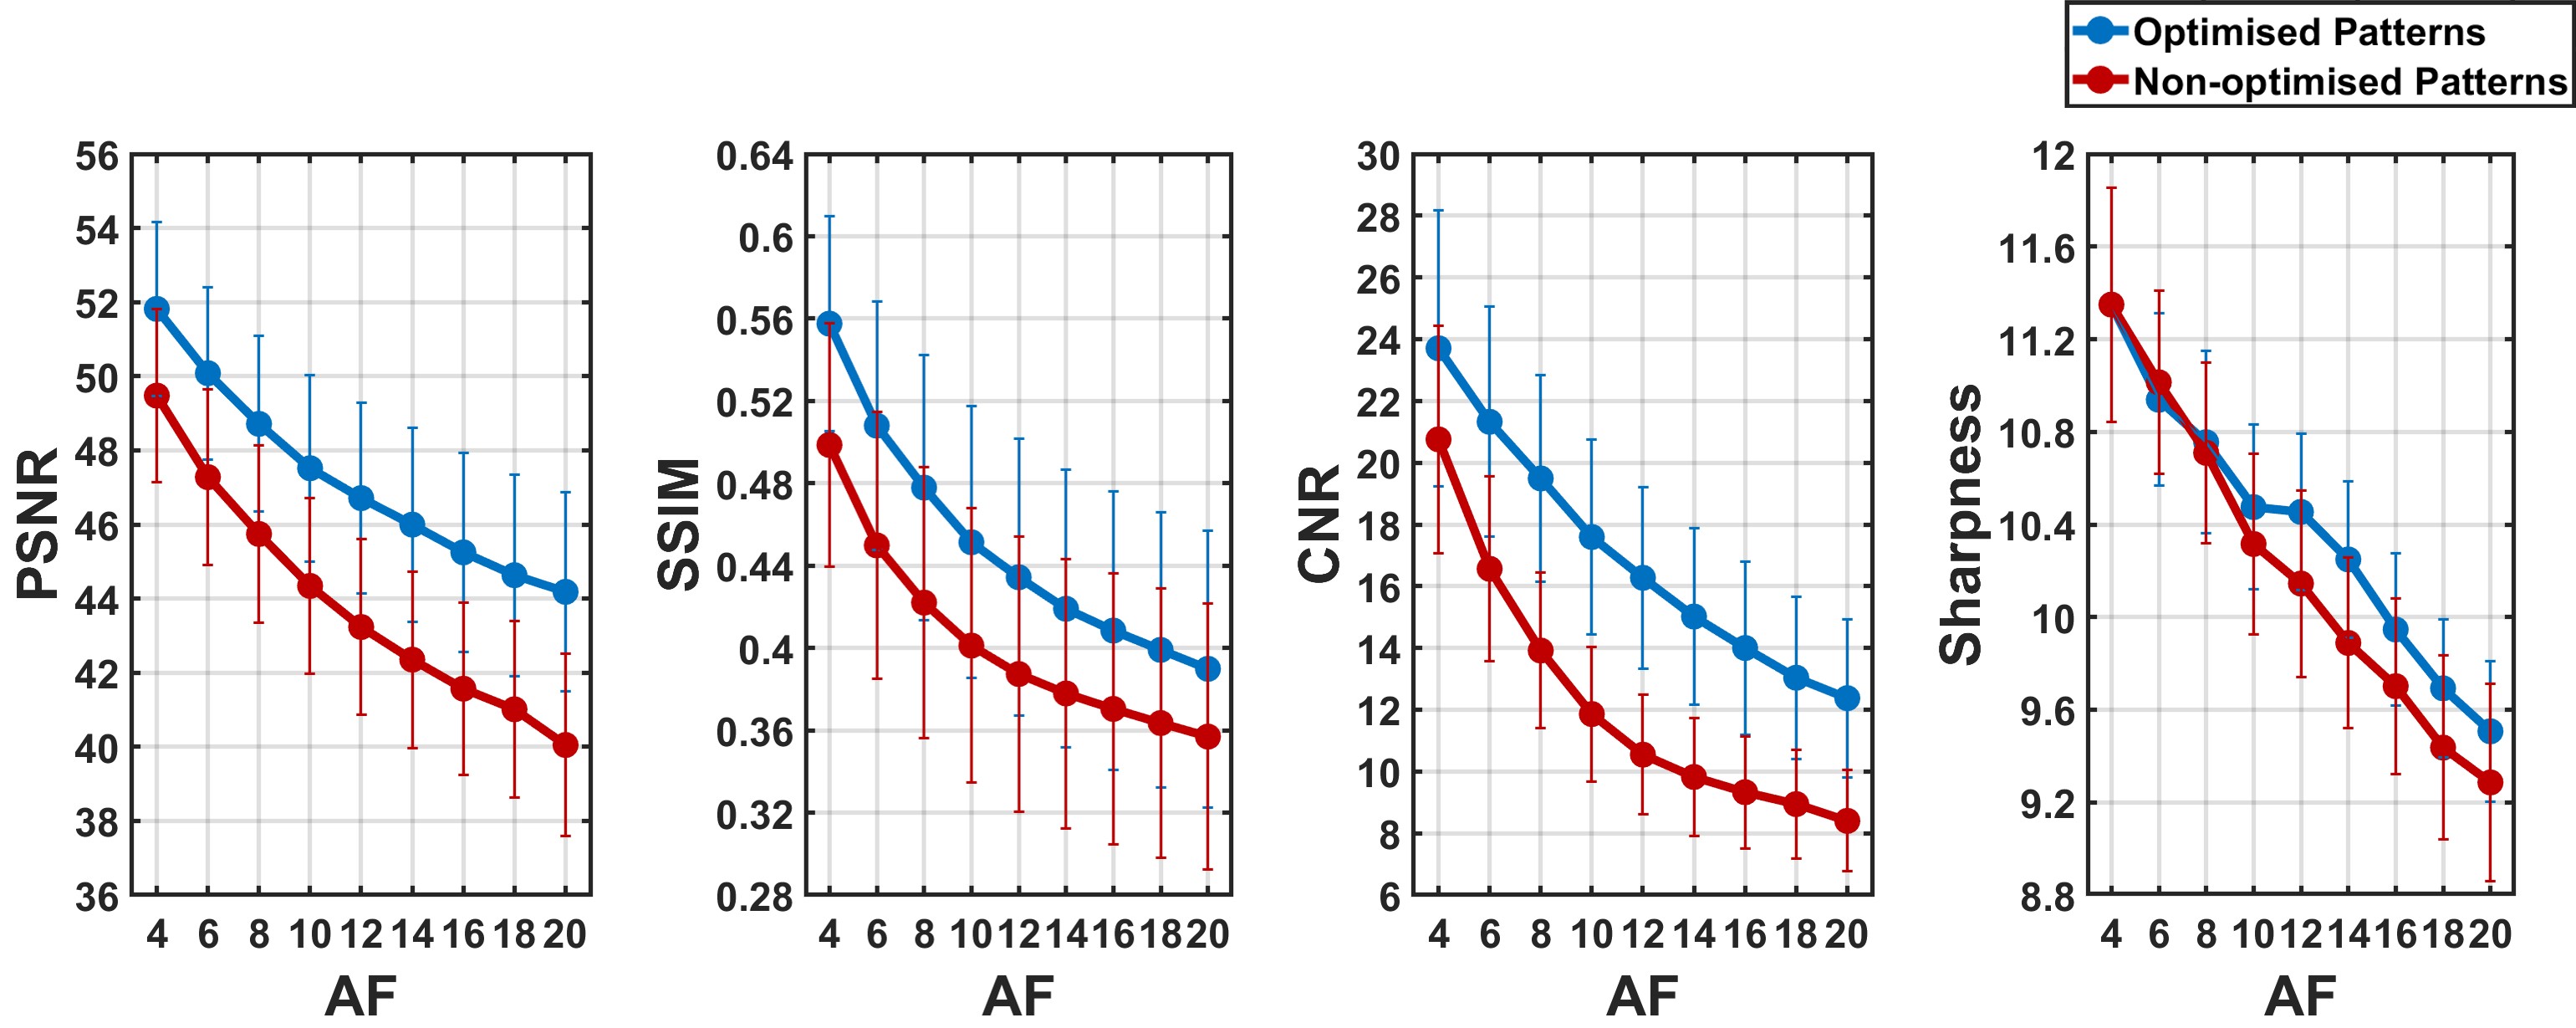
Fig. 2 shows two examples of the parameter optimisation process. The density decay factor optimisation (A and B) shows that the four metrics all returned high values when the factor is between 0.08 and 0.14, indicating an optimal value range in this study. The PF sampling ratio optimisation (C and D) demonstrates that the range between 0.571 and 0.75 would be the optimal range for PF sampling ratio in the ky dimension. It can also be observed that a smaller PF ratio is more desirable for a larger AF (14x), so that a sufficient density of the sampling pattern can be maintained. Similarly, we determined the optimal value ranges of the other parameters under different AFs in this study (Table 1). Sampling patterns under different AFs were designed using these ranges of optimal values. As shown in Fig. 3, the performance of sampling patterns with AFs from 4 to 20 was evaluated on the ten fully sampled datasets. A typical series of non-optimised patterns with uniform density, square fully sampled centre regions and without PF were also evaluated for comparison. It can be observed that the optimised patterns improved the image quality in terms of signal loss, blurring and depiction of small branches. The corresponding quantitative evaluation results are summarised in Fig. 5. Optimised patterns outperformed non-optimised patterns in all four metrics.Discussion and conclusion
In this study, we evaluated the influence of the parameters in Poisson-disk sampling pattern design and explored their optimal values. Optimised patterns outperformed non-optimised patterns in simulated acceleration. It was shown that compared to only using CS and PI, the implementation of PF in two directions (ky and kz) can further improve acceleration performance. Poisson-disk patterns using variable density with optimised k-space density decay factor performed better than uniformly distributed density patterns. It is possible that the optimal parameter values may vary for different vascular study regions, imaging protocols and reconstruction methods. Further work is planned to determine if these values are applicable generally or require specific technique- and region-based optimisation.Acknowledgements
The authors acknowledge the support of the Addenbrooke’s Charitable Trust and the NIHR Cambridge Biomedical Research Centre. Hao Li acknowledges the China Scholarship Council and Cambridge Trust for fellowship support.References
1. Miyazaki M, Sugiura S, Tateishi F, Wada H, Kassai Y, Abe H. Non-contrast-enhanced MR angiography using 3D ECG-synchronized half-Fourier fast spin echo. J. Magn. Reson. Imaging 2000;12:776–783.
2. Rapacchi S, Han F, Natsuaki Y, et al. High spatial and temporal resolution dynamic contrast-enhanced magnetic resonance angiography using compressed sensing with magnitude image subtraction. Magn. Reson. Med. 2014;71:1771–1783.
3. Hollingsworth KG. Reducing acquisition time in clinical MRI by data undersampling and compressed sensing reconstruction. Phys. Med. Biol. 2015;60:R297–R322.
4. Margosian PM, Seiberlich N, Takizawa M. Exploitation of Sparsity in MRI. 2013;2:289–306.
5. Xu Y, Mark Haacke E. Partial fourier imaging in multi-dimensions: A means to save a full factor of two in time. J. Magn. Reson. Imaging 2001;14:628–635.
6. Li H, Priest AN, Graves MJ, Lomas DJ. Highly Accelerated NCE-MRA Using Complex Subtraction with Intensity Correction: Improved Reconstruction Accuracy and Background Tissue Suppression. In: Proceedings of the 27th Annual Meeting of ISMRM, Montreal, Canada. ; 2019. p. 834.
7. Horé A, Ziou D. Image quality metrics: PSNR vs. SSIM. In: Proceedings - International Conference on Pattern Recognition. ; 2010. pp. 2366–2369.
8. Akasaka T, Fujimoto K, Yamamoto T, et al. Optimization of regularization parameters in compressed sensing of magnetic resonance angiography: Can statistical image metrics mimic radiologists’ perception? PLoS One 2016;11:1–14.
9. Atherton TJ, Kerbyson DJ. Size invariant circle detection. Image Vis. Comput. 1999;17:795–803.
10. Ahmad R, Ding Y, Simonetti OP. Edge sharpness assessment by parametric modeling: Application to magnetic resonance imaging. Concepts Magn. Reson. Part A 2015;44:138–149.
Figures