2154
A comparative study on TRANCE and bFFE imaging of hepatic portal vein with Time-SLIP
Yan WANG1, Yuli HUANG2, Haiyang DONG3, and Li ZHU3
1Department of Radiology, People’s Hospital of Xinjiang Uygur Autonomous Region, Urumqi, China, 2MR, Philips Healthcare (Suzhou) Co., Ltd, SUZHOU, China, 3Radiology, Shanghai Chest Hospital, Shanghai JiaoTong University, Shanghai, China
1Department of Radiology, People’s Hospital of Xinjiang Uygur Autonomous Region, Urumqi, China, 2MR, Philips Healthcare (Suzhou) Co., Ltd, SUZHOU, China, 3Radiology, Shanghai Chest Hospital, Shanghai JiaoTong University, Shanghai, China
Synopsis
The Time-Spatial Labeling Inversion Pulses (Time-SLIP) technique was used to perform non-contrast enhanced hepatic portal vein imaging using 3D TRANCE and 3D Balanced FFE methods respectively, and the image quality obtained by the two imaging methods and the number of branches of hepatic portal vein were compared specifically. Both 3D TRANCE and 3D Balanced FFE imaging methods with Time-SLIP can be used for hepatic portal vein imaging. The image quality of hepatic portal vein obtained by 3D TRANCE was generally better than 3D Balanced FFE.
INTRODUCTION
Anatomical structure of portal vein, which plays an important role in liver surgery, mostly relies on imaging techniques, such as computed tomography angiography (CTA), digital subtraction angiography (DSA) and contrast enhanced magnetic resonance angiography (CE-MRA). Recently, non-contrast enhanced MRA sequence has been developed for observing structure and branches of portal vein1-3. Time-spatial labeling inversion pulse (Time-SLIP) assists in morphological diagnosis via selectively observing the target region4,5. In the present study, we investigated the performance of non-contrast enhanced angiography (TRANCE) without ECG triggered and 3D balanced fast field echo (3D bFFE) using Time-SLIP on abdominal MRI for portal vein6-9.METOHDS
Study sample: Eleven male and fourteen female healthy controls (mean age, 38.3 ± 12.8 years) without any contraindication to MR scanning underwent abdominal MR imaging. All the parts of this study were approved by local institutional review board and written consent form was obtained from each subject. MR imaging: Abdominal MR imaging was acquired on a 1.5 Tesla MR scanner (Achieva, Philips Hearthcare) with an 8-channel abdominal coil (Figure 1). A 2D balanced FFE (bFFE) scan with sequential phases was performed with breath-hold to calculate optimized inverse time delay (TI delay) (Figure 2). The TRANCE sequence was executed with following parameters: repetition time 2000-3000ms, echo time 144ms, inversion time 160ms, field of view 420×420mm2, flip angle 90°, slice thickness 3.0mm. The 3D balanced FFE was executed using following parameters: repetition time 5.6-6.0 ms, echo time 1.86 ms, inversion time 160ms, field of view 420×420mm2, flip angle 85°, slice thickness 3.0mm. Data Analysis: Abdominal MR images were reviewed by two radiologists with >10 years` experience blinded to each other. Each reviewer drew seven regions of interest (ROIs) >50mm2 in main portal vein (MPV), superior mesenteric vein (SMV), splenic vein (SV), and left, and right portal vein (LPV, RPV), respectively. Signal-to-noise ratio (SNR) and contrast-to-noise ratio (CNR) were calculated in MPV, SMV, SV, LPV and RPV with following equation:SNR=Svessel/SD(Snoise)
CNR=(Svessel-Sliver)/SD(Snoise)
where Svessel, Sliver represented the mean value of signal in MPV and its branches, signal of hepatic parenchymal tissue, respectively. Besides, each reviewer also counted the number of PV branches in different orders and evaluated the image quality with 1 to 4 score. The mean values of measurements from two reviewers were recorded. Statistical Analysis: The SNR and CNR were compared between the ROI in TRANCE and 3D bFFE using an independent t test. The amounts of branches in different orders were compared between TRANCE and bFFE via performing Kruskai-Wallis Test. A p<0.05 was considered as statistically significantly and all statistical analysis was conducted with SPSS 25.0 (IBM Inc., USA).
RESULTS
Compared to 3D bFFE, TRANCE showed a higher SNR (MPV: 227± 118 vs. 140 ± 59, SMV: 218 ± 103 vs. 130 ± 53, SV: 209 ± 104 vs. 135 ± 62, LPV: 207 ± 110 vs. 124 ± 53, RPV: 220 ± 113 vs. 140 ± 61) and CNR (MPV: 203 ± 105 vs. 103 ± 48, SMV: 195 ± 91 vs. 92 ± 40, SV: 186 ± 92 vs. 97 ± 51, LPV: 184 ± 98 vs. 86 ± 40, RPV: 197 ± 100 vs. 102 ± 47), more branch count in left (order 2: 5.0 ± 1.6 vs. 4.2 ± 1.5, order 3: 2.4 ± 2.7 vs. 1.4 ± 1.9, order 4: 0.2 ± 0.5 vs. 0.1 ± 0.2 ) and right branch (order 2: 7.5 ± 2.0 vs. 7.1 ± 2.2,order 3: 11.8 ± 5.0 vs. 9.8 ± 5.3, order 4: 4.6 ± 3.4 vs. 2.5 ± 2.2) and better image quality (3.6 ± 0.5 vs. 3.0 ± 0.8). (Table 1)DISCUSSION
The TRANCE sequence was a turbo spin echo sequence which could obtain clear structure of portal vein using optimized background and fat suppression. Compared to 3D bFFE, TRANCE was less sensitive to susceptibility and exhibited better illustration of portal vein branches. Thus, TRANCE with Time-SLIP could provide a distinct structure in abdominal MRI for portal vein. (Figure 3)CONCLUSION
Compared to 3D bFFE, TRANCE was validated to be a better technique in portal vein imaging in the present study via exhibiting higher SNR and CNR, more branch count and better image quality.Acknowledgements
No acknowledgement found.References
- Miyazaki M, Isoda H. Non-contrast-enhanced MR angiography of the abdomen[J]. European Journal of Radiology, 2011, 80(1):0-23. doi: 10.1016/j.ejrad.2011.01.093.
- Wheaton A J, Miyazaki M. Non-contrast enhanced MR angiography: Physical principles[J]. Journal of Magnetic Resonance Imaging, 2012, 36(2). doi: 10.1002/jmri.23641.
- Laissy J P, Trillaud H, Douek P. MR angiography: noninvasive vascular imaging of the abdomen[J]. Abdominal Imaging, 2002, 27(5):488-506. DOI: 10.1007/s00261-001-0063-2.
- Chen WT, Liang JL, Chen MH, et al. Noncontrast Magnetic Resonance Angiography Using Inflow Sensitive Inversion Recovery Technique for Vascular Evaluation in Pre–liver Transplantation Recipients[J]. Transplantation Proceedings, 2016, 48(4):1032-1035. doi: 10.1016/j.transproceed.2015.12.083.
- Gutzeit A, Sutter R, Froehlich JM, et al. ECG-Triggered Non-Contrast-Enhanced MR Angiography (TRANCE) versus Digital Subtraction Angiography (DSA) in patients with peripheral arterial occlusive disease of the lower extremities[J]. International Journal of Medical Radiology, 2011, 21(9):1979-1987. doi: 10.1007/s00330-011-2132-4.
- Tsuyoshi Ohno, Hiroyoshi Isoda, Akihiro Furuta and Kaori Togashi. Non-contrast-enhanced MR portography and hepatic venography with time-spatial labeling inversion pulses: comparison at 1.5 Tesla and 3 Tesla. Acta Radiol Open. 2015, May;4(5):2058460115584110. doi: 10.1177/2058460115584110.
- Ono A, Arizono S, Fujimoto K, et al. Non-contrast-enhanced 3D MR portography within a breath-hold using compressed sensing acceleration: A prospective noninferiority study[J]. Magnetic Resonance Imaging, 2017, 43:42-47. doi: 10.1016/j.mri.2017.07.001.
- Shimizu H, Isoda H, Ohno T, et al. Non-contrast-enhanced MR portography and hepatic venography with time-spatial labeling inversion pulses: Comparison of imaging with the short tau inversion recovery method and the chemical shift selective method[J]. Magnetic Resonance Imaging, 2015, 33(1):81-85. DOI: 10.1016/j.mri.2014.08.013
- Shonai T, Takahashi T, Ikeguchi H, et al. Improved arterial visibility using Short-Tau Inversion-Recovery (STIR) fat suppression in non-contrast-enhanced Time-Spatial Labeling Inversion Pulse (Time-SLIP) renal MR Angiography (MRA)[J]. Journal of Magnetic Resonance Imaging , 2009, Jun;29(6):1471-1477. doi: 10.1002/jmri.21792.
Figures
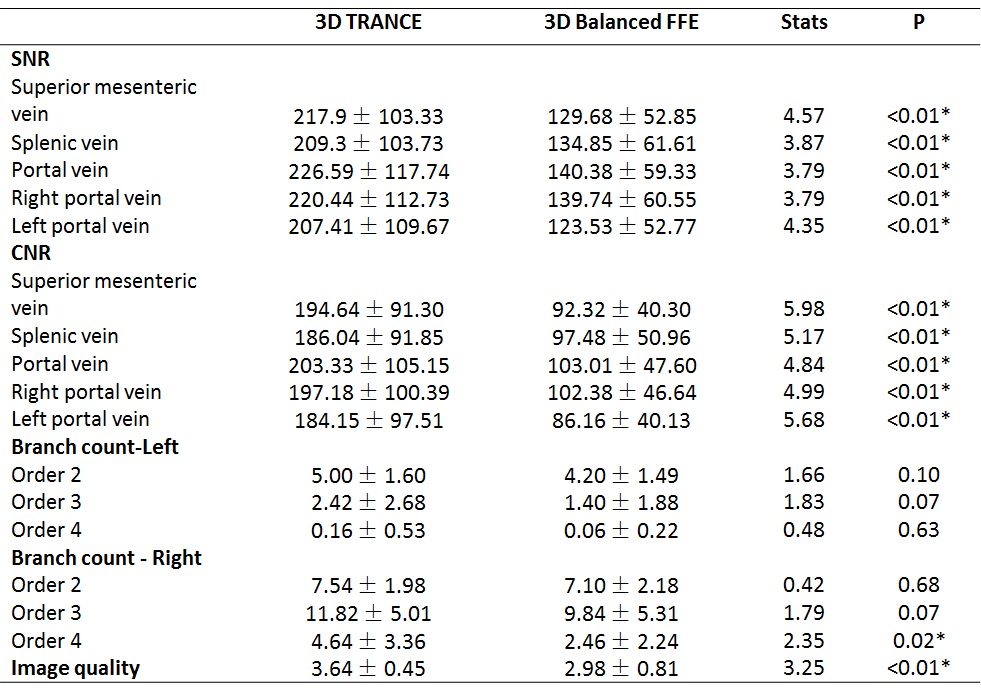
Table1. Statistical analysis results of the SNR and CNR, the number of
branches, image quality for portal vein imaging between 3D TRANCE and bFFE.
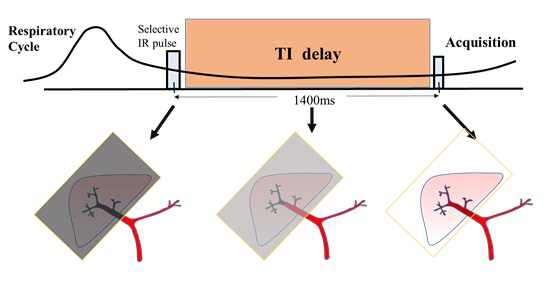
Figure 1. Schematic diagram of the Time-SLIP imaging for portal vein. The
selective inversion recovery pulse is applied at the end of expiration to
suppress the parenchymal tissue signal in the liver region and left ventricular
arterial blood. By the optimized delay time, the recovery of the background tissue
signal is basically close to the null signal point, while the blood in the
splenic vein and the superior mesenteric vein flows into the liver area
therefore shows high signal.
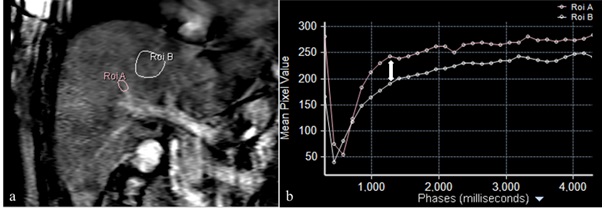
Figure 2. 2D balanced FFE scan with sequential phases.
a). ROI were selected in right portal vain and liver parenchyma. b). Signal
recovery curve of the portal vein and liver parenchyma. In this case, the
maximum time point (double-headed arrow) of signal intensity difference between
the SI curve of portal vein branch and of liver parenchyma was taken as the
delay Time of Time SLIP.
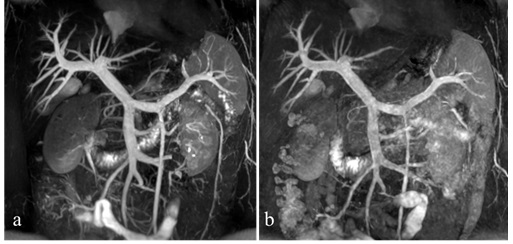
Figure 3. Hepatic portal vein imaging. a). 3D TRANCE. b). 3D Balanced
FFE. The hepatic portal vein is well illustrated with the optimal background
tissue on both images. The 3D TRANCE vascular signal is more uniform than the
3D Balanced FFE, and the motion artifacts are smaller.