2128
Chemical Exchange Saturation Transfer Imaging for Atherosclerotic Plaques
Yuki Kanazawa1, Masafumi Harada1, Tosiaki Miyati2, Takashi Abe1, Mitsuharu Miyoshi3, Yuki Matsumoto1, Hiroaki Hayashi2, Yasuhisa Kanematsu4, and Yasushi Takagi4
1Tokushima University, Tokushima, Japan, 2Faculty of Health Sciences, Institute of Medical, Pharmaceutical and Health Sciences, Kanazawa University, Kanazawa, Japan, 3Global MR Applications and Workflow, GE Healthcare Japan, Hino, Japan, 4Department of Neurosurgery, Tokushima University, Tokushima, Japan
1Tokushima University, Tokushima, Japan, 2Faculty of Health Sciences, Institute of Medical, Pharmaceutical and Health Sciences, Kanazawa University, Kanazawa, Japan, 3Global MR Applications and Workflow, GE Healthcare Japan, Hino, Japan, 4Department of Neurosurgery, Tokushima University, Tokushima, Japan
Synopsis
To assess an activity within an atherosclerotic plaque, chemical exchange saturation transfer (CEST) imaging was demonstrated with the multi-pool model Bloch equation. This study was performed with eleven patients with carotid stenosis, was evaluated with each estimated parameters; bulk water, magnetization transfer, amide proton transfer (APT), and nuclear Overhauser effect (NOE). There was no significant difference between mean APT and NOE at 3.5 ppm. This result indicates that CEST plaque imaging should be evaluated with distinguishing APT and NOE. Multi-parametric analysis of CEST imaging may obtain detailed information for component as well as metabolite substances within an atherosclerotic plaque.
Introduction
Magnetic resonance imaging (MRI) has been used for diagnosis and evaluation of advanced atherosclerotic lesions, i.e., atherosclerotic plaque. Conventional MRI such as T1 weighted (T1w) and T2 weighted (T2w) imaging with fat-suppression (FS) have various signal patterns depending on the histological properties of each atherosclerotic plaque including the lipid rich necrotic core (LRNC).1 However, because signal patterns of atherosclerotic plaques from conventional MRI overlap considerably during clinical studies, it is difficult to distinguish detailed characteristics.2 On the other hand, chemical exchange saturation transfer (CEST) imaging can detected mobile macromolecular protons such as amide protons and is useful for some clinical application. If CEST imaging can detect mobile proteins found within a plaque, it may lead to a predictor of plaque activity. The purpose in our study was to assess each parameter derived from CEST imaging using the multi-pool model Bloch equation for atherosclerotic plaque cases.Materials and Methods
This prospective study was approved by the institutional review board and all imaging datasets for eleven patients with carotid stenosis was acquired from each patient after informed consent was obtained from the patients. After the MRI study, all patients had carotid endarterectomy (CEA) or carotid artery stenting (CAS) performed (Table 1). This study was carried out on a 3.0 Tesla MR system (GE Healthcare) with NV-Head coil as a receiver. A CEST imaging dataset was acquired using a single-shot fast spin-echo (SSFSE) sequence and phase cycle radio frequency (RF) preparation; the frequency offset range was from -7 to +7 ppm at intervals of 0.5 ppm, and a total of 29 data points were acquired. The mean B1 values of the MT pulses were set at 0.5, 1.0 µT, and the RF duration time was 1.5 sec. The other imaging parameters were echo time, 27.9 ms; repetition time, 5719 ms; bandwidth, 473 Hz/pixel; field of view, 16 cm; matrix size, 128 × 128; slice thickness, 3 mm. Slice positions were set at one or two slices on plaque observed with maximum area. Acquired imaging data were applied to B0 correction and motion correction for each pixel. Post processing of CEST imaging was performed using the multi-pool model Bloch equation; bulk water, magnetization transfer (MT), amide proton transfer (APT), and nuclear Overhauser effect (NOE). Each parameter estimation of the multi-pool model Bloch equation was as follows;$$\frac{dm}{dt}=A\cdot{m}+R_{1}{m_{0}}=0\left(Eq.1\right) $$
$$m=-A^{-1}R_{1}m_{0}\left(Eq.2\right)$$
where, A is a matrix representation including parameters of MT, APT, and NOE, m0 is thermal equilibrium including bulk water. m is a steady state signal, which includes measured Z-spectrum. R1 is relaxation rate, which was fixed in this fitting. Each parameter was calculated from Z and CEST peak extraction (CPE) spectrum fitting,3 which minimize the error between measured and calculated Z-spectrum. Then APT and NOE concentration map were generated. To compare CEST images, conventional black blood MRI (T1w and T2w images) was acquired. Region of interest (ROI) analysis was performed for in-plane whole plaque. Then, conventional MRI signals were normalized by muscle signal.
Results & Discussions
Figure 1 shows the scattered relationship for each conventional MR signal and each estimation parameter in the plaque regions. The relationship between bulk water and each conventional MR signal showed good linearity (T1w, R = 0.66, P = 0. 252; T2w, R = 0.69, P = 0.0185). Figure 2 shows violin plot measured values of each estimated signal in the plaque regions. There was no significant difference between mean APT and NOE at 3.5 ppm (Fig.2). Figure 3 and 4 shows patients with atherosclerotic plaques. Both APT and NOE signal were low in Fig. 3. However, both APT and NOE signal were high in Fig. 4. CEST imaging in the atherosclerotic plaque should be evaluated with distinguishing APT and NOE. It is necessary to investigate and clarify biomechanisms of increasing NOE signals within atherosclerotic plaques.Conclusion
Multi-parametric analysis of CEST imaging may obtain detailed information for not only component but also metabolite substances within an atherosclerotic plaque.Acknowledgements
This study was partly supported by JSPS KAKENHI [grant number 17K09065].References
- Cai JM, Hatsukami TS, Ferguson MS, Small R, Polissar NL, Yuan C. Classification of human carotid atherosclerotic lesions with in vivo multicontrast magnetic resonance imaging. Circulation. 2002;106(11):1368-73.
- Saam T, Hatsukami TS, Takaya N, Chu B, Underhill H, Kerwin WS, et al. The vulnerable, or high-risk, atherosclerotic plaque: noninvasive MR imaging for characterization and assessment. Radiology. 2007;244(1):64-77.
- Miyoshi M, Matsuda T, and Kabasawa H. CEST Peak Extraction method for multi peak fitting. Proceedings of the 23th Annual Meeting of ISMRM. 2015;3346.
Figures
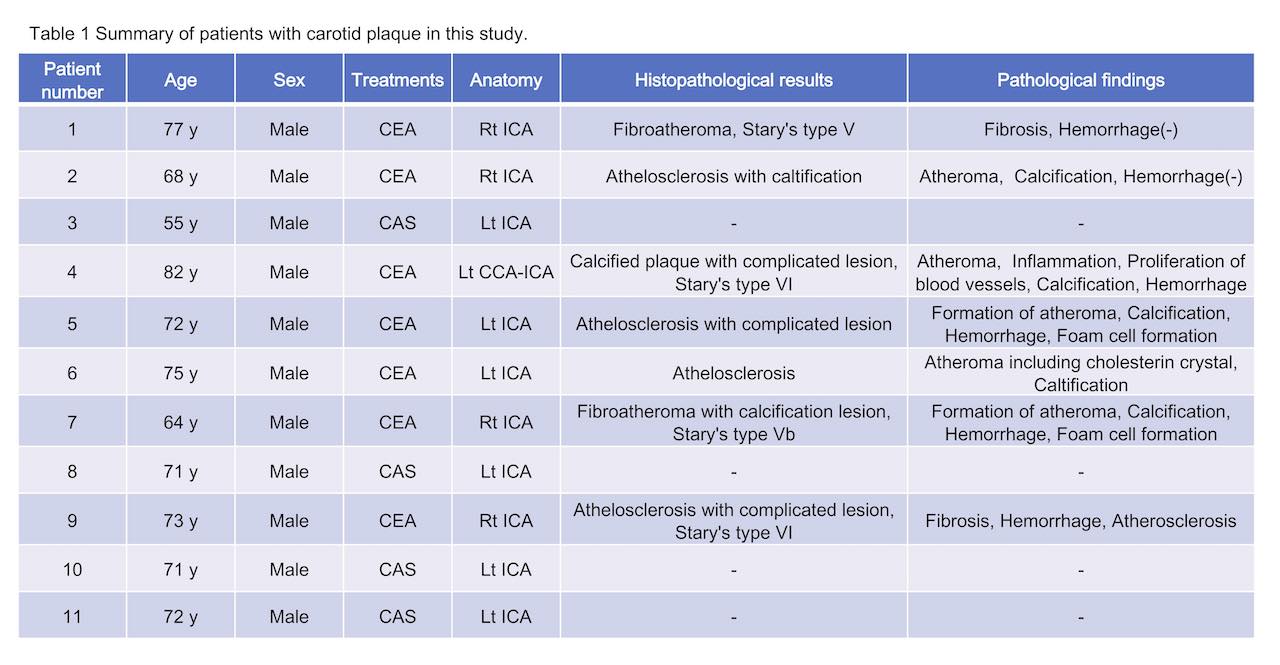
Table 1 Summary of patients with
carotid plaque in this study.
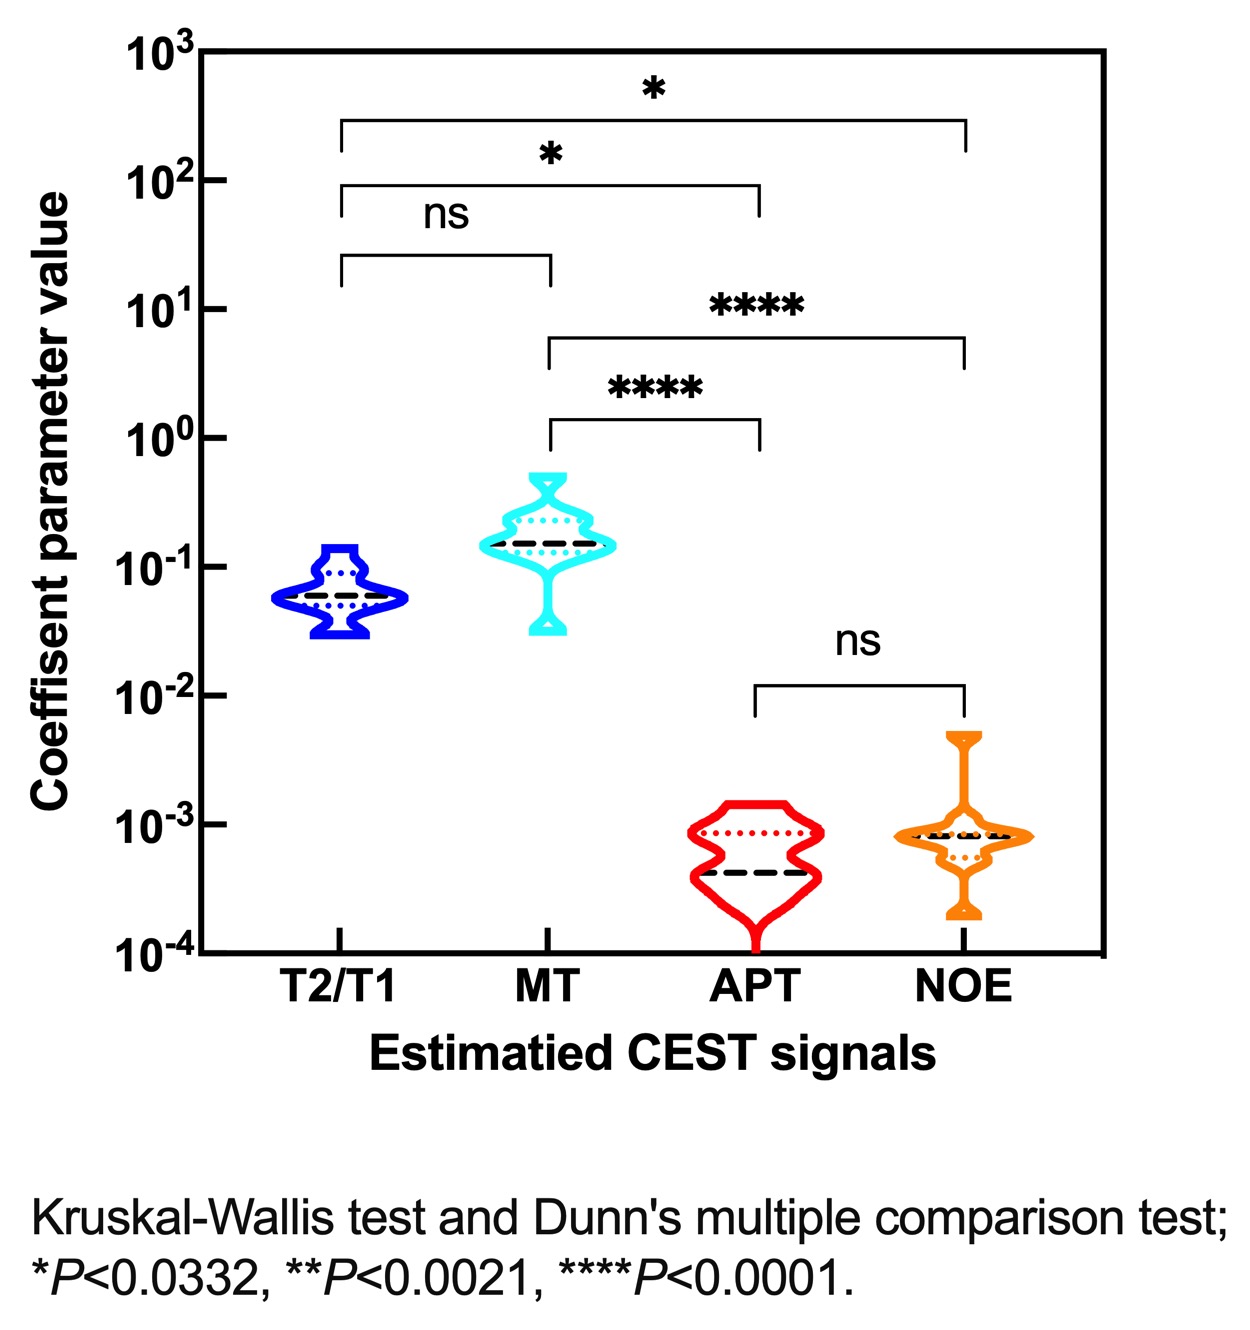
Fig. 1 Scatter plots of each conventional MRI signals and each
estimated parameters of CEST for eleven subjects.
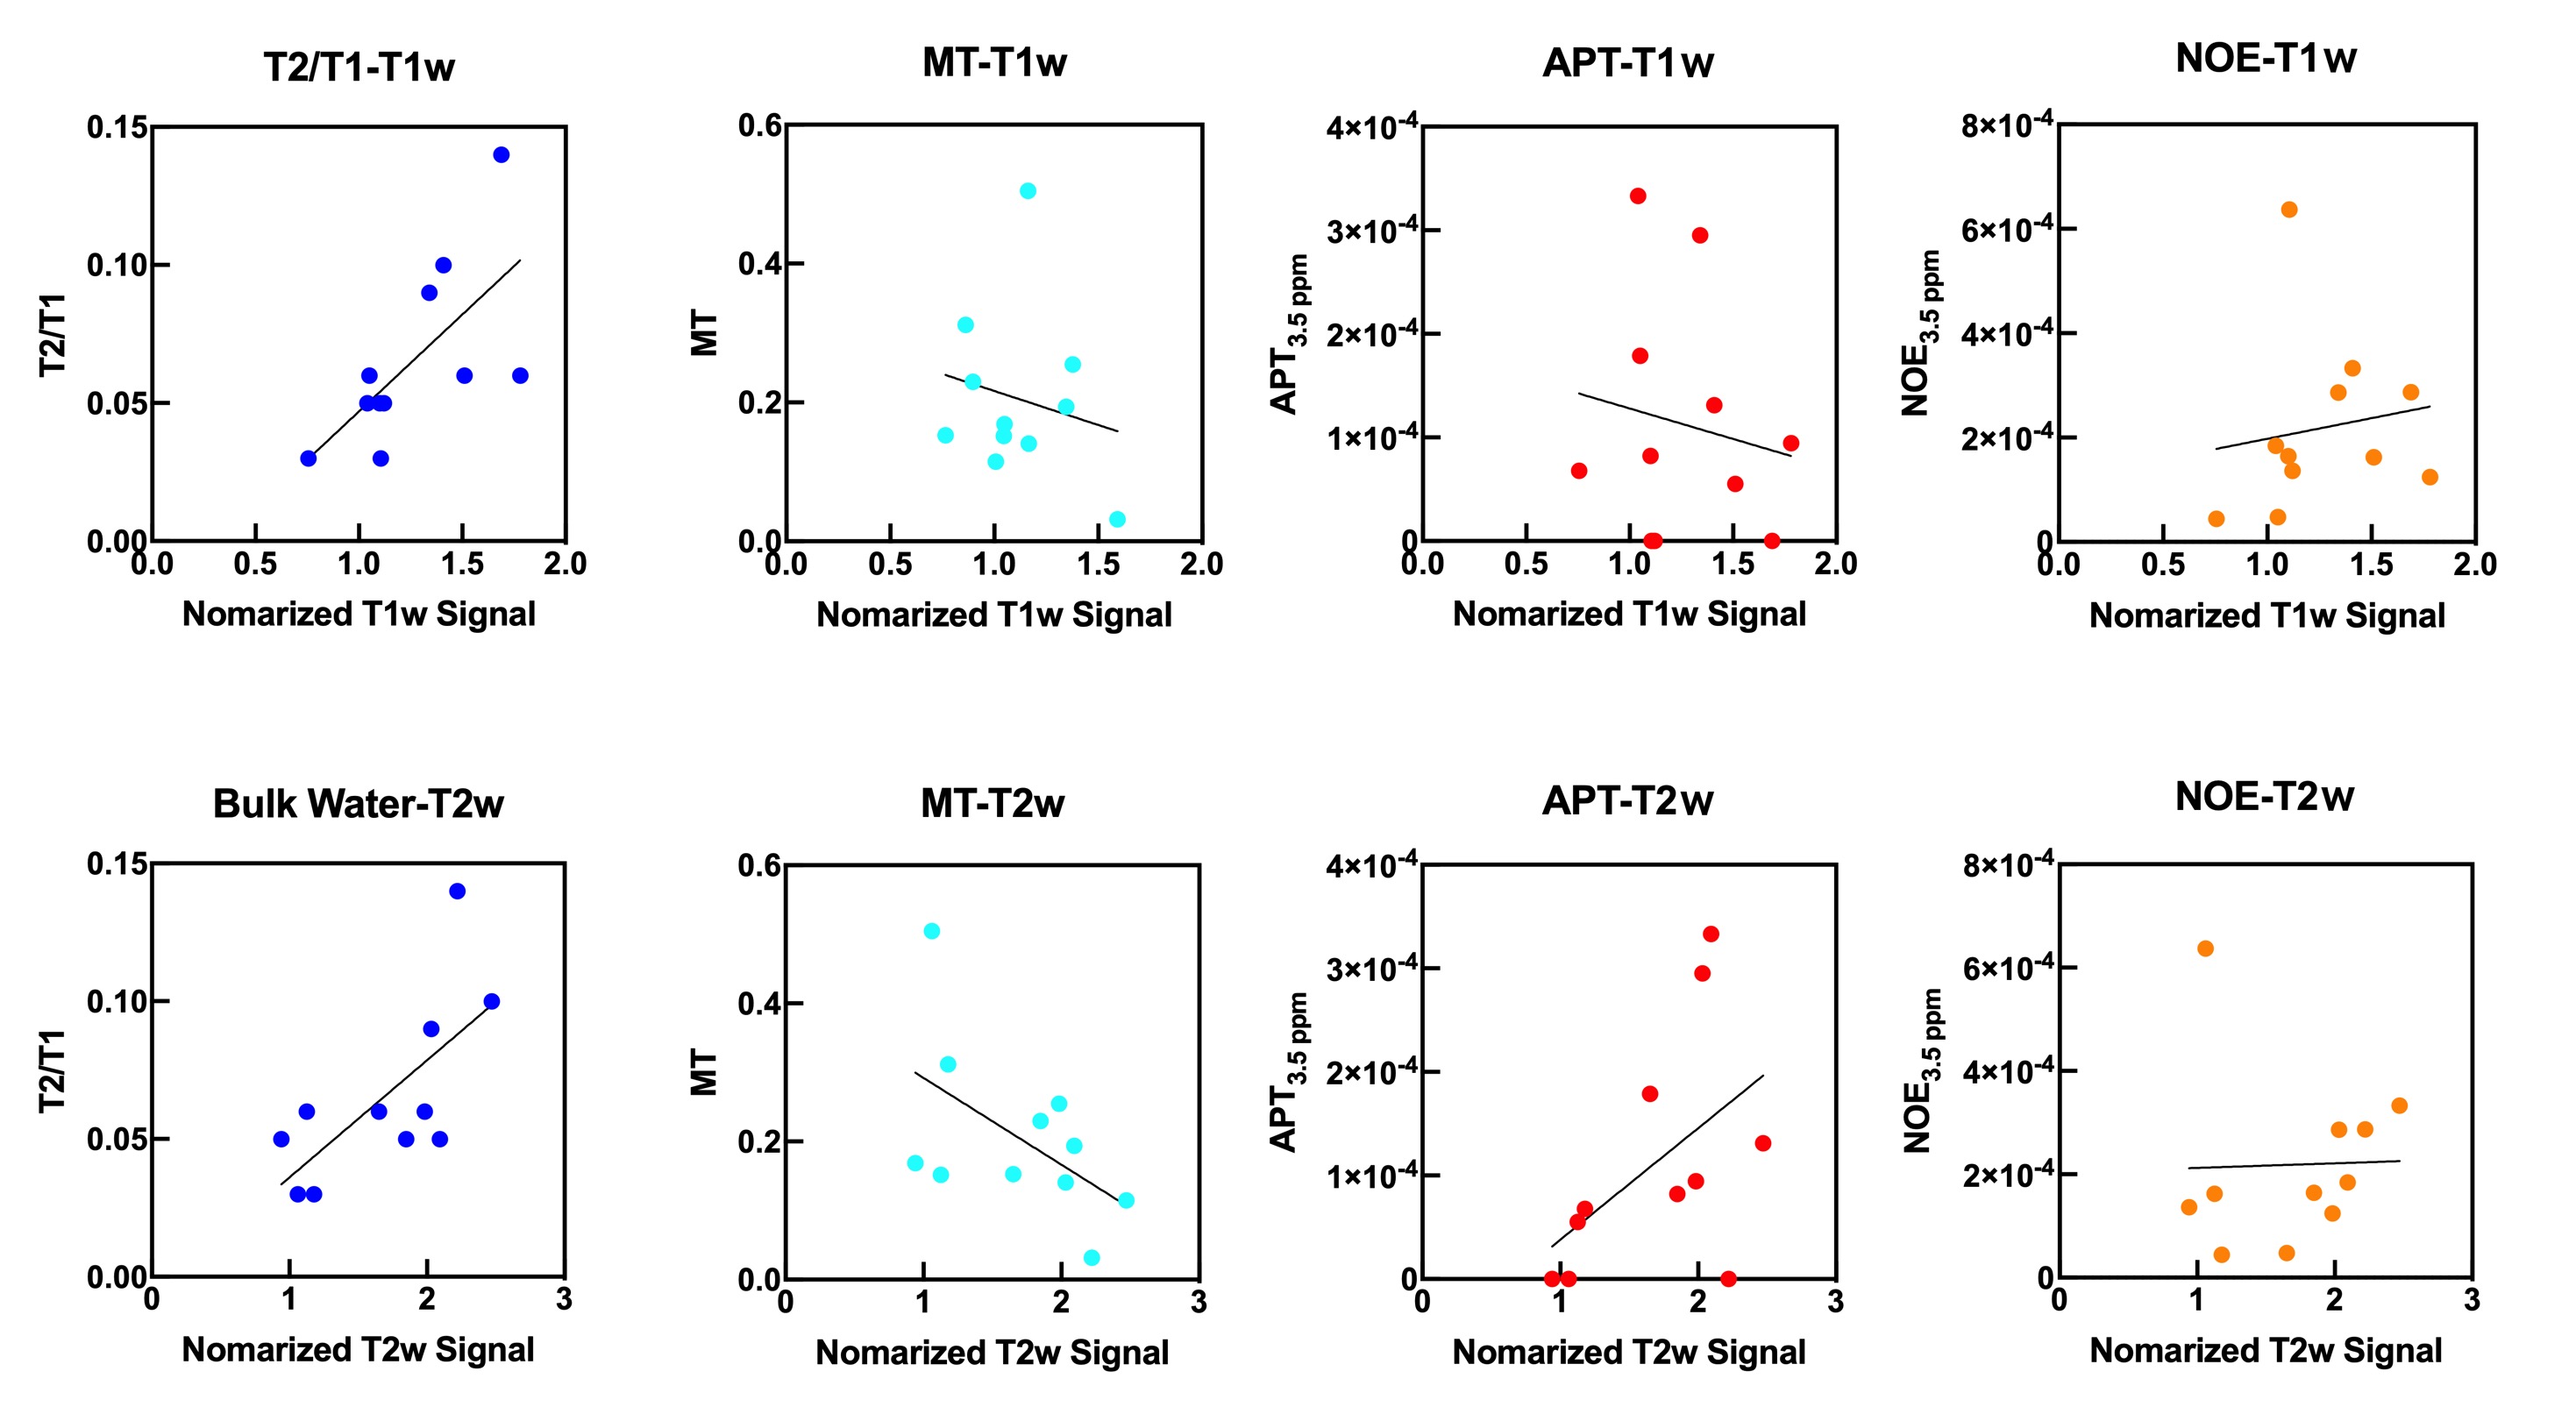
Fig. 2 Violin
plots of measured values of each estimated signal in the plaque regions.
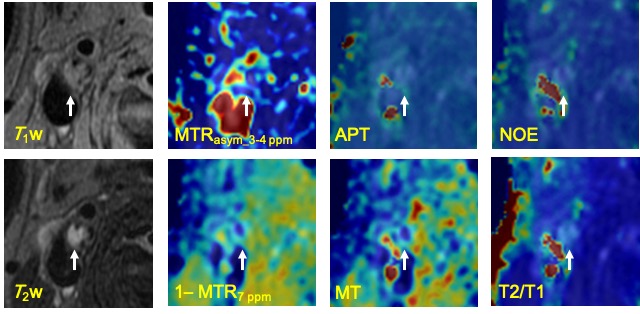
Fig. 3 A 64-year-old male with atherosclerotic plaque (patient
No. 7). White allows indicate plaque lesion.
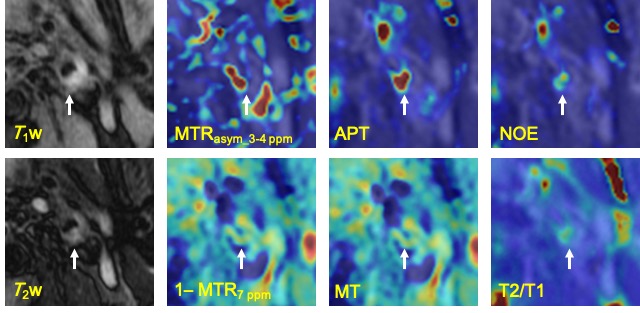
Fig. 4 A 71-year-old male with atherosclerotic plaque
(patient No. 10). White allows indicate plaque lesion.