2127
Quantitative 3D dynamic contrast‐enhanced of Atherosclerosis by using 3D Stack of Star with Golden-angle radial sparse parallel reconstruction1UCAIR, Department of Radiology and Imaging Sciences, University of Utah, Salt Lake City, UT, United States, 2Department of Physics and Astronomy, University of Utah, Salt Lake City, UT, United States, 3Department of Surgery, University of Utah, Salt Lake City, UT, United States, 4VASLCHCS, Salt Lake City, UT, United States, 5Department of Neurology, University of Utah, Salt Lake City, UT, United States
Synopsis
Carotid plaque inflammation can be measured with dynamic contrast enhanced (DCE) MRI and is a marker for plaque instability. Increased vascularity, which is one sign of plaque inflammation, can be detected from kinetic analysis of DCE images However, the trade-off between spatial and temporal resolution limits assessment to a small number of slices and ~15 seconds per time frame. To overcome this limitation, we implemented a short-TR 3D T1w Stack of Stars (SoS) sequence to enable retrospective image formation with arbitrary numbers of radial views by using Golden-angle radial sparse parallel (GRASP) reconstruction.
PURPOSE
Atherosclerosis is one of the most common causes of ischemic stroke1. In histologic studies, plaque enhancement correlates with vasa vasorum neovascularization and macrophages, and contrast leakage may result from endothelial dysfunction or be secondary to intraplaque inflammation and adventitial neovessel rupture2. Increased vascularity, which is one sign of plaque inflammation, can be detected from kinetic analysis of dynamic contrast enhanced (DCE) FLASH images3. However, the trade-off between spatial and temporal resolution limits assessment to a small number of 2D or 3D slices and ~15 seconds per time frame3,4. These methods that simultaneously measure the contrast concentration in the blood pool and plaque either experience saturated blood signal or low plaque SNR. To overcome this limitation, we implemented a short-TR 3D T1w Stack of Stars (SoS) sequence to enable retrospective image formation with arbitrary numbers of undersample radial views by using Golden-angle radial sparse parallel (GRASP) MRI reconstruction.METHODS
We implemented a short-TR 3D T1w SoS sequence with golden angle view order to enable retrospective image formation with arbitrary numbers of views. Acquisition matrix was 192x304x24, resolution 0.8mmx0.8mmx1.5mm, TE/TR=2ms/5ms, 10 total measurements over 372s (32s per measurement). All imaging was performed on Siemens 3T scanners with a 3D radial SoS sequence and using a home built 8-channel carotid coil. After scout scans to locate the vessel regions of interest, 3D DCE SoS scans were acquired continuously for 5 minutes. One minute after the start of the scan, a Gdbased contrast agent (Gadovist; 0.1 mmol/kg) was injected intravenously. For image reconstruction, 19 or 76 spoke per time frame was used, resulting in a temporal footprint of 16 and effective temporal resolution of 2.1 or 8.4s, respectively. Fourier transform was applied on the partition dimension followed by slice-by-slice GRAPPA operator gridding (GROG)5,6 to grid the k-space data on a Cartesian grid. Then a temporally constrained reconstruction7 was employed to reconstruct the image, by minimizing the following cost function:$$m={arg min_{m}}\parallel Am-d\parallel_2^2+λ_t\parallel\sqrt{(∇_t m)^2+ϵ}\parallel_1$$
where d is the GROG interpolated Cartesian k-space, A=DFS is the sampling matrix with S being the sensitivity map, the undersampling mask, and λt =0.03C . The data reconstructed with 16 temporal footprint was used to measure arterial input function(AIF). The data with lower temporal footprint (4 temporal frames per measurement) was used to find the tissue contrast uptake curves and Ktrans calculation.
RESULTS
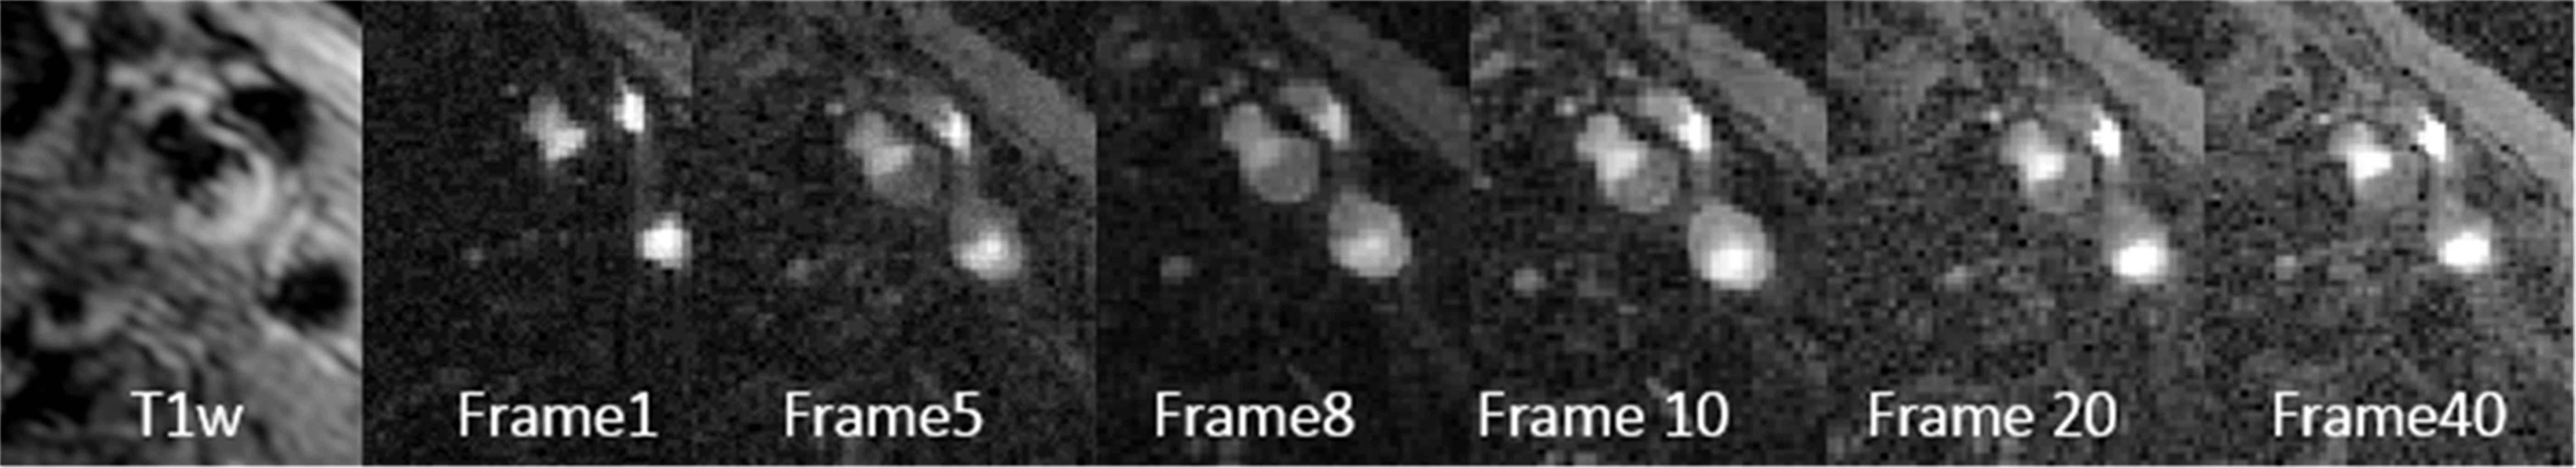
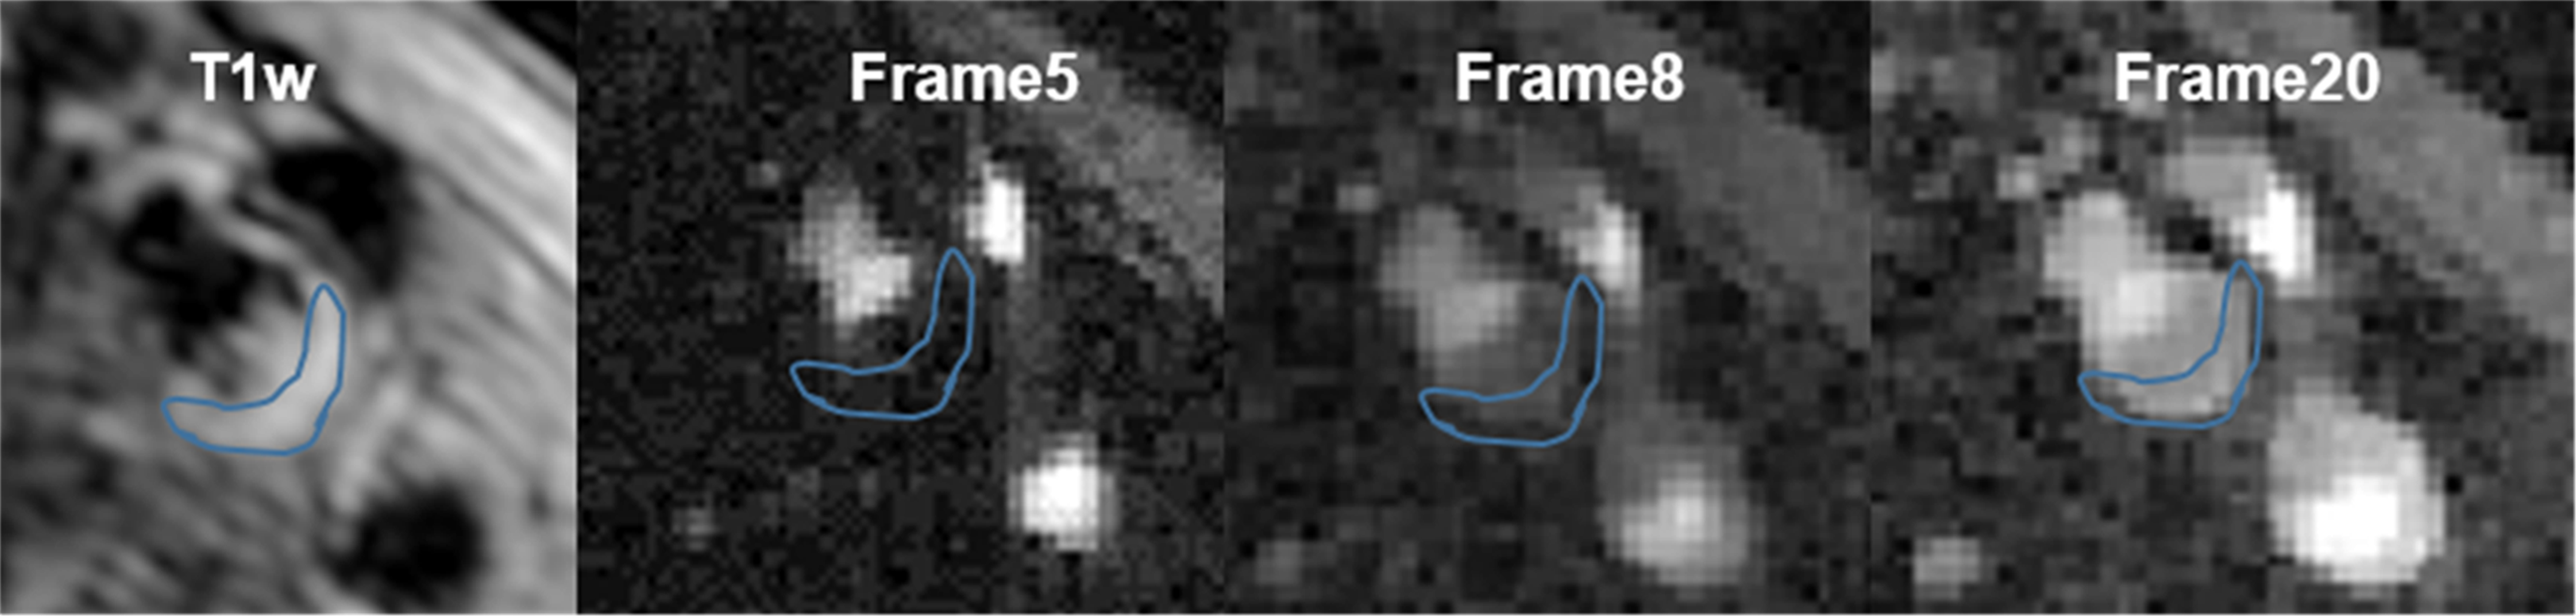
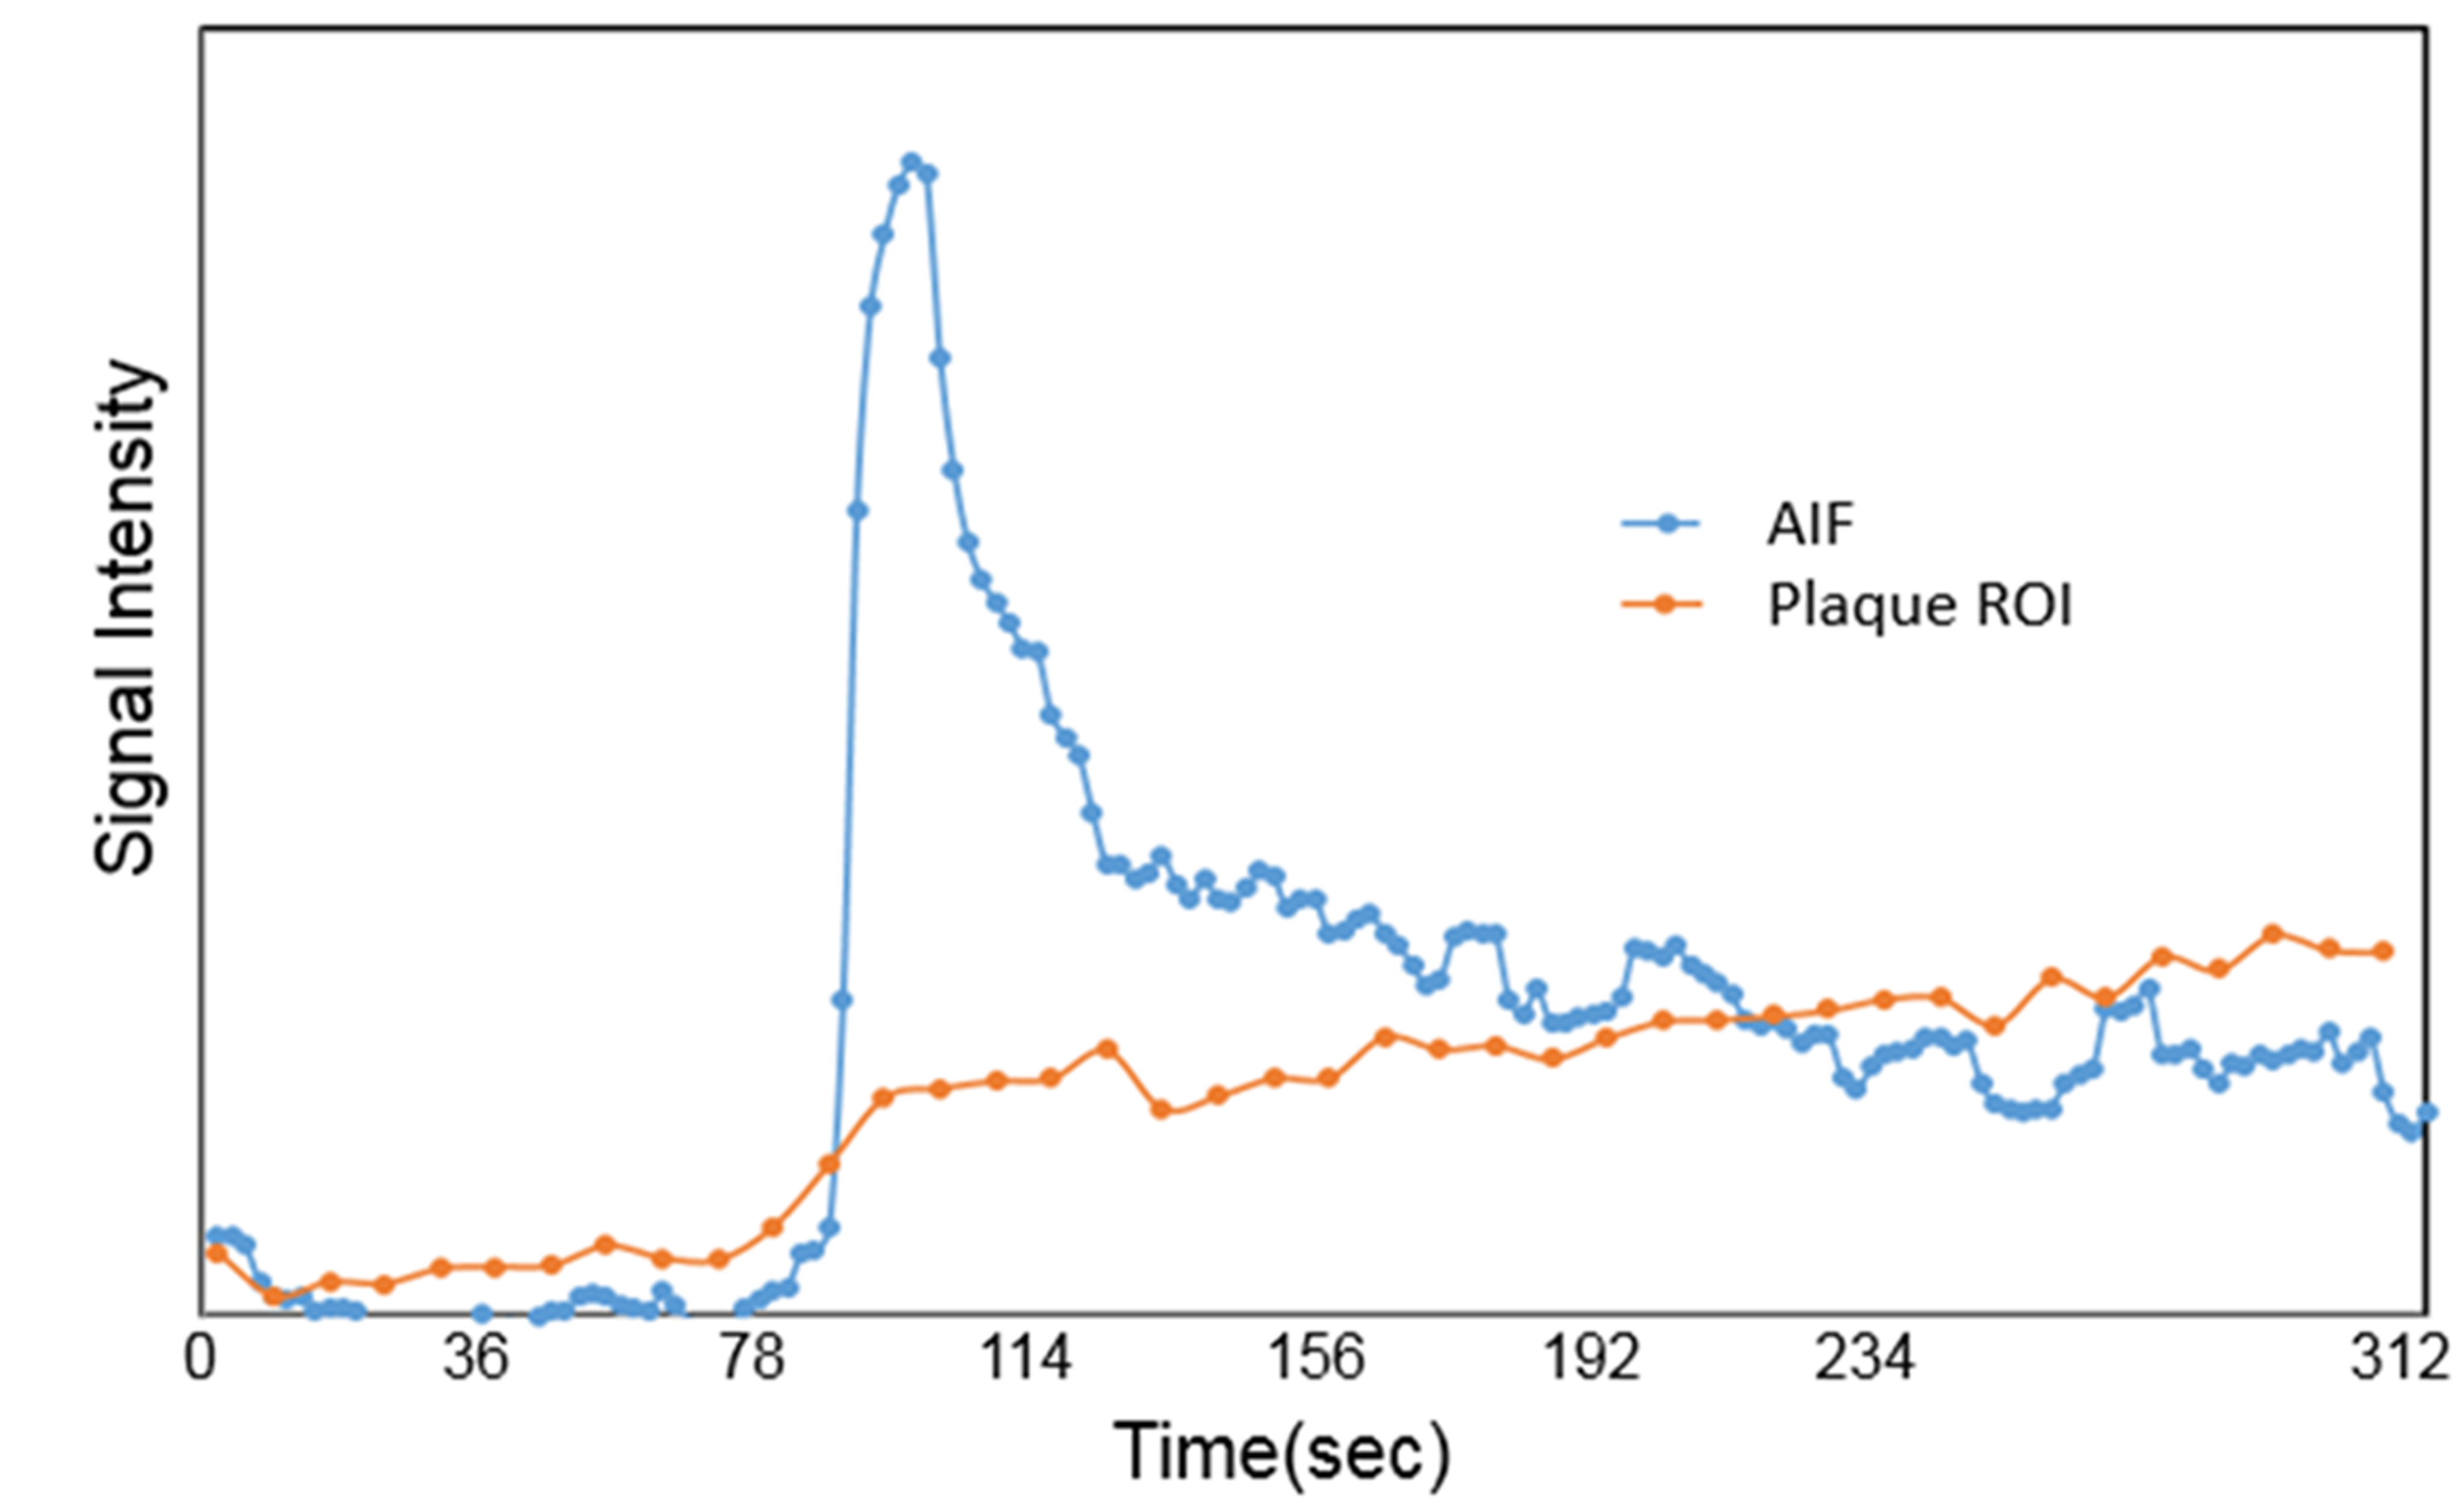
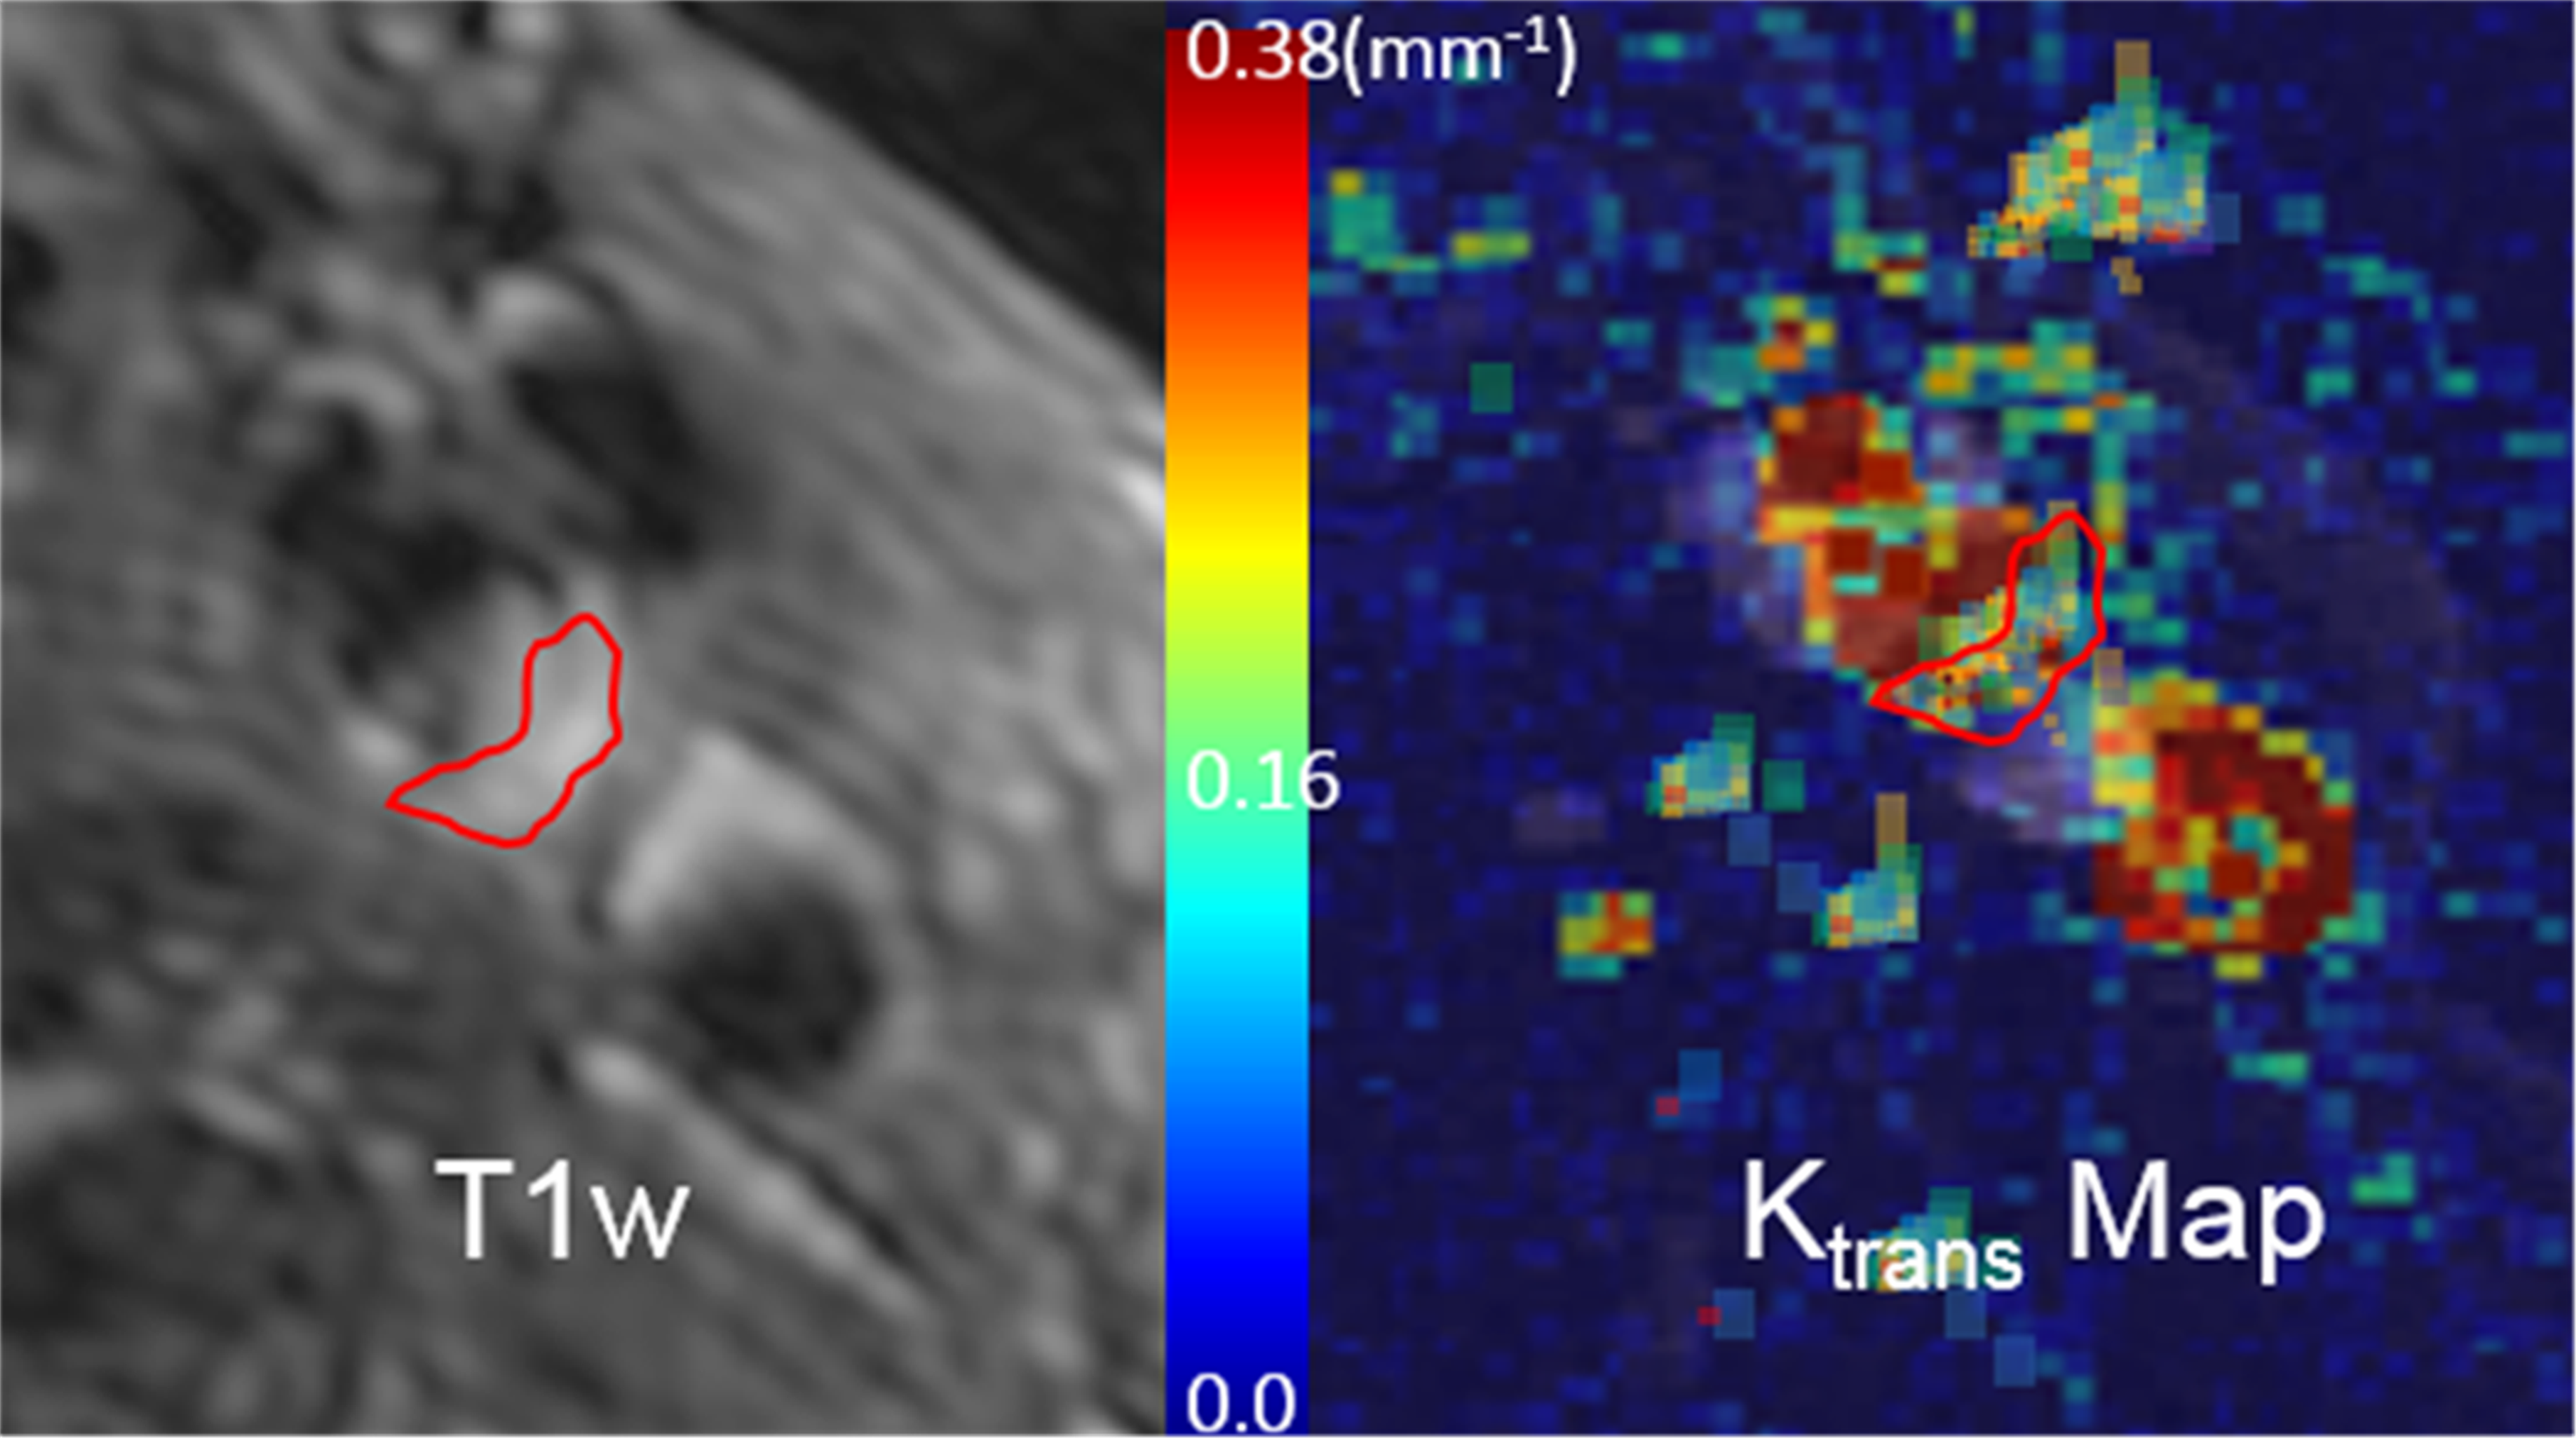
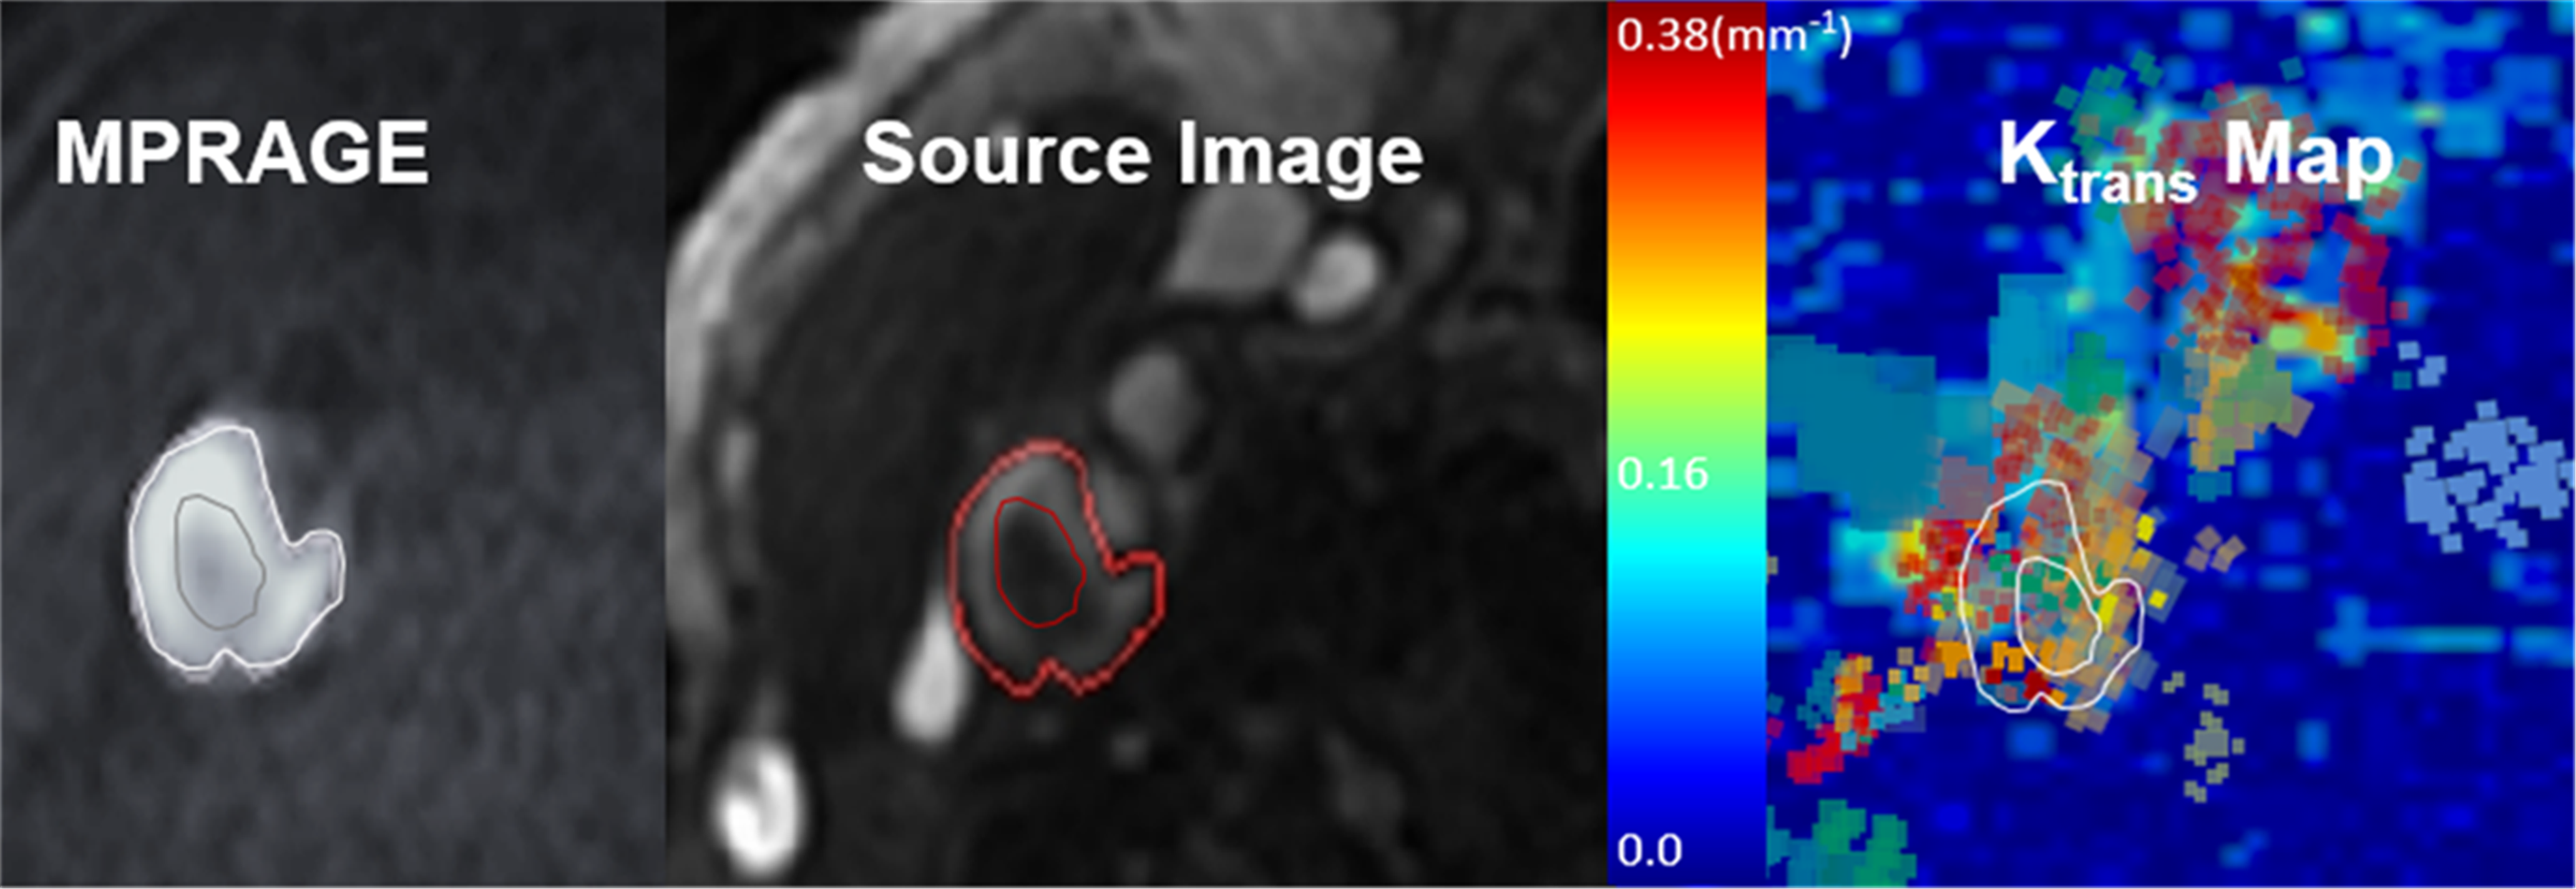
Fig 1 shows reconstructed dynamic DCE source images from a patient with a visible carotid plaque on T1w black blood images. Fig 2 shows static close-ups of atherosclerotic plaque of the same patient. High perfusion in the plaque shown on the blue ROI is apparent from the contrast uptake. Corresponding signal intensity-time curves for AIF and plaque ROIs are shown in Fig 3. The blue line represent arterial input functions from the high temporal reconstruction(1.8 sec time resolution). The orange line corresponds to the signal measured in the area indicated by a blue ROI in.Fig 2. Fig 4 shows the corresponding Ktrans map. Mean Ktrans on the plaque ROI was 0.16±0.08mm-1. Fig 5 demonstrates a Ktrans map of a patient with intraplaque hemorrhage. Mean Ktrans on hemorrhage was 0.21±0.11mm-1.DISCUSSION
3D SoS DCE acquisition provides the high temporal and spatial resolution when combined with a golden angle view ordering. The proposed method can measure the dynamics of contrast uptake in the plaque or possibly adventitia (high spatial resolution, 0.8 mm isotropic voxel dimension) with simultaneous measurement of the AIF (high temporal resolution, 1.8 sec time resolution of 3D DEC) by retrospective GRASP image reconstruction. The high-density central k-space sampling by the SoS sequence can be used to detect and correct motion corrupted measurements to attain accurate, consistent measures of plaque components during DCE acquisition. To improve the accuracy of DCE measurement, we will investigate retrospective data consistency and constrained reconstruction methods to deal with swallowing and other motion-induced artifacts when they occur.CONCLUSION
3D SOS DCE acquisition with GRASP reconstruction may provide a measure of the microvessel surface area and permeability and surrogate for inflammation, which may be more predictive of plaque vulnerability and a better metric to monitor treatment effects compared to visual inspection.Acknowledgements
Supported by R01 HL127582, RSNA Research Scholar Grant RSCH1414, AHA Scientist Development Grant 17SDG33460420, Siemens Medical Solutions, and the Clinical Merit Review Grant from the Veterans Administration health Care System.References
1. Bang OY. Intracranial Atherosclerosis: Current Understanding and Perspectives. J Stroke 2014;16:27–35. Moody AR, Murphy RE, Morgan PS, et al. Characterization of complicated carotid plaque with magnetic resonance direct thrombus imaging in patients with cerebral ischemia. Circulation 2003;107(24):3047-3052.
2. de Havenon A, Chung L, Park M, et al. Intracranial vessel wall MRI: a review of current indications and future applications. Neurovascular Imaging 2016;2(10).
3. Kerwin WS, O’Brien KD, MD, Ferguson MS, BS, et al. Inflammation in Carotid Atherosclerotic Plaque: A Dynamic Contrast-enhanced MR Imaging Study. Radiology 2006: 241(2): 459–468.
4. Calcagno C, Lobatto ME, Dyvorne H, et al. Three‐dimensional dynamic contrast‐enhanced MRI for the accurate, extensive quantification of microvascular permeability in atherosclerotic plaques. NMR Biomed. 2015;28:1304–1314.
5. Benkert T, Tian Y, Huang C, DiBella EVR, et al. Optimization and validation of accelerated golden-angle radial sparse MRI reconstruction with self-calibrating GRAPPA operator gridding. Magn Reson Med 2018;80(1):286-293.
6. Tian Y, Erb KC, Adluru G, et al. Technical Note: Evaluation of pre-reconstruction interpolation methods for iterative reconstruction of radial k-space data. Med Phys 2017;44(8):4025-4034.
7. Adluru G, Awate SP, Tasdizen T, Temporally constrained reconstruction of dynamic cardiac perfusion MRI. Magn Reson Med 2007;57(6):1027-1036.
Figures