2126
Black-blood 3D DCE-MRI of the aortic wall with AIF-free pharmacokinetic modeling: feasibility in abdominal aortic aneurysm patients1Department of Biomedical Engineering and Physics, Amsterdam University Medical Centers, University of Amsterdam, Amsterdam, Netherlands, 2The BioMedical Engineering and Imaging Institute, Icahn School of Medicine at Mount Sinai, New York, NY, United States, 3Department of Surgery, Amsterdam University Medical Centers, University of Amsterdam, Amsterdam, Netherlands, 4Department of Vascular Surgery, Amsterdam University Medical Centers, University of Amsterdam, Amsterdam, Netherlands, 5Department of Radiology and Nuclear Medicine, Amsterdam University Medical Centers, University of Amsterdam, Amsterdam, Netherlands
Synopsis
We introduced 3D black-blood DCE MRI in combination with AIF-free modeling to facilitate the measurement of pharmacokinetic parameters in the aorta vessel wall of patients with an abdominal aortic aneurysm. Our method enables 3D assessment of microvascularization and permeability which could assist a clinical risk assessment of this condition.
Introduction
Dynamic contrast-enhanced (DCE) magnetic resonance imaging (MRI) has been developed into a powerful tool for the quantification of microvascularization and permeability. When applied to vessel wall imaging, such as atherosclerotic plaques and abdominal aortic aneurysms (AAA), a black-blood sequence is preferred, since a very bright lumen signal can partly conceal perfusion regions or cause artefacts related to blood motion. A volumetric highly-accelerated vessel-wall black-blood DCE-MRI protocol was previously succesfully demonstrated [1]. In order to derive pharmacokinetic (PK) parameters one generally needs the arterial input function (AIF). The AIF can be measured in combination with black-blood DCE by interleaved bright/black blood sequences. However, these are time-inefficient and complicate signal behavior. Unfortunately, the absence of a patient-specific arterial input function (AIF) prevents most pharmacokinetic modeling approaches. Moreover, many AIF-free alternatives are not valid for highly vascularized regions. To overcome these issues, we propose the use of an AIF-free black-blood DCE method and PK modeling employing the novel Constrained Extended Reference Region Model (CERRM) [2], which can model the plasma fraction. This model uses the concentration curve in a muscle reference region and uses this to solve a reformulation of the Toft’s model. Instead of absolute values, the resulting PK parameters are relative to those of the reference region. We have combined these methods and have included additional fit constraints to prevent unphysical solutions. To demonstrate the feasibility of our new approach, we performed DCE measurements in AAA patients. A scan-rescan study was performed to analyze the reproducibility of the sequence-analysis pipeline.Methods
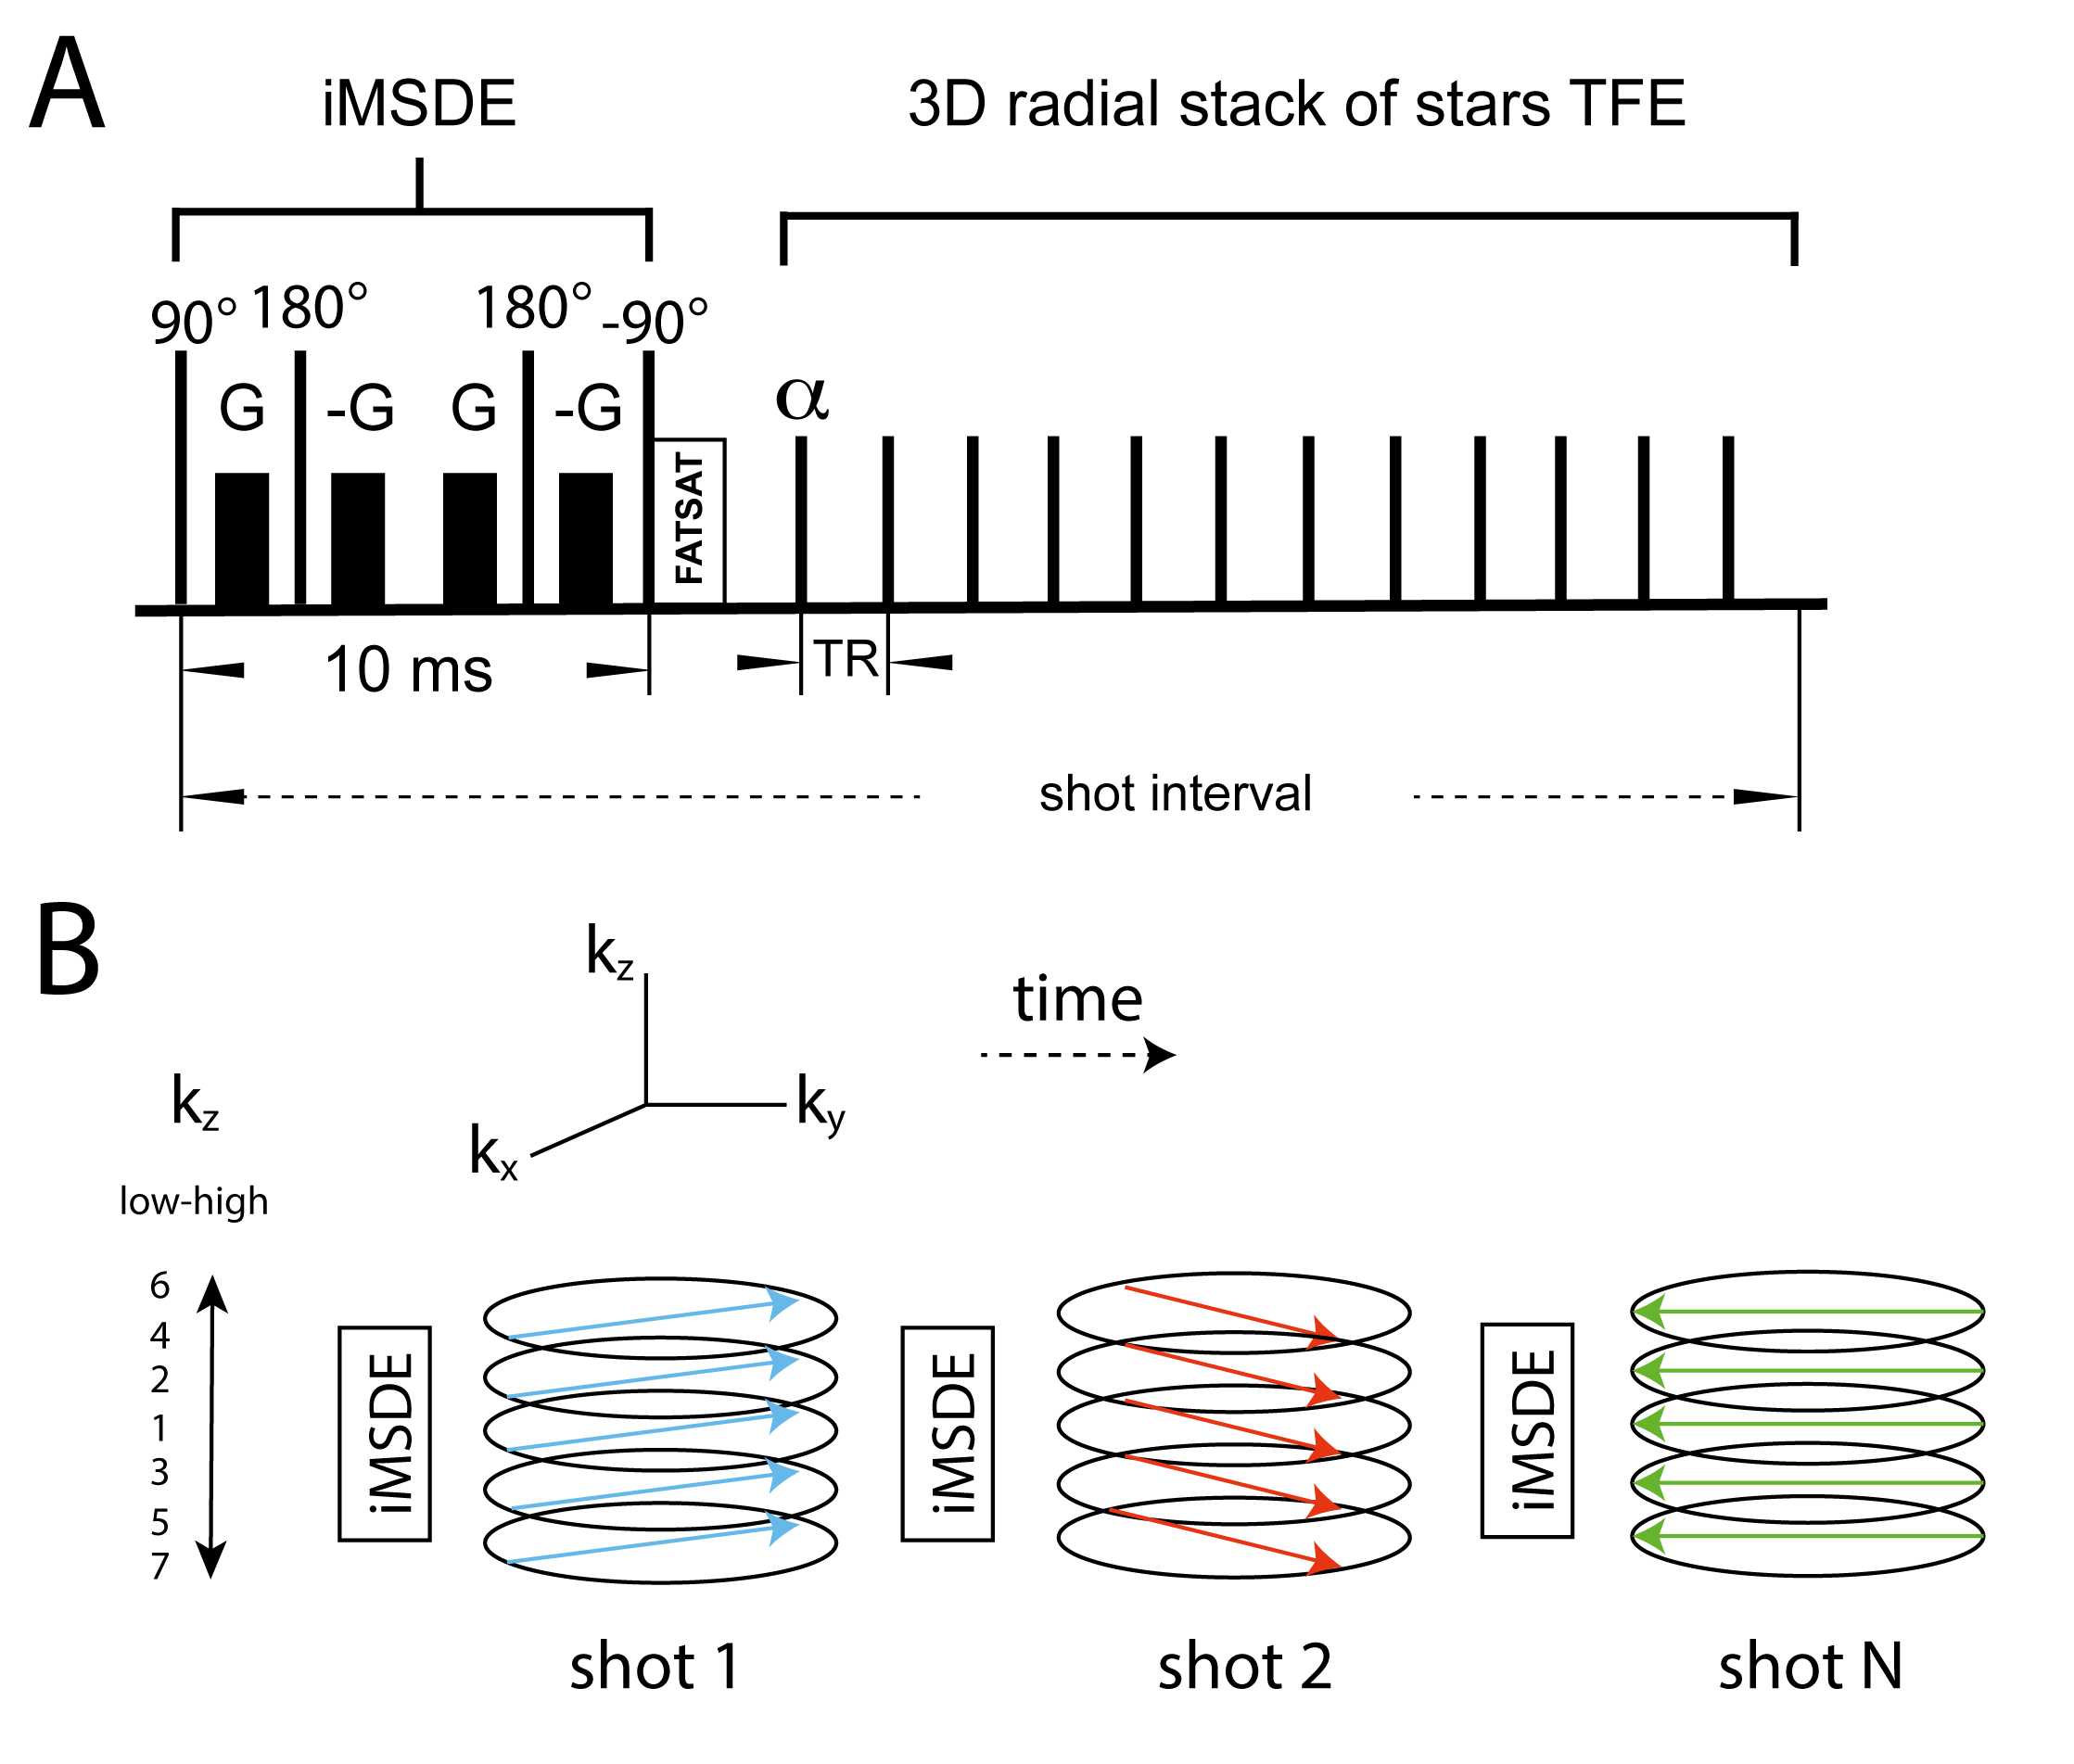
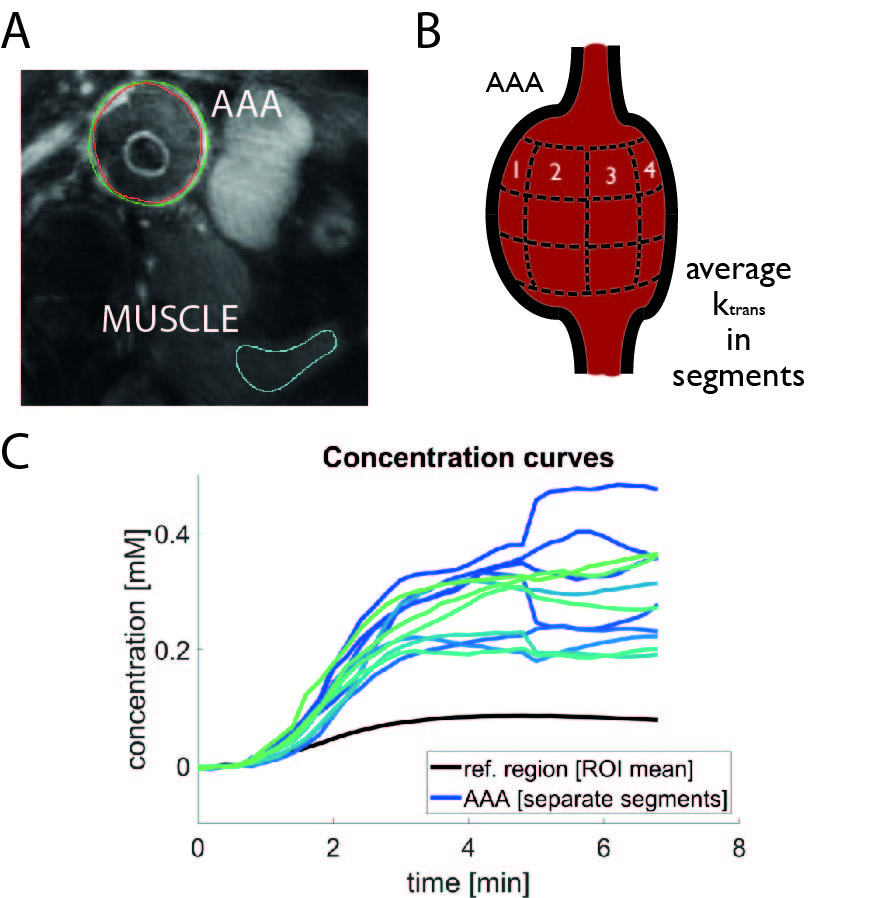
All scans were performed with a 3T Philips Ingenia system. Four patients with an AAA underwent a DCE-protocol with injection of Gadolinium (Magnevist). A 3D golden-angle stack-of-stars TFE with iMSDE (improved motion-sensitized driven equilibrium) black-blood preparation was performed (Fig. 1). To assess reproducibility, a second scan was performed around one week after the first. Further scan parameter were: FA=11°; TE/TR = 3.5/7.4 ms; TFE-factor = 35 resolution=1/1/2 mm3; temporal resolution=11 s/frame; total scan-time=10 minutes. A compressed sensing reconstruction [3] was used with a temporal total-variation constraint (lambda = 0.1). Reconstructions were performed on a workstation with 2 NVIDIA Tesla P100 GPUs. The AAA vessel walls and a muscle region were manually segmented (Fig. 2) in VesselMASS (Leiden University, the Netherlands). CERRM analysis was performed in Matlab (Mathworks, USA) and Python. Signal intensity curves were converted to concentration curves using the signal model described in [4]. Pre-contrast vessel-wall T1 and T2 values were fixed in the model. The voxel-wise ktrans, ref maps were divided into three parts in the foot-head direction, and 12 parts in the circular direction centered around the centroid of the segmentation (Fig. 2). The mean in these subdivided regions was compared one-to-one between scan and rescan. Subsequently, coefficients of variation (CoV) were calculated.PK-model
The original CERRM method [2] is a least-squares solution of Ax=b, where A contains the signal concentration and B is a matrix containing integrals of the muscle and signal-of-interest concentrations. x is a vector containing linear combinations of the PK parameters. However, the global solution to this problem may result in unphysical (negative) values for Ktrans. To prevent this, we introduce additional constraints to this model, and solve it by minimization of an l2 norm:$$ \text{min} |A x - b|_2^2 \text{ subject to } k_{ep,rr} > 0 $$
It can be shown that this constraint can be expressed by the following relation between the elements of x:
$$ \text{min} |A x - b|_2^2 \text{ subject to } x_1^2 > 4 x_2 x_3$$
Similarly, in the second step of [2] we added additional constraints:
$$ \text{min} |G y - b|_2^2 \text{ subject to } y_1 > y_2 y_3$$
Results & discussion
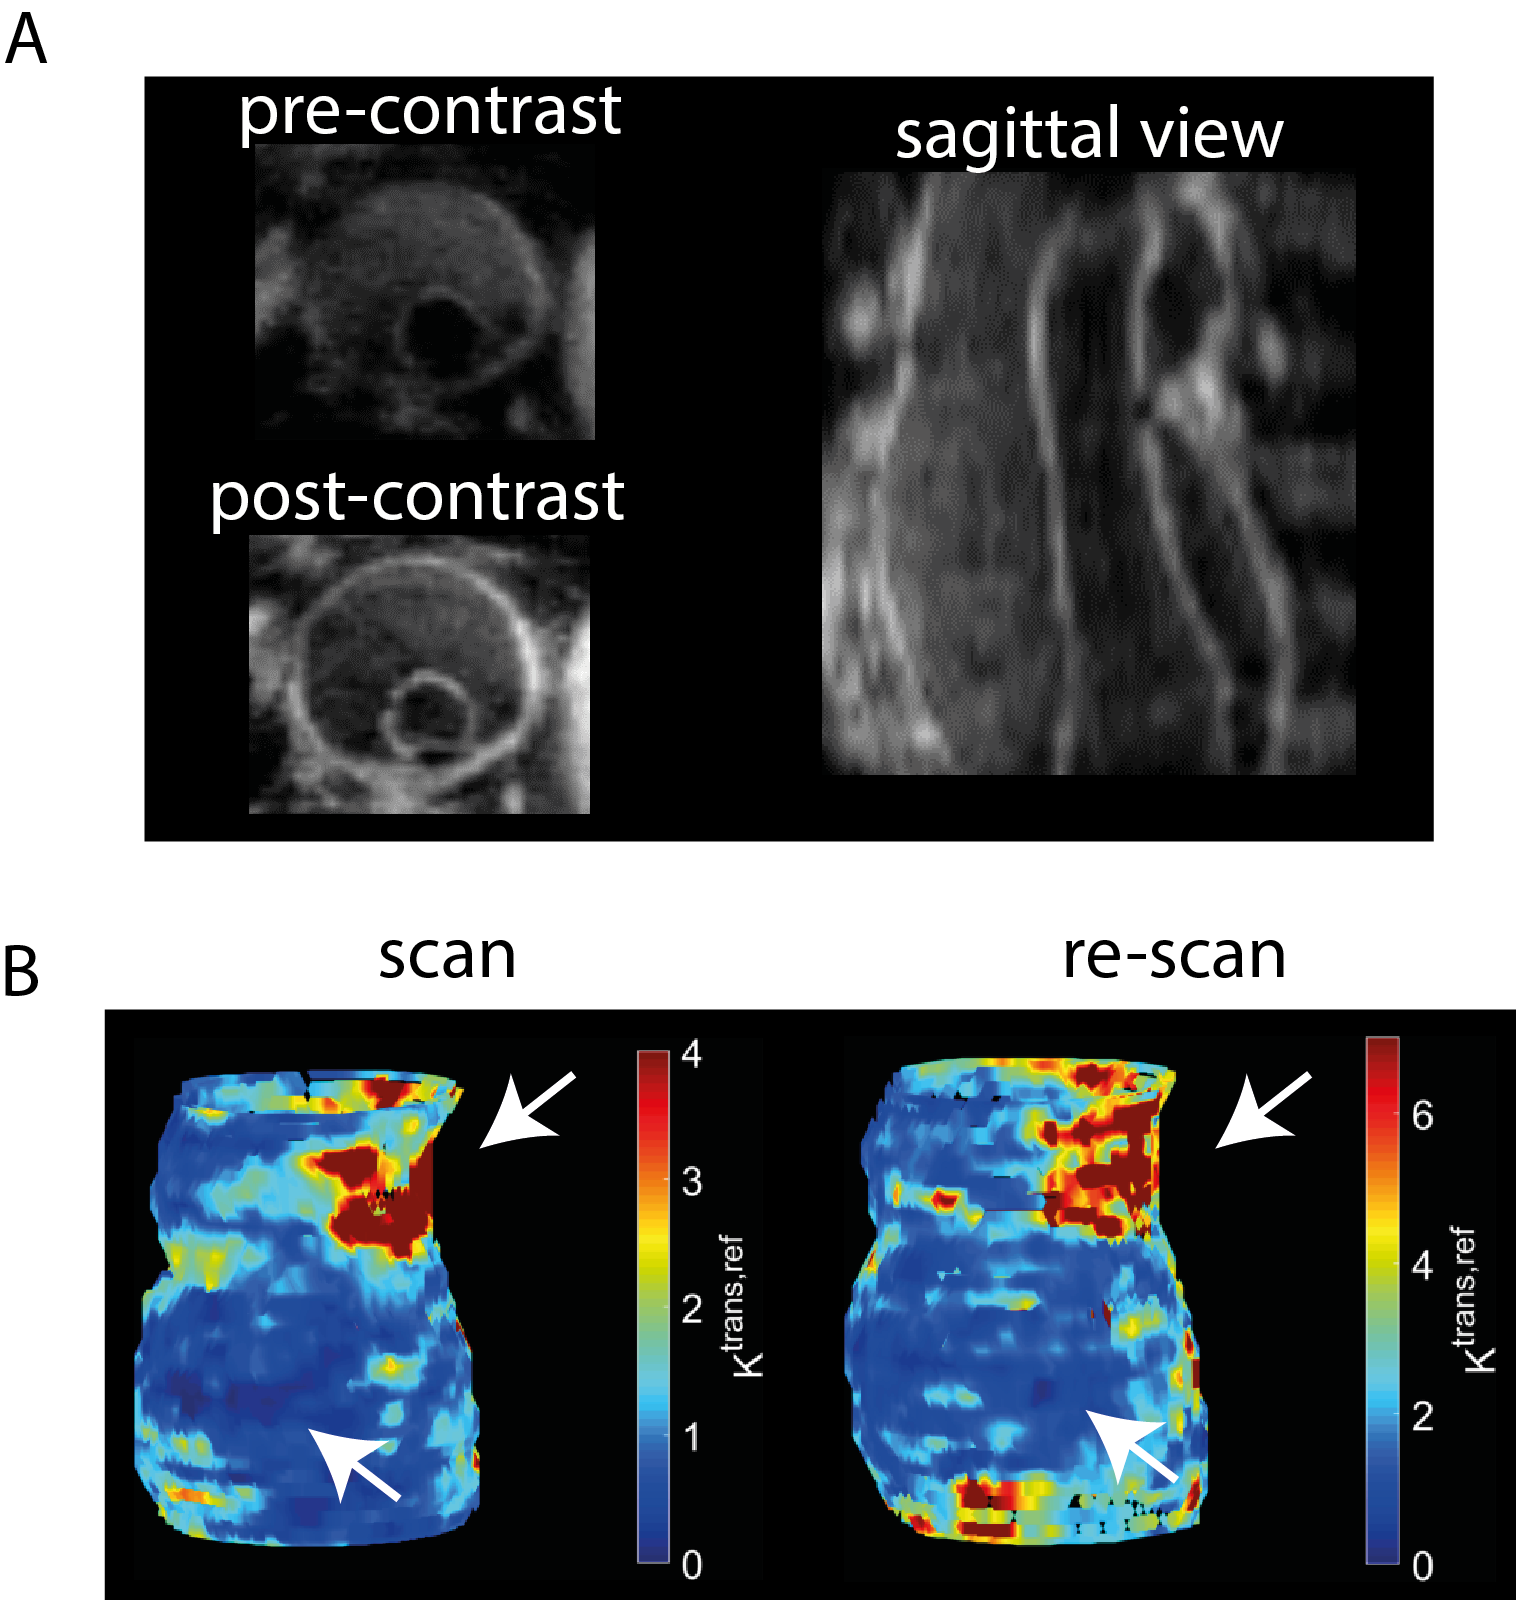
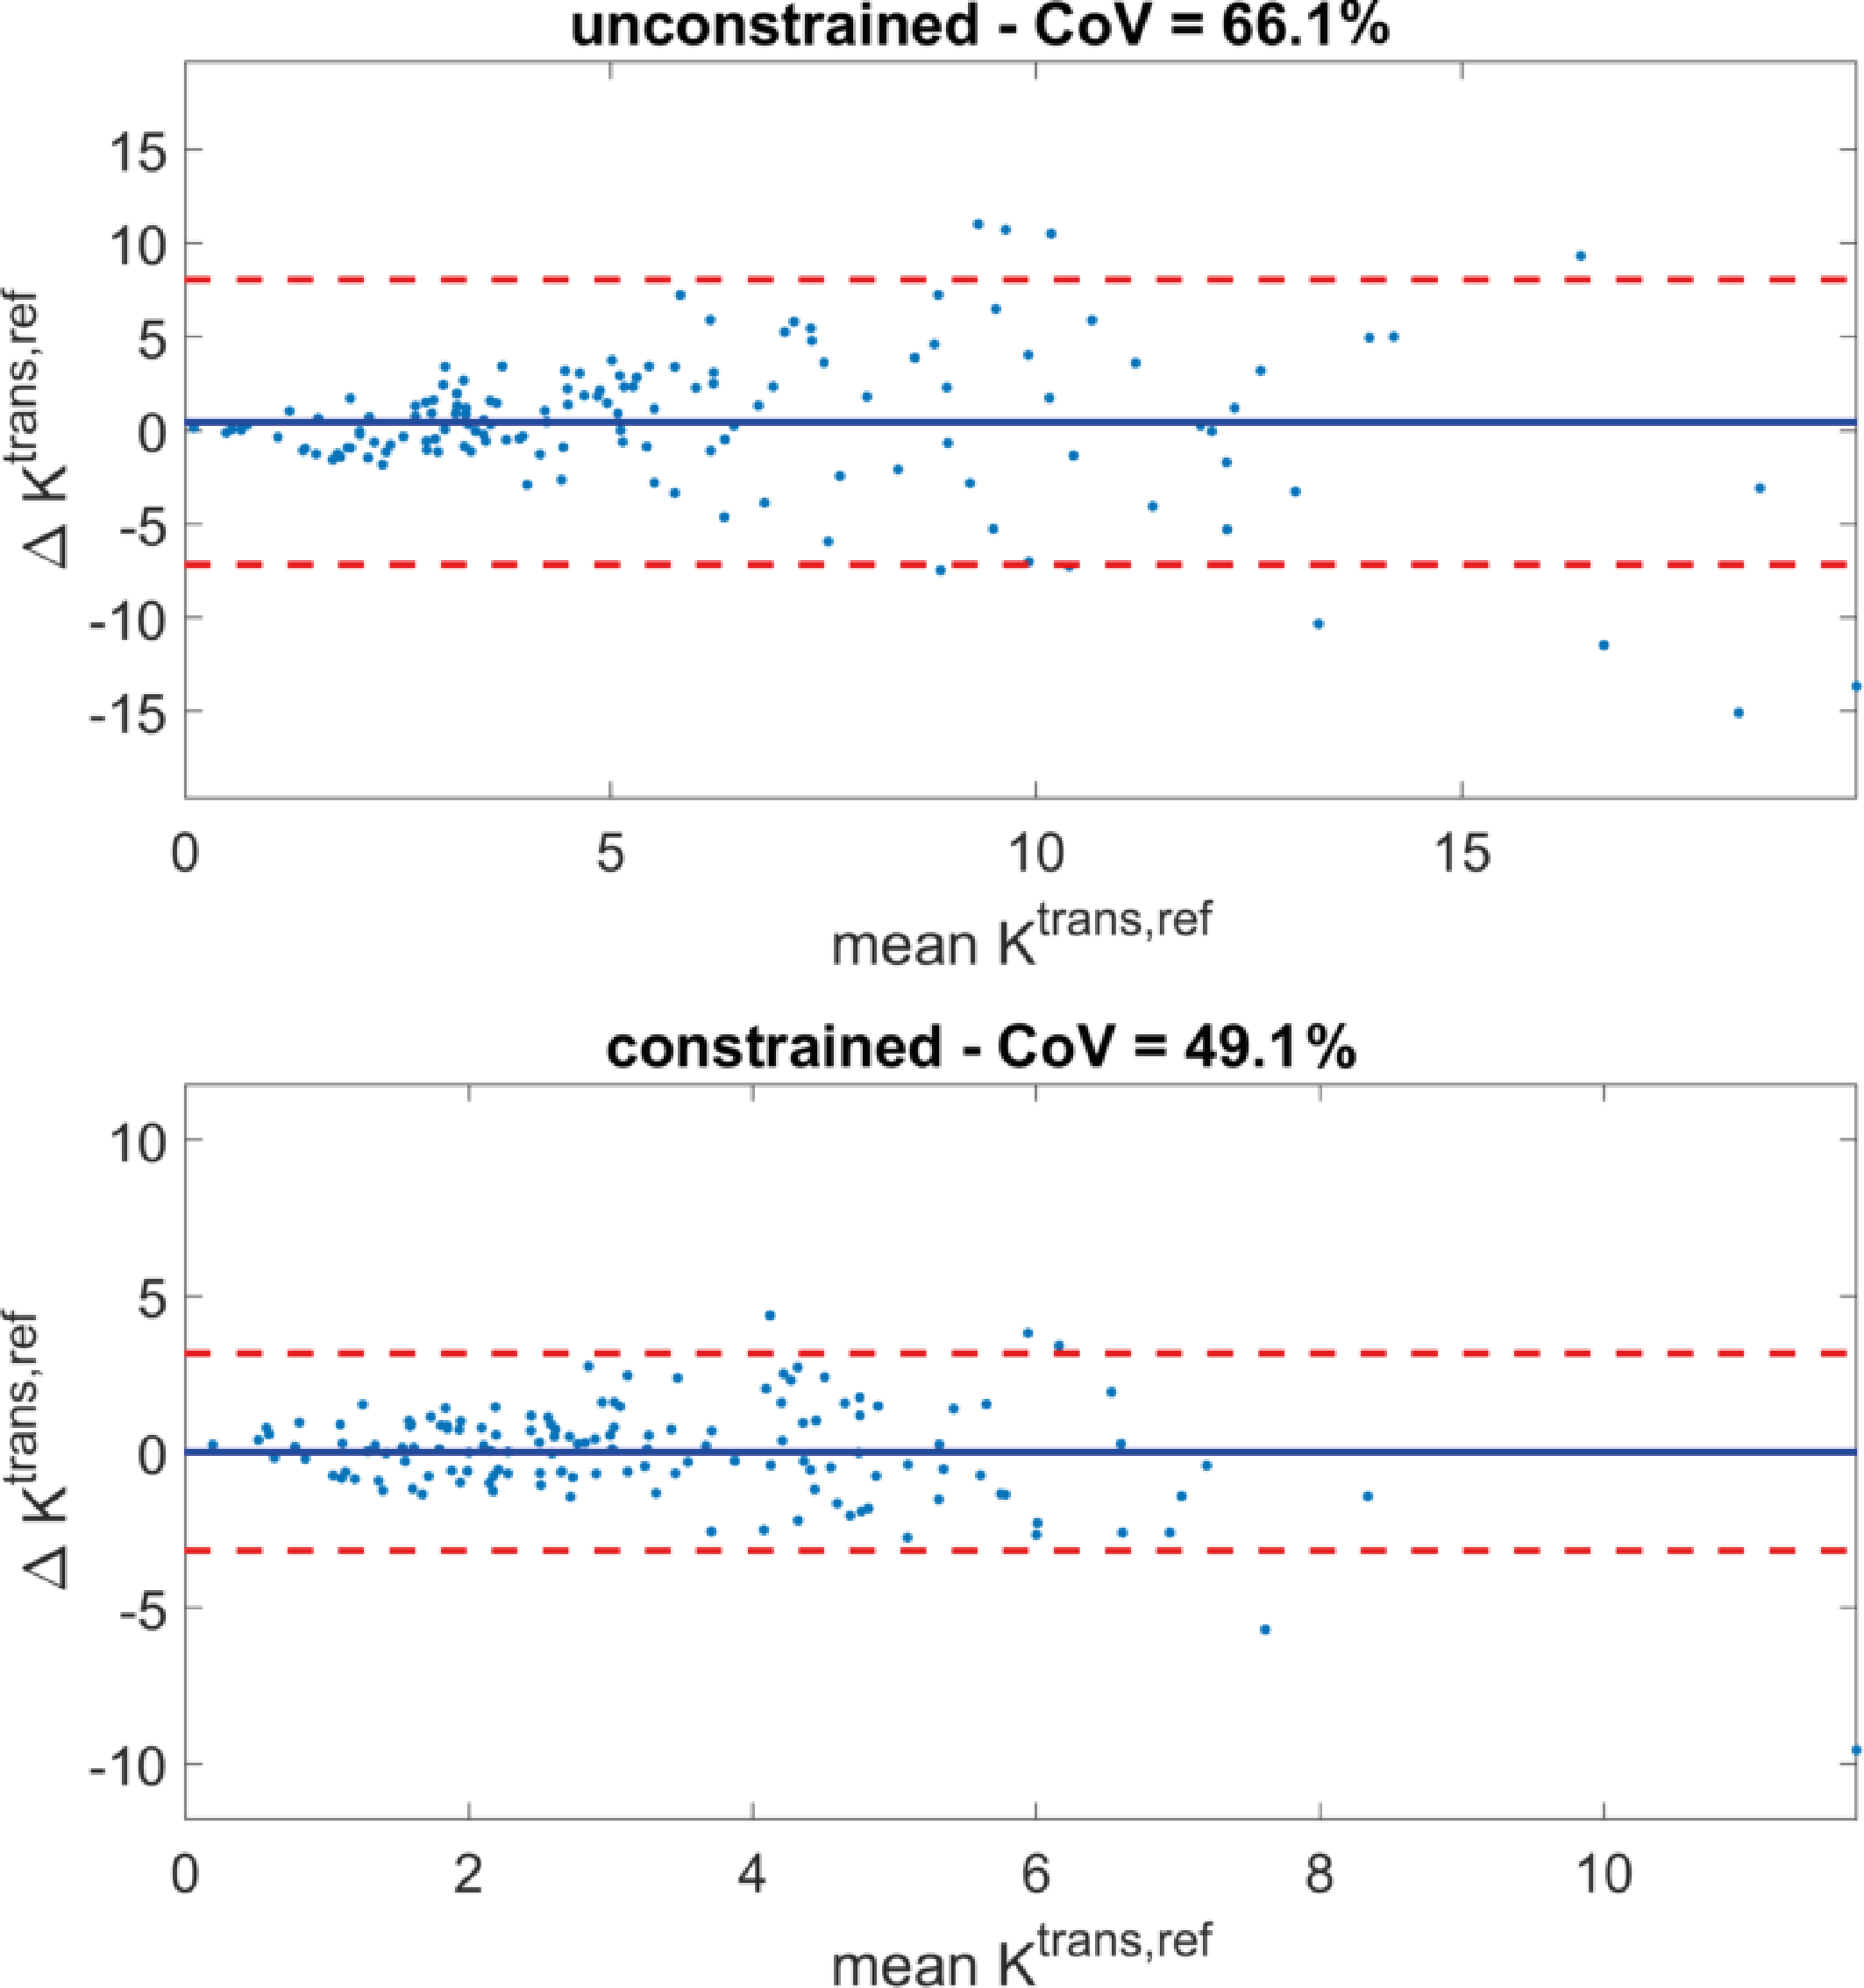
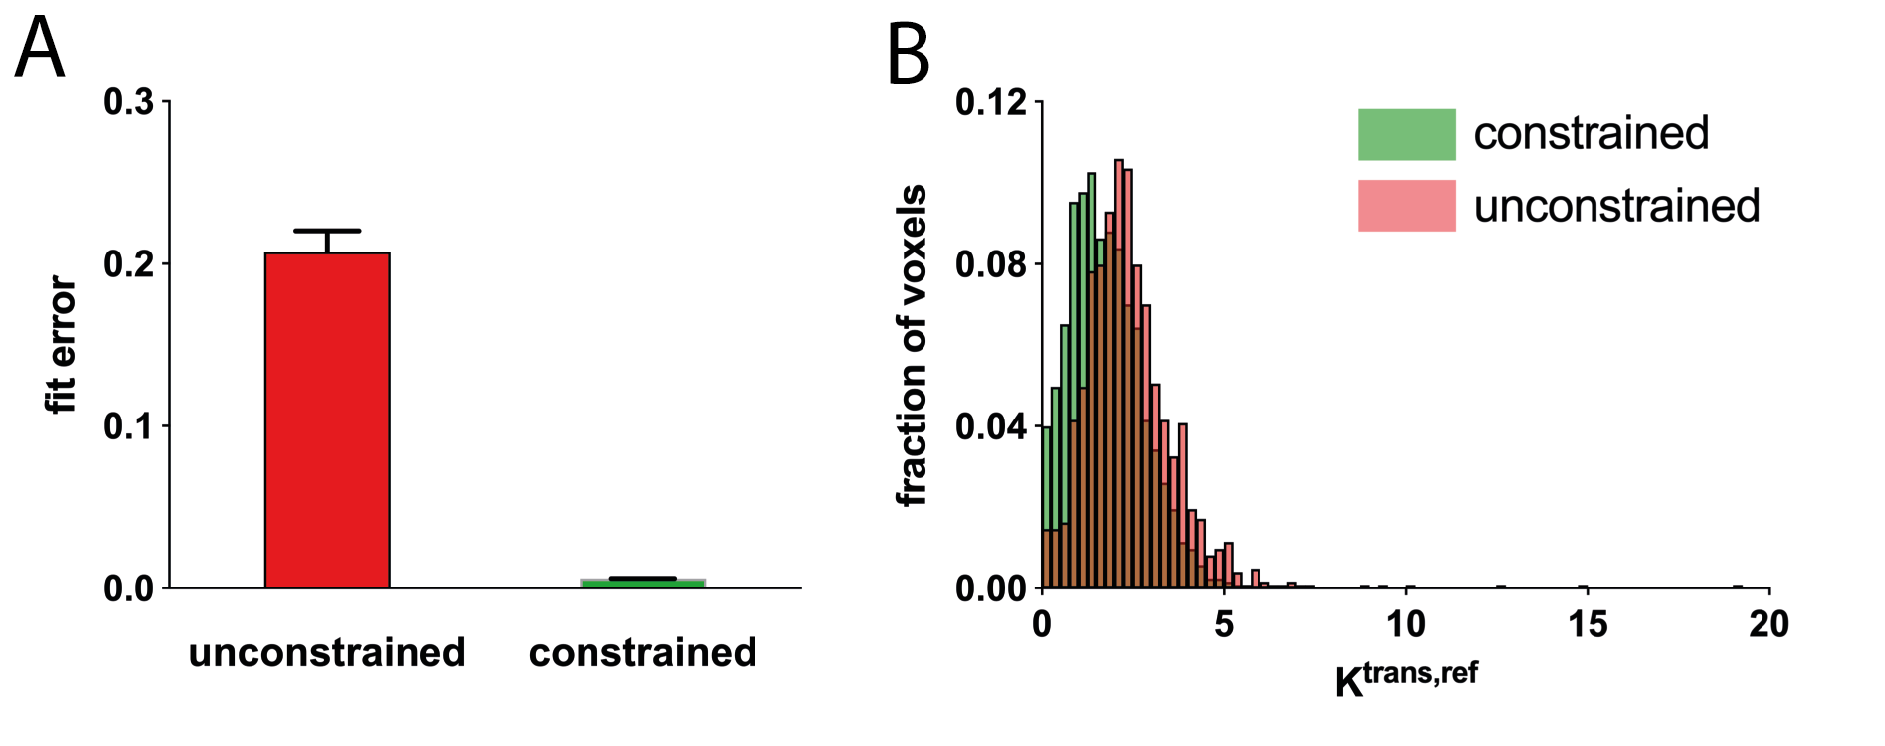
Fig. 3A shows pre- and post-contrast DCE images of the AAA of one patient. Regions of lower and higher enhancement can be clearly identified. A voxelwise Ktrans,ref map of both the scan and rescan (Fig. 3B) shows good spatial correspondence of the high and the low enhancement regions. The constrained fit lowers the CoV from 66% to 49%, it also removes the bias (Fig. 4). Additionally, the constraint has removed unphysical values entirely (negative Ktrans, negative Ve, Vp). Also, the fit cost has substantially lowered, while the overall Ktrans,ref distribution is similar (Fig. 5). Nguyen [5] found a AAA scan-rescan CoV of 38% in a 2D bright-blood sequence with a Patlak fit. We found a CoV that is slightly lower. We think this is due to mis-registration between scan and rescan which could be improved by elastric registration.Conclusion
We introduced 3D black-blood DCE MRI in combination with AIF-free modeling to facilitate the measurement of pharmacokinetic parameters in the aorta vessel wall of patients with an abdominal aortic aneurysm. Our method enables 3D assessment of microvascularization and permeability which could assist a clinical risk assessment of this condition.Acknowledgements
No acknowledgement found.References
[1] J. Schoormans, K. Zheng, E. Stroes, G. Strijkers, A. Nederveen, and B. Coolen, “3D Black-Blood DCE-MRI Using Radial Stack-Of-Stars Acquisition and CS Reconstruction: Application in Carotid and Femoral Arteries,” in Proceedings of the Annual Meeting of the ISMRM, 2017.
[2] Z. Ahmed and I. R. Levesque, “An extended reference region model for DCE-MRI that accounts for plasma volume,” NMR Biomed., vol. 31, no. 7, pp. 1–13, 2018.
[3] L. Feng, L. Axel, H. Chandarana, K. T. Block, D. K. Sodickson, and R. Otazo, “XD-GRASP: Golden-angle radial MRI with reconstruction of extra motion-state dimensions using compressed sensing,” Magn. Reson. Med., vol. 75, no. 2, pp. 775–788, 2016.
[4] H. Qi, F. Huang, Z. Zhou, P. Koken, N. Balu, B. Zhang, C. Yuan, and H. Chen, “Large coverage black-bright blood interleaved imaging sequence (LaBBI) for 3D dynamic contrast-enhanced MRI of vessel wall,” Magn. Reson. Med., vol. 79, no. 3, pp. 1334–1344, 2018.
[5] V. L. Nguyen, M. E. Kooi, W. H. Backes, R. H. M. van Hoof, A. E. C. M. Saris, M. C. J. Wishaupt, F. A. M. V. I. Hellenthal, R. J. van der Geest, A. G. H. Kessels, G. W. H. Schurink, and T. Leiner, “Suitability of Pharmacokinetic Models for Dynamic Contrast-Enhanced MRI of Abdominal Aortic Aneurysm Vessel Wall: A Comparison,” PLoS One, vol. 8, no. 10, pp. 6–12, 2013.
Figures