2123
Quantitative T1 and T2* mapping for atherosclerotic carotid plaque using multi-echo phase-sensitive inversion recovery sequence1Department of Medical Image Sciences, Faculty of Life Sciences, Kumamoto University, Kumamoto, Japan, 2Department of Radiology, Fukuoka University Chikushi Hospital, Chikushi, Japan
Synopsis
The purpose of this study was to investigate the correlation between the T1 value of carotid plaque and signal intensity ratio and to evaluate the clinical usefulness of T1 and T2* values for carotid plaque. Quantitative T1 and T2* mapping using mPSIR have potential to improve the diagnostic accuracy of vulnerability of carotid atherosclerotic plaque.
Introduction
Black-blood MR imaging is widely used to assess the vulnerability of atherosclerotic carotid plaque and predict the risk of development of the ischemic cerebrovascular disease. Evaluation of the vulnerability is mainly based on signal intensity ratio (SIR) between the plaque and surrounding muscles, using 2D T1-weighted images. However, changes in SIR depend not only on properties of the carotid plaque but also on the imaging sequence and parameters. Therefore, a quantitative evaluation technique is needed. In addition, the usefulness of risk assessment by T2* value of the plaque has also been reported.Recently, we reported that 3D multi-echo phase-sensitive inversion recovery sequence (mPSIR) can accurately estimate T1 and T2* values of the carotid wall.
The purpose of this study was to investigate the correlation between the T1 value of carotid plaque and SIR and to evaluate the clinical usefulness of T1 and T2* values for carotid plaque.
Materials and Methods
The study was performed using a 3.0T MRI system (Ingenia; Philips Healthcare, The Netherlands) with a head-neck receive array coil. The study protocol was approved by the Institutional Review Board of the Fukuoka University of Chikushi Hospital. We prospectively examined 33 consecutive patients (27 men and 6 women; age range 47-85 years; mean age 72.5 years) with unilateral or bilateral carotid stenosis. Eighteen cases of carotid stenosis were symptomatic and 17 were asymptomatic. All examinations were carried out after written informed consent was obtained from all the patients.The image of carotid plaques in all the patients was obtained by three imaging Imaging techniques as follows: (1) 3D mPSIR (2) 2D turbo spin-echo (TSE) (3) 3D volumetric isotropic turbo spin-echo acquisition (VISTA). Imaging parameters were as follows: 3D mPSIR: FOV, 240×240 mm2; slice thickness, 3.0 mm; TR/TE, 13.9/2.3 6.9 12 ms; TFE factor, 36; FA, 10°; shot interval, 3000 ms; inversion time, 500 and 2000 ms; SENSE factor, 2; k-space ordering, low-high; fat suppression, SPIR; imaging plane, axial; imaging time, 5:00. 2D TSE: FOV, 200×200 mm2; slice thickness/gap, 4.0/0.4 mm; TR/TE, 500-595/5 ms; TSE factor, 5; matrix size, 256×256; k-space ordering, Multivane; Multivane percentage, 225%; shots per blade, 12; fat suppression, SPIR; imaging plane, axial; imaging time, approximately 3:00. 3D VISTA: FOV, 200×200 mm2; slice thickness, 1.0 mm; TR/TE 400/19 ms; TSE factor 20; refocus FA, 40°; matrix size, 256×258; SENSE factor 4; k-space ordering, low-high; fat suppression, SPIR; imaging plane, coronal; imaging time, 3:20.
mPSIR was acquired two TI images (real and reference images) at three echo times. The real and reference at 1st TE images were used for T1 estimation. From the relationships between two magnetization evolutions from IR, the fully relaxed magnetization and T1 value were calculated. T2* value were calculated with least-square estimation from the 3 echoes obtained by reference image acquisitions.
T1 and T2* value of carotid plaque using mPSIR images were measured. SIR between the plaque and muscle on the TSE image was measured. Contrast-to-noise ratio (CNR) between the plaque and muscle for mPSIR, TSE, and VISTA was measured.
Spearman's correlation coefficient was used to assess the association between SIR and T1 value. Friedman test and subsequent Dunn’s multiple comparison test were used to compare CNR for each sequence. Mann-Whitney test was used to compare T1 and T2* values between asymptomatic and symptomatic carotid plaques.
Results
There was a significant negative correlation between the T1 value of the plaque and SIR measured by TSE. CNR for PSIR had a wide dynamic range corresponding to the T1 value of the plaque compared with those for TSE and VISTA. In plaques with a T1 value of 500 ms or less, mPSIR showed significantly higher CNR than other sequences. T1 and T2* values for symptomatic and asymptomatic plaques were 544.0 ± 258.0, 34.0 ± 33.0 and 569.1 ± 301.7, 21.8 ± 20.3 ms, respectively. No significant differences between symptomatic and asymptomatic arteries were found for T1 and T2* values.Discussion
The mPSIR sequence improved CNR of the carotid plaque and muscle, while simultaneously providing T1 and T2* values of the carotid plaque. The strong negative correlation between T1 value and SIR suggested that T1 mapping using mPSIR can be used for evaluation of the vulnerability of carotid plaque, which contains intraplaque hemorrhage. However, further analysis is needed to assess the relationship between vulnerability and T1 or T2* values.In conclusion, quantitative T1 and T2* mapping using mPSIR have potential to improve the diagnostic accuracy of vulnerability of carotid atherosclerotic plaque.
Acknowledgements
No acknowledgement found.References
- Narumi S, et al. Neuroradiology. 2010;52:285-290
- Zhu DC, et al. Magn Reson Med. 2010;64:1341-51.
- Fujiwara Y, et al. Radiol Phys Techno. 2018;11:156.
Figures
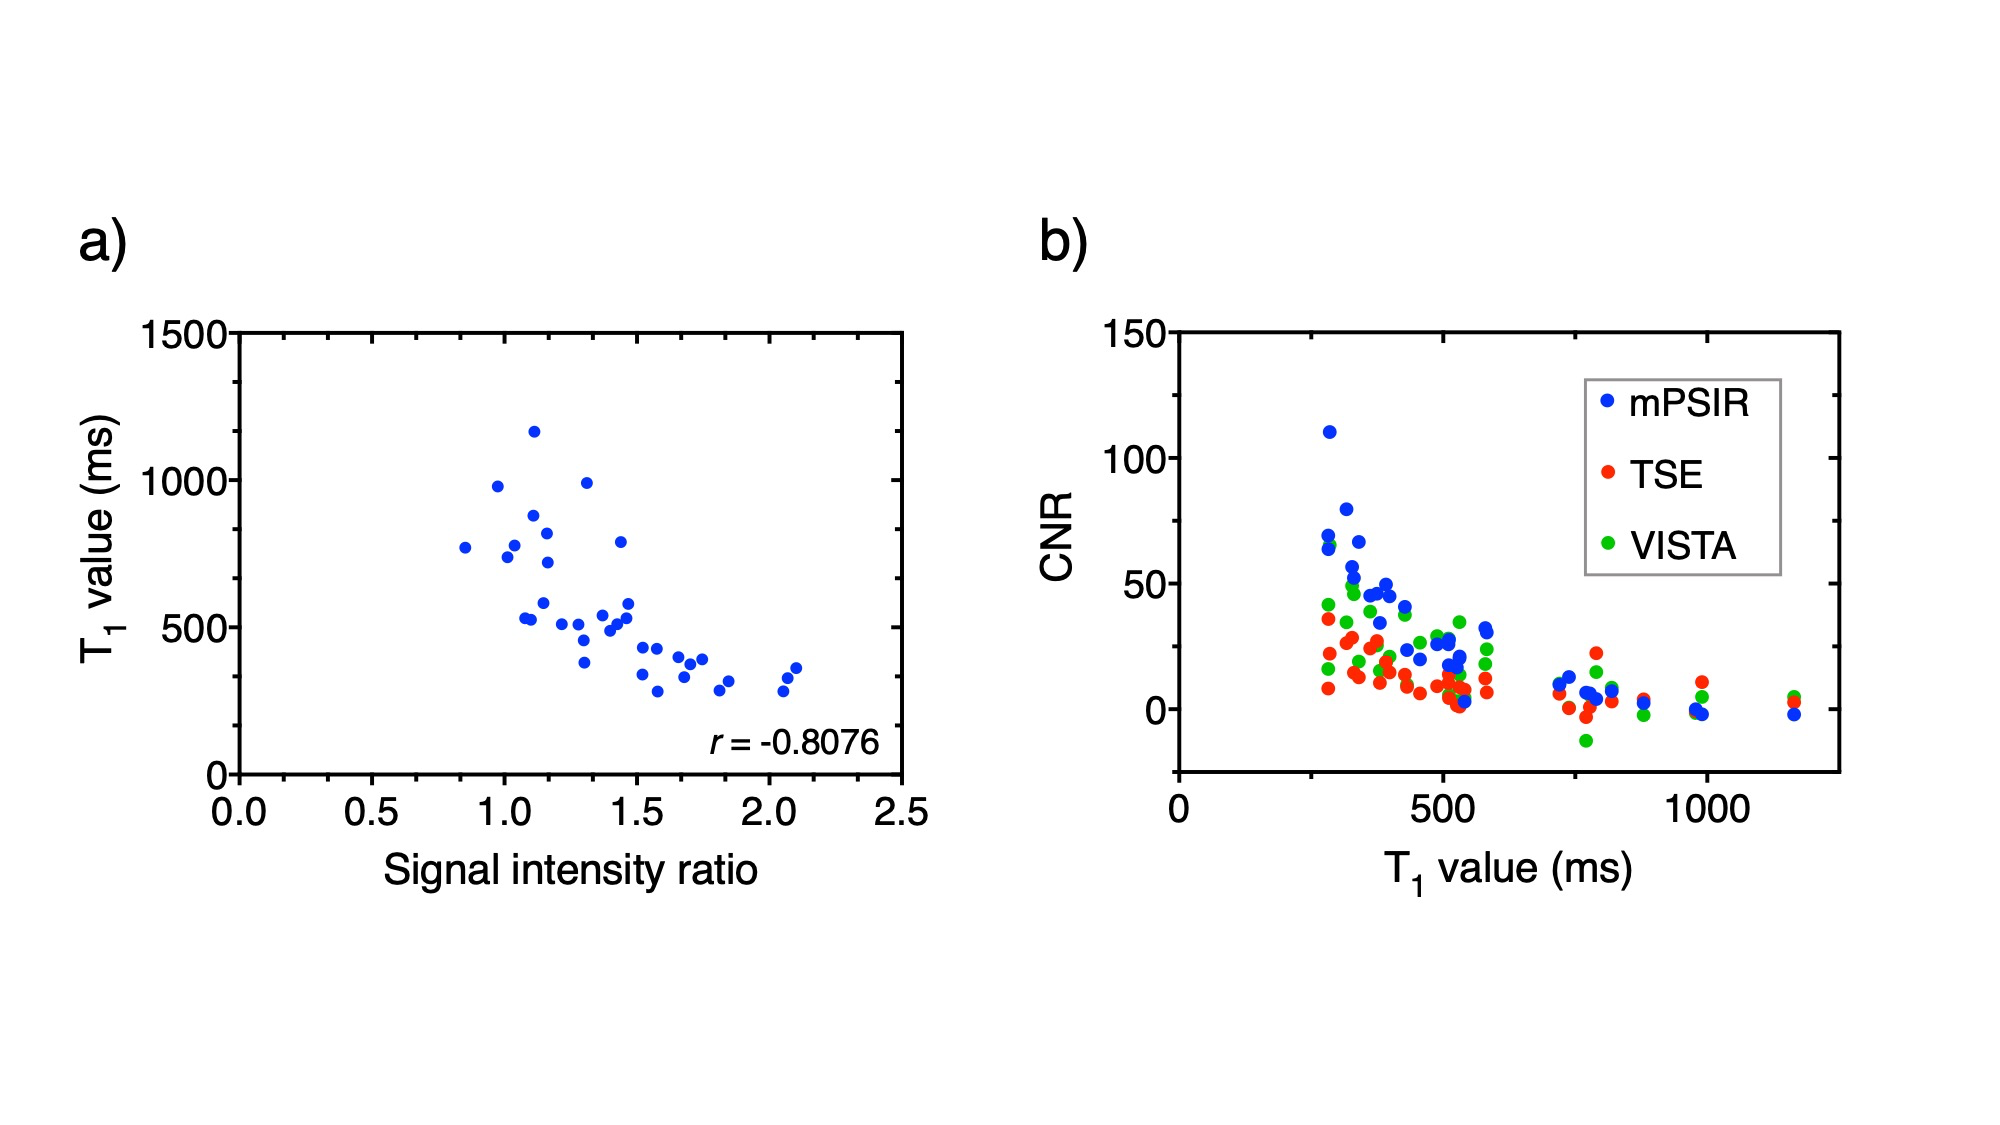
Figure 1
There was a significant negative correlation between the T1 value of the plaque and SIR measured by TSE. CNR for PSIR had a wide dynamic range corresponding to the T1 value of the plaque compared with those for TSE and VISTA.
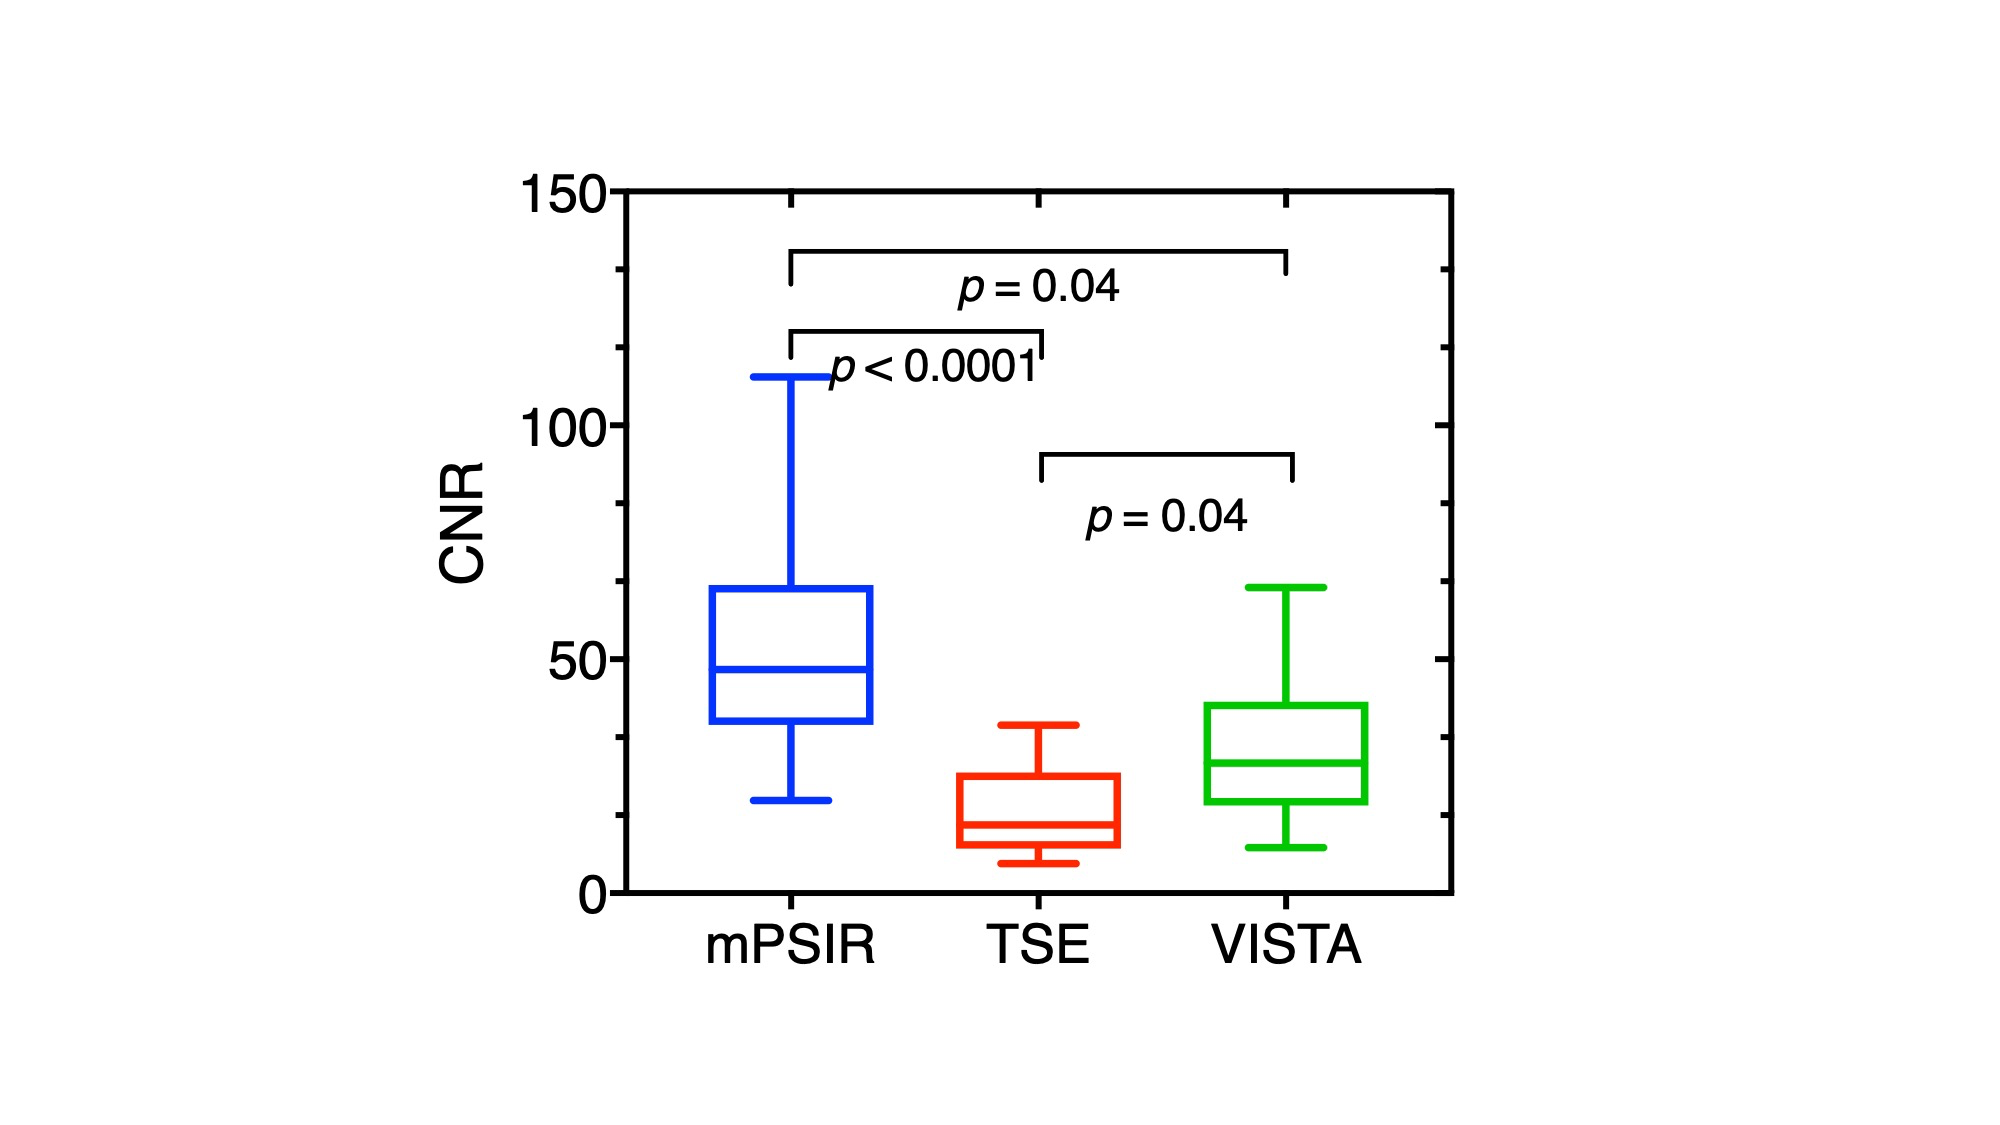
Figure 2
In plaques with a T1
value of 500 ms or less, mPSIR showed significantly higher CNR than other
sequences.
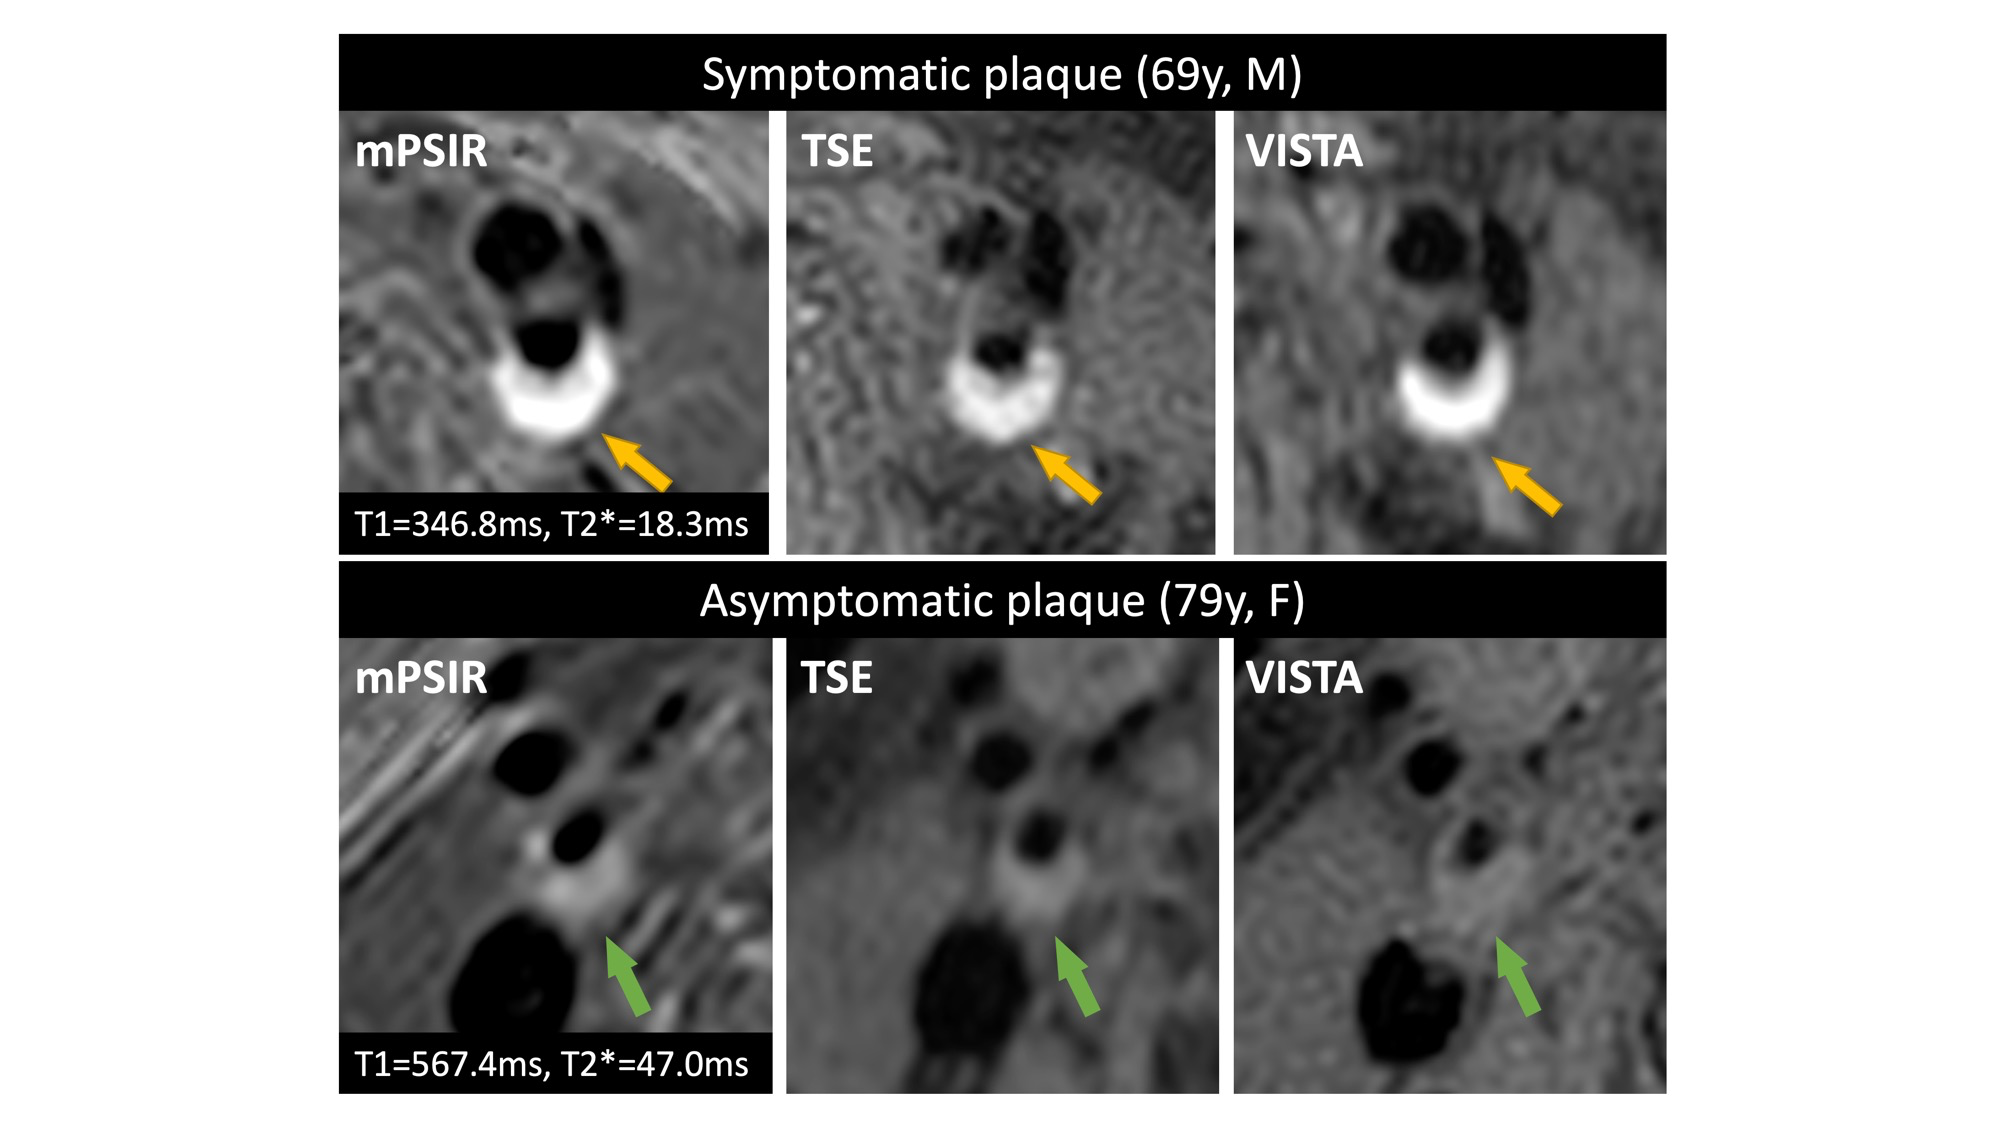
Figure 3
Representative carotid plaque images using three different sequences.
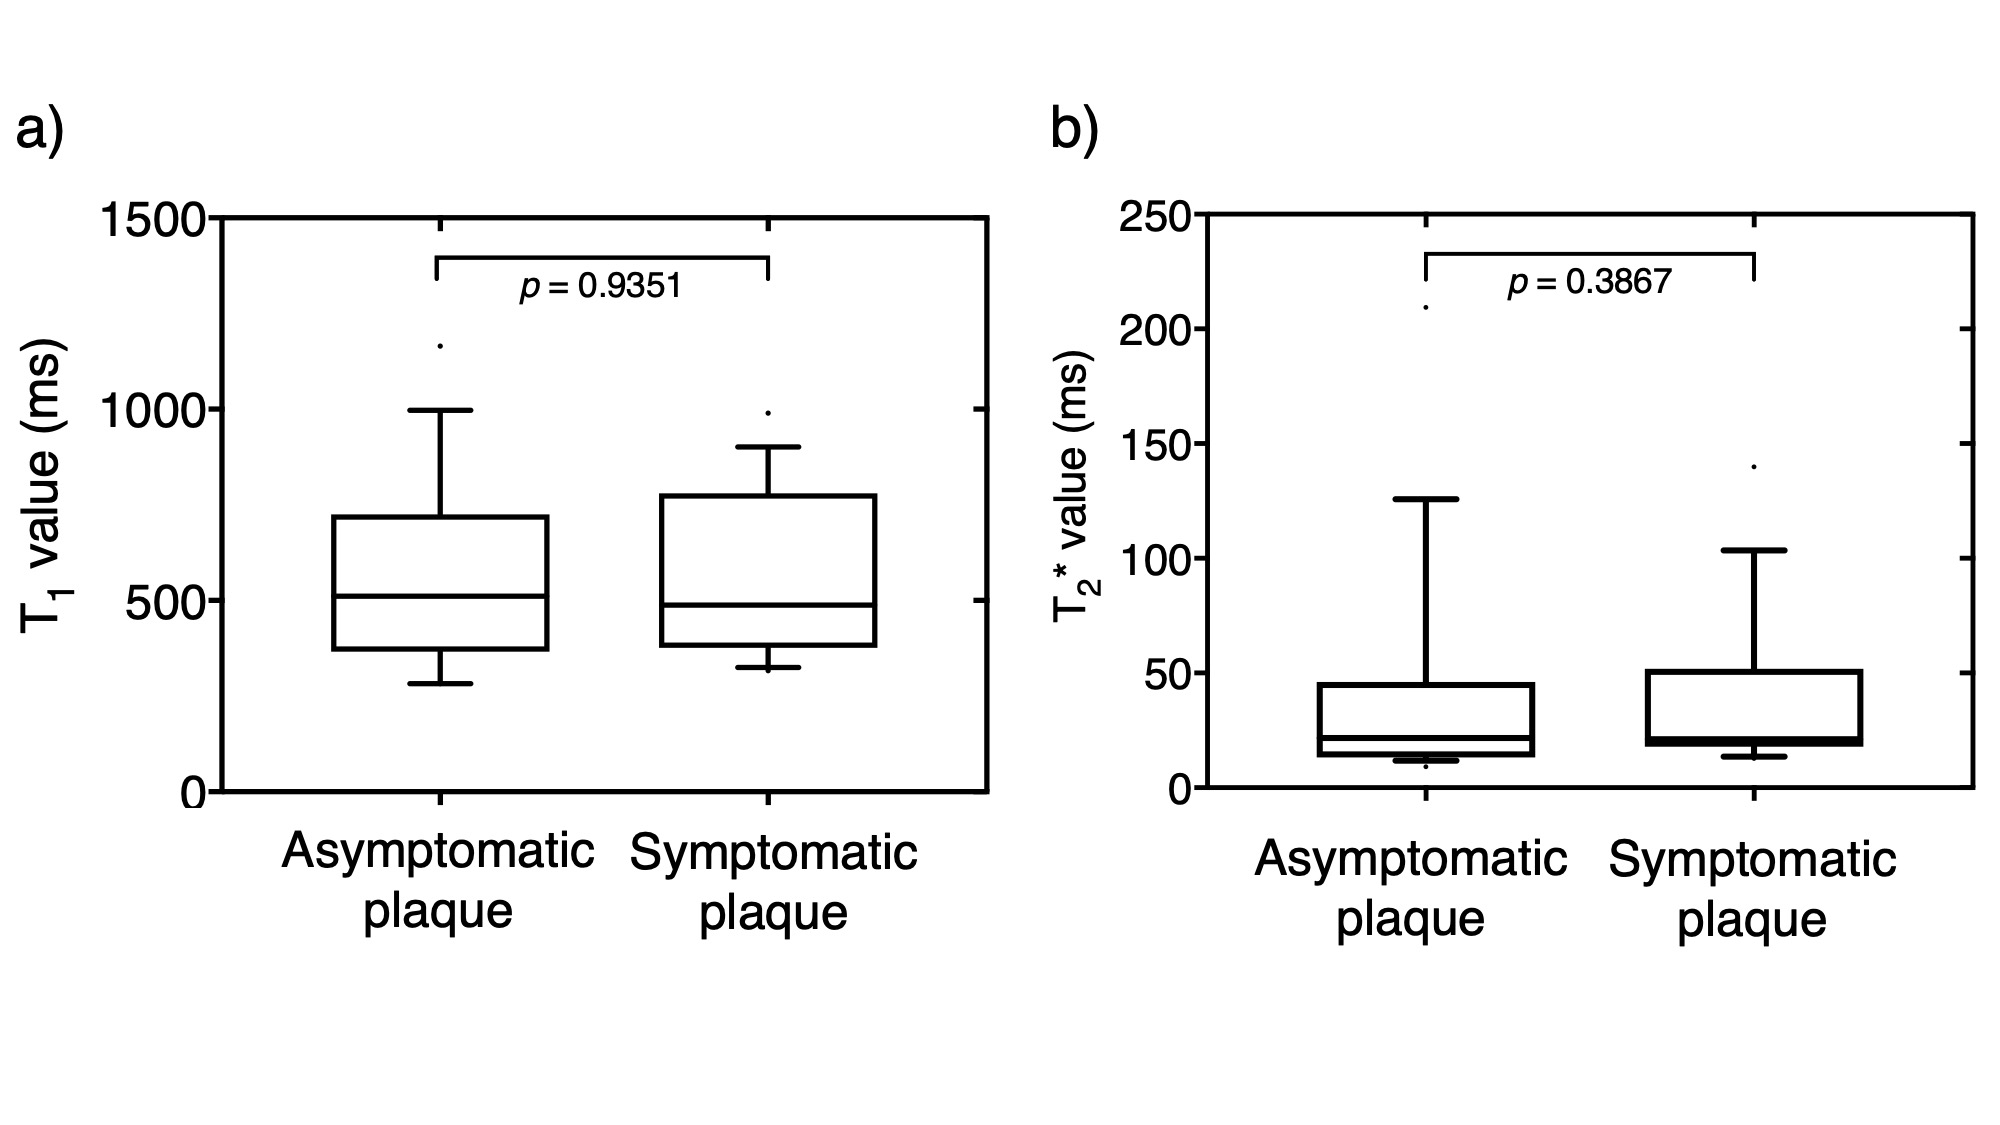
Figure 4
T1 and T2* values for symptomatic and asymptomatic plaques were 544.0±258.0, 34.0±33.0 and 569.1±301.7, 21.8±20.3ms, respectively. No significant differences between symptomatic and asymptomatic arteries were found for T1 and T2* values.