2117
Hemodynamic Characteristics in Patients with Plaques in Thoracic Aorta Based on Compressed Sensing 4D Flow MRI1Fujian Medical University union hospital, Fuzhou, China, 2Siemens Medical Solution, Chicago, IL, United States, 3Siemens Shenzhen Magnetic Resonance Ltd, Shenzhen, China
Synopsis
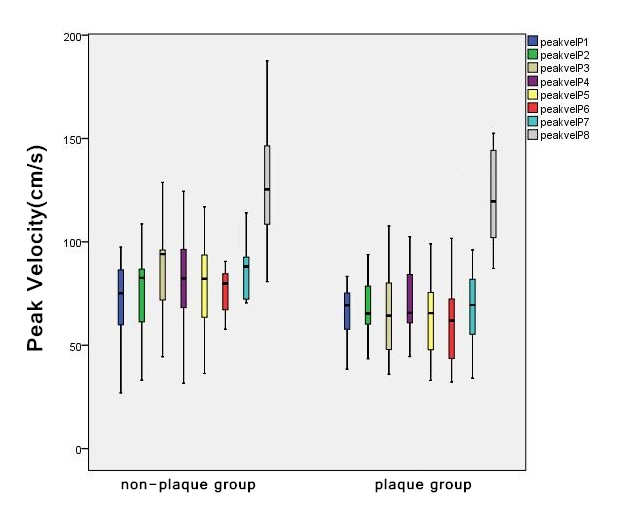
Hemodynamic parameters of patients with and without thoracic aortic atherosclerotic plaques were detected using a compressed sensing (CS) 4d flow sequence. Eight different planes perpendicular to the thoracic aorta were identified to confirm if there were differences in hemodynamic parameters between the plaque and non-plaque groups. The study had shown that the plaque group had lower circumferential wall shear stress, mean velocity and peak velocity compared with that of control groups. Early detection of abnormal blood flow parameters in patients with aortic atherosclerosis may help predict regions prone to plaque, allowing early intervention in patients accordingly.
Introduction
The aortic arch atherosclerotic plaque plays an important role in the incidence of ischemic stroke. 4D flow MRI has emerged as a comprehensive method for visualizing and quantifying aortic blood flow. However, the long scan time limits its clinical application. Recently, compressed sensing (CS) technique has shown great potential in reducing scan time. The aim of this study was to access the hemodynamic parameters for predicting atherosclerotic plaque-prone population in the thoracic aorta and acquire the hemodynamic characteristics of patients with aortic atherosclerosis by using CS 4D flow MRI.Methods
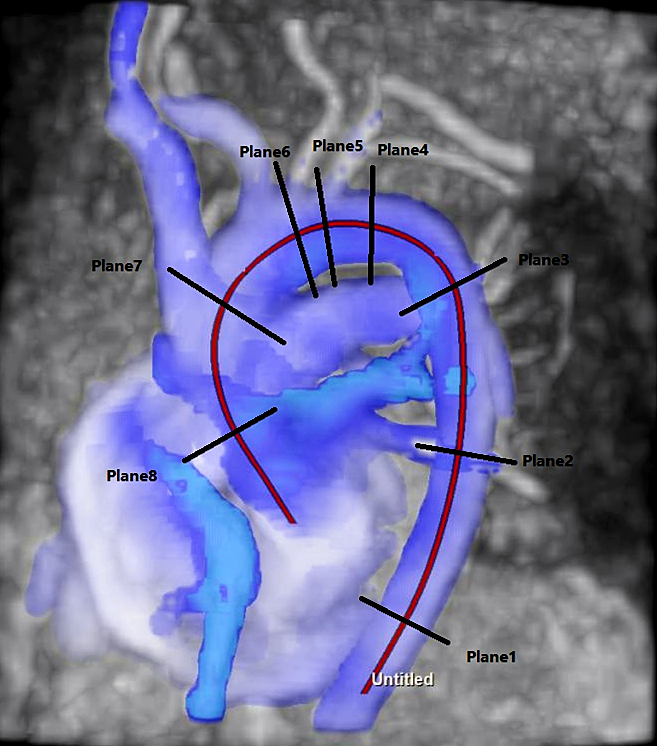
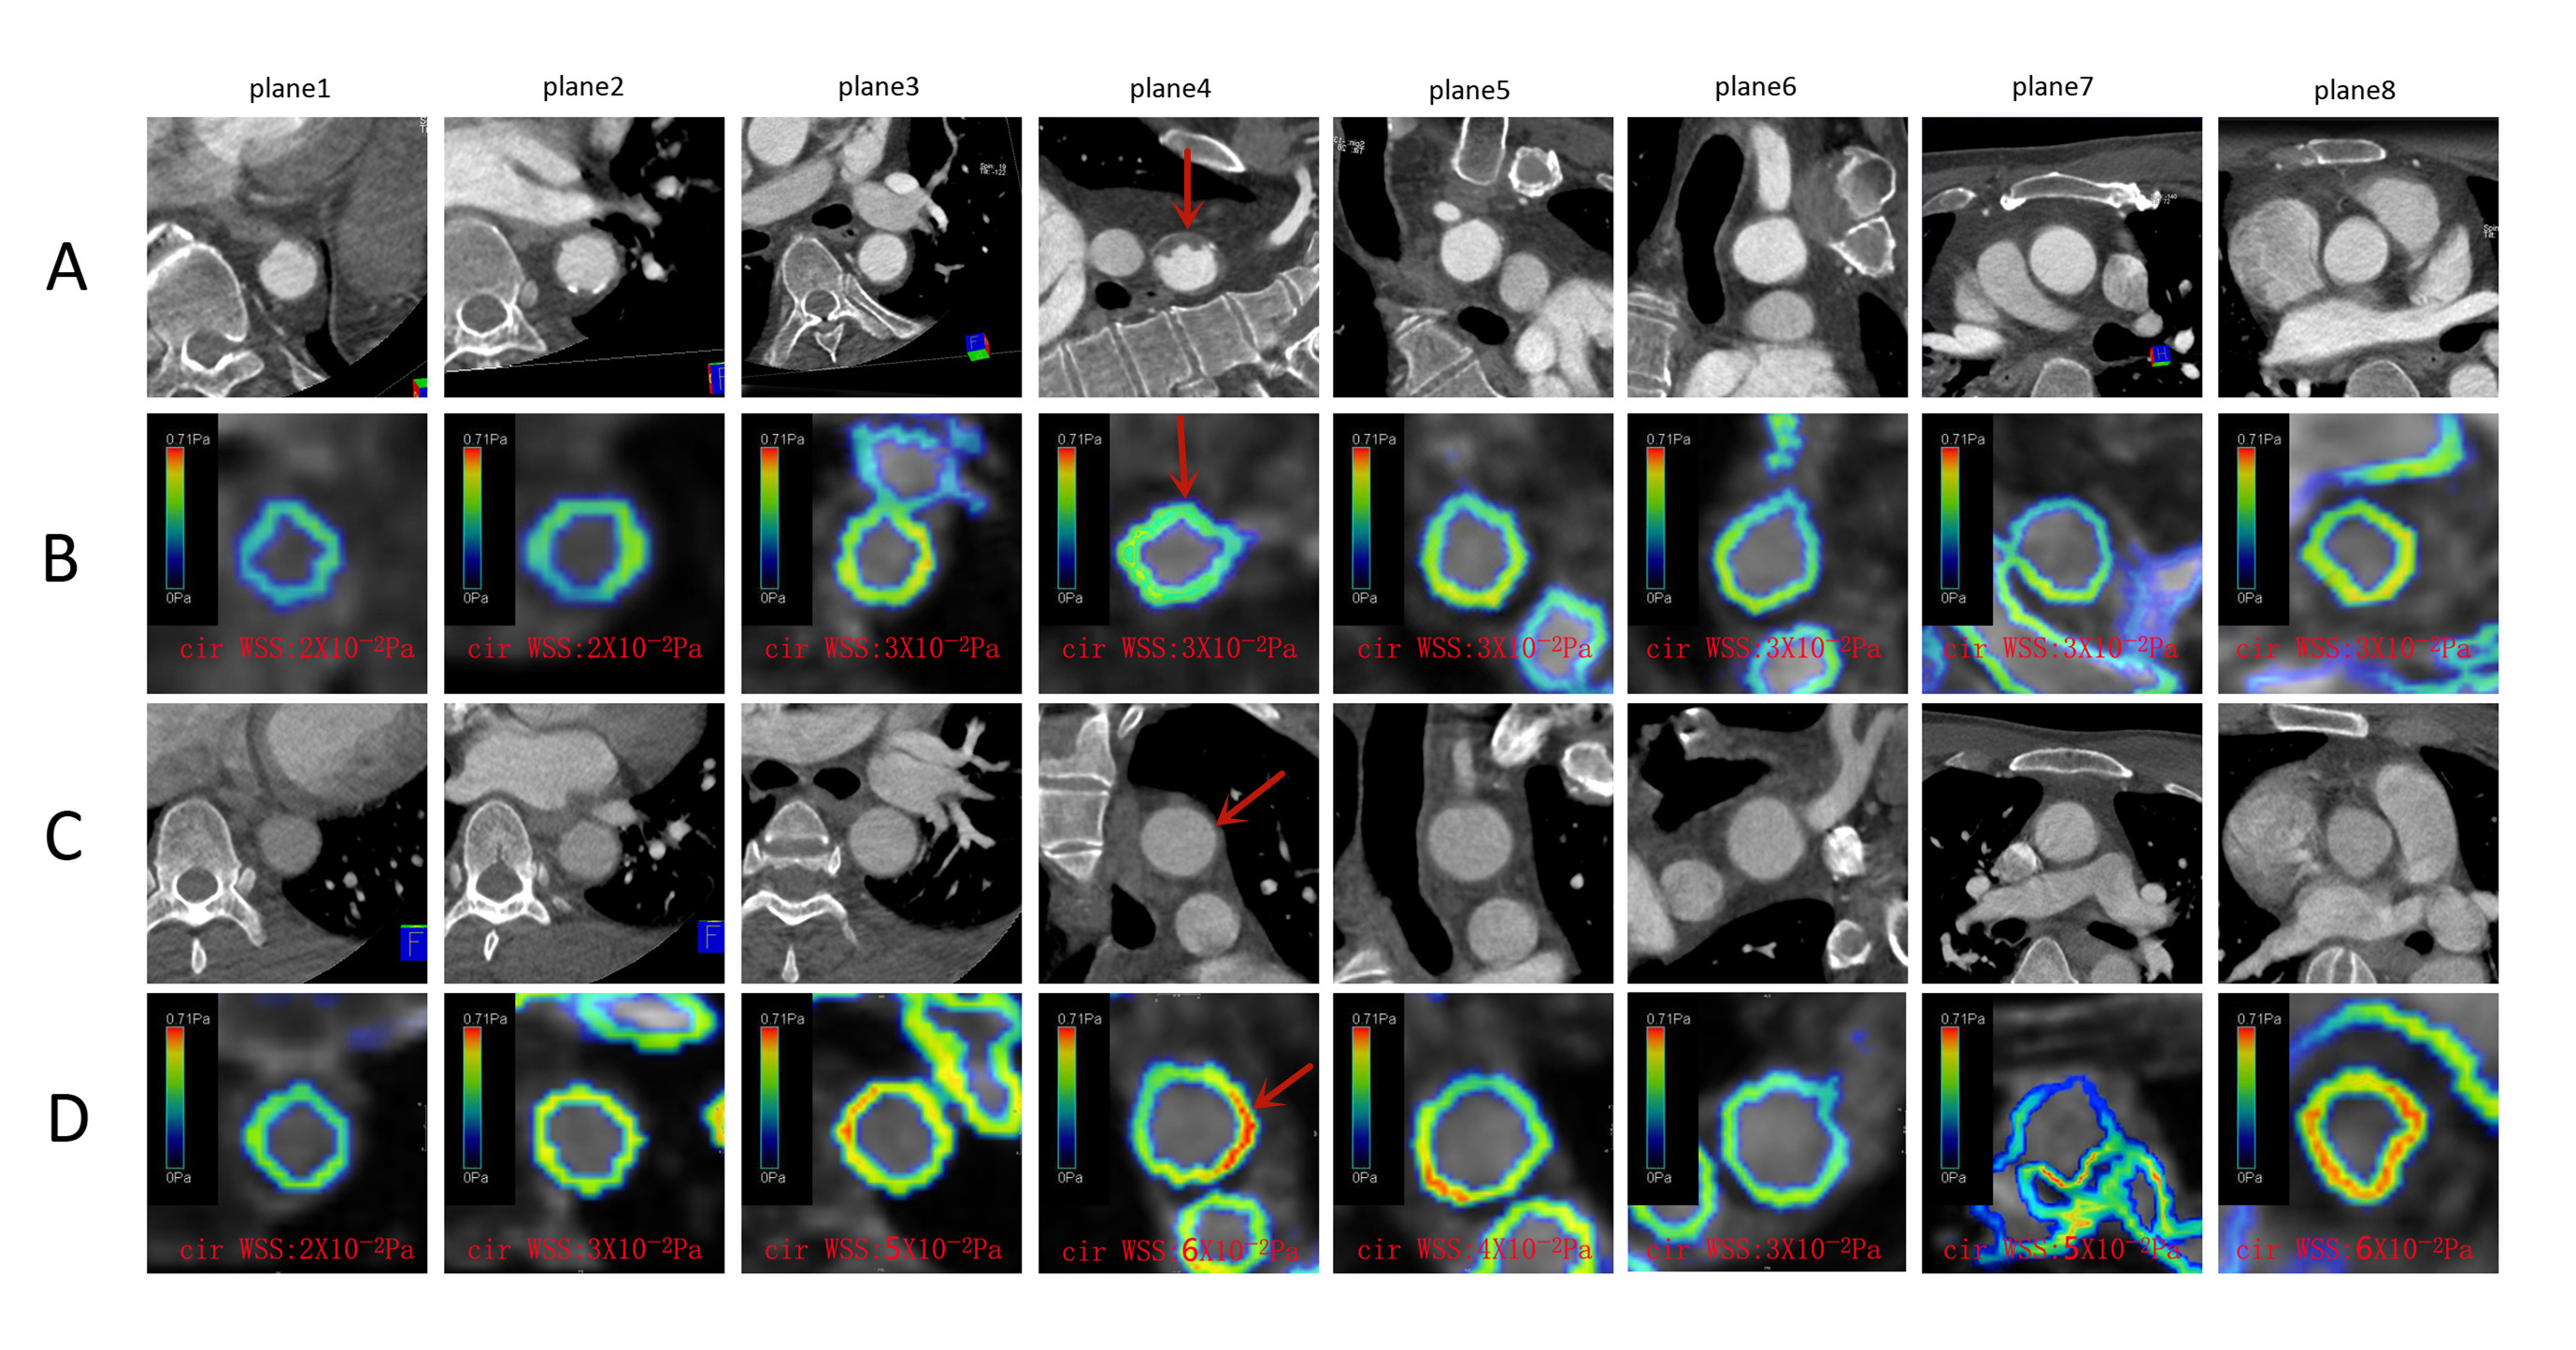
In this study, data were collected from adult patients who underwent both thoracic aorta computer tomography angiography(CTA) and aortic MRI on a 3T scanner(MAGENTOM Prisma, Siemens Healthcare, Erlangen, Germany) within 2 weeks from January 2019 through October 2019.Thoracic aorta CTA was used to identify the presence of aortic plaques with diameter greater than 5mm along the whole thoracic aorta. In addition, the CTA data included the location, magnitude and the characters of the plaque. A navigator gated CS 4D flow prototype sequence was implemented to acquire data during free-breathing with interleaved three-directional velocity encoding. The main parameters were as follows: temple resolution 40.48ms,Venc 150cm/s ,voxel size 2.3x2.3x2.5mm3, FA 7o, CS acceleration factor 7.6. Images were analyzed with post-processing software (CVI42, Circle. Cardiovascuar Imaging, Calgary, Canada). Eight different planes1 perpendicular to the thoracic aorta were analyzed to obtain hemodynamic parameters, including total volume(TV), peak flow(PF), mean velocity(MV), peak velocity(PV), axial wall shear stress (axWSS) and circumferential wall shear stress (cirWSS). Patients were grouped based on being diagnosed with atherosclerosis or not. Hemodynamic data were presented as means with standard deviation and compared by using Paired-Samples T test, Mann-Whitney U test.Results
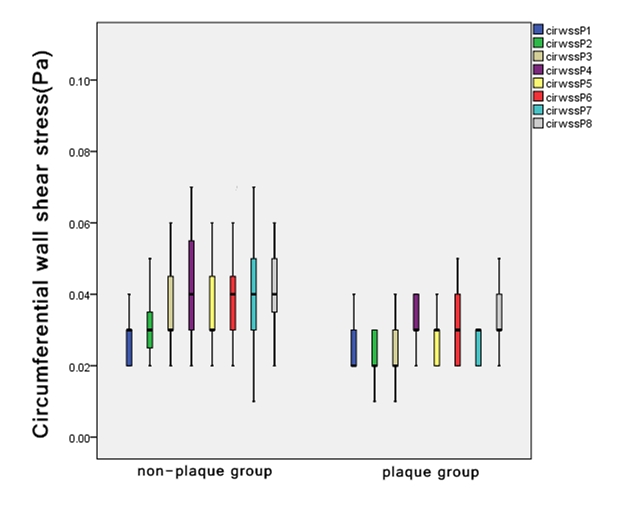
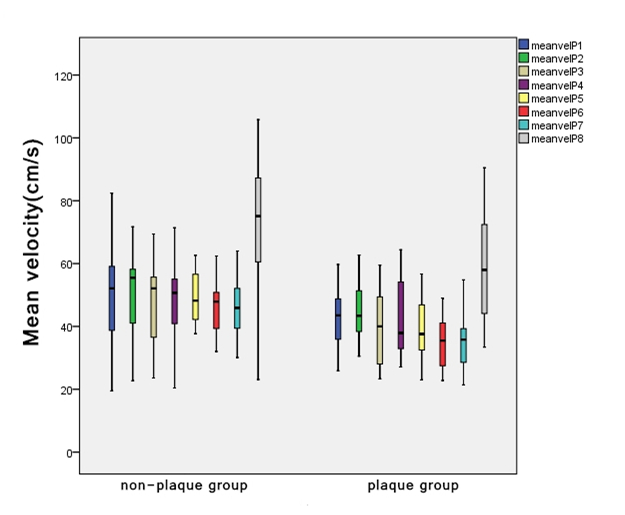
Thirty subjects were involved in the study, including 15 patients diagnosed with atherosclerosis (mean age 66±9 years, 1 female) and 15 age-matched non-atherosclerosis patients (mean age 63±9 years, 2 females), with 240 planes, 1920 parameters, and 17 relatively large plaques in total. The average scanning time of CS 4D flow sequence was 2.45±0.3 minutes. Patients with atherosclerosis showed lower cirWSS values in planes 2-7, lower mean velocity in planes 5-7 and lower peak velocity in planes 6-7 compared with those of non-atherosclerosis patients. See details directlly in boxplots Figure3-5. 76.5% of the plaques were in planes 3 and 4, which were plaque-prone regions. In addition, about 93.3% of the atherosclerosis patients (14/15) with abnormal blood flow parameters had cerebral infarction. In contrast, only 26.7% of the non-atherosclerosis patients (4/15) with normal blood flow parameters had cerebral infarction. This may suggest that patients with abnormal blood flow are more likely to cause cerebral infarction.Discussion
The circumferential WSS values in planes 2-7 were found to be lower in the plaque group than that of the non-plaque group. Previous studies have shown that WSS was decreased along with diseases such as hypertension and atherosclerosis2. It was well known that shear forces act on the vessel wall along both the axial and circumferential directions, therefore, WSS has to be considered as a vector. Although these properties have been described in model studies over a decade ago3, no comprehensive in vivo analysis of WSS distribution differences between population with thoracic aortic plaque and non-plaque group has been presented to date. Very few studies have investigated thoracic atherosclerosis by using CS 4D flow techniques. Alterations in WSS have been shown to cause changes in endothelial metabolism, which could further lead to stiffness and remodeling of vessel wall4-5. Therefore, early detection of abnormal blood flow parameters (circumferential WSS, mean velocity and peak velocity) may help predict plaques-prone regions, and significantly impact timely treatment of these pathological conditions. More importantly, imaging time required for the traditional 4D flow sequence is relatively long ranging from 5-10 minutes6 compared with CS 4D flow sequences, which only needs less than 3 minutes. As a result, such reduction of scanning time of the sequence greatly benefits its clinical applications.Conclusion
Early detection of abnormal blood flow parameters of the patients with aortic atherosclerosis(circumferential WSS, mean velocity and peak velocity) based on CS 4D flow MRI may help predict regions prone to plaques so that patients can be intervened in advance. More importantly, this may also help investigate mechanical properties of atherosclerotic lesions, plaque vulnerability and mechanism of plaque rupture in the future.Acknowledgements
/References
1.Dyverfeldt P , Bissell M , Barker A J , et al. 4D flow cardiovascular magnetic resonance consensus statement[J]. Journal of Cardiovascular Magnetic Resonance, 2015, 17(1):72.
2.Shaaban A M , André J. Duerinckx. Wall Shear Stress and Early Atherosclerosis[J]. American Journal of Roentgenology, 2000, 174(6):1657-1665.
3.Azer K , Tang H , Desiderio M , et al. In Vivo MRI quantification of circumferential wall shear stress in atherosclerotic-prone mouse aorta[C]// Bioengineering Conference, 2007. NEBC '07. IEEE 33rd Annual Northeast. IEEE, 2007.
4.Burris N S , Hope M D . 4D Flow MRI Applications for Aortic Disease[J]. Magnetic Resonance Imaging Clinics of North America, 2015, 23(1):15-23.
5.Bollache E , Van Ooij P , Powell A , et al. Comparison of 4D flow and 2D velocity-encoded phase contrast MRI sequences for the evaluation of aortic hemodynamics[J]. The International Journal of Cardiovascular Imaging, 2016, 32(10):1529-1541.
6.Ma L E , Markl M , Chow K , et al. Aortic 4D flow MRI in 2 minutes using compressed sensing, respiratory controlled adaptive k-space reordering, and inline reconstruction[J]. Magnetic Resonance in Medicine, 2019.
Figures