2116
Evaluation of Turbulent Kinetic Energy Measurement for hypertrophic cardiomyopathy by Using Triple-VENC 4D Flow MRI1Radiology, Nippon Medical School, Tokyo, Japan, 2Cardiovascular Medicine, Nippon Medical School, Tokyo, Japan, 3Radiology, Nihon University, Tokyo, Japan, 4Philips Electronics Japan Ltd., Tokyo, Japan
Synopsis
The purpose of this study was threefold. First, we validated whether TKE reflects the condition of HOCM and HNCM by comparing them with volunteers. Second, we clarified the factors that increase TKE in HCM. Third, we revealed LV mass which is associated with cardiac load, resulting in a poor outcome. TKE in HOCM was significantly higher than HNCM or volunteers. Maximum velocity, maximum short of the valve orifice, SAM, and LV mass were correlated to TKE. TKE allows to noninvasively depict the flow characteristics and may provide insights into the pathophysiology associated with flow dynamics in HCM.
Introduction
In the patients with hypertrophic cardiomyopathy (HCM), the impairment of cardiac ejection efficiency due to the obstruction of left ventricle outflow tract (LVOT) relates to the HCM-related death [1]. Recently, the turbulent kinetic energy (TKE) estimation based on 4D Flow MRI has been developed. Previous studies revealed that 4D Flow-based TKE measurement well correlates to the pressure drop at LVOT in the patients with aortic stenosis which has a similar physiological entity as HCM [2]. The purpose of this study was threefold. First, we validated whether TKE reflects the condition of HOCM and HNCM by comparing them with volunteers. Second, we clarified the factors that increase TKE in HCM. Third, we revealed left ventricular (LV) mass which is associated with cardiac load, resulting in a poor outcome.Methods
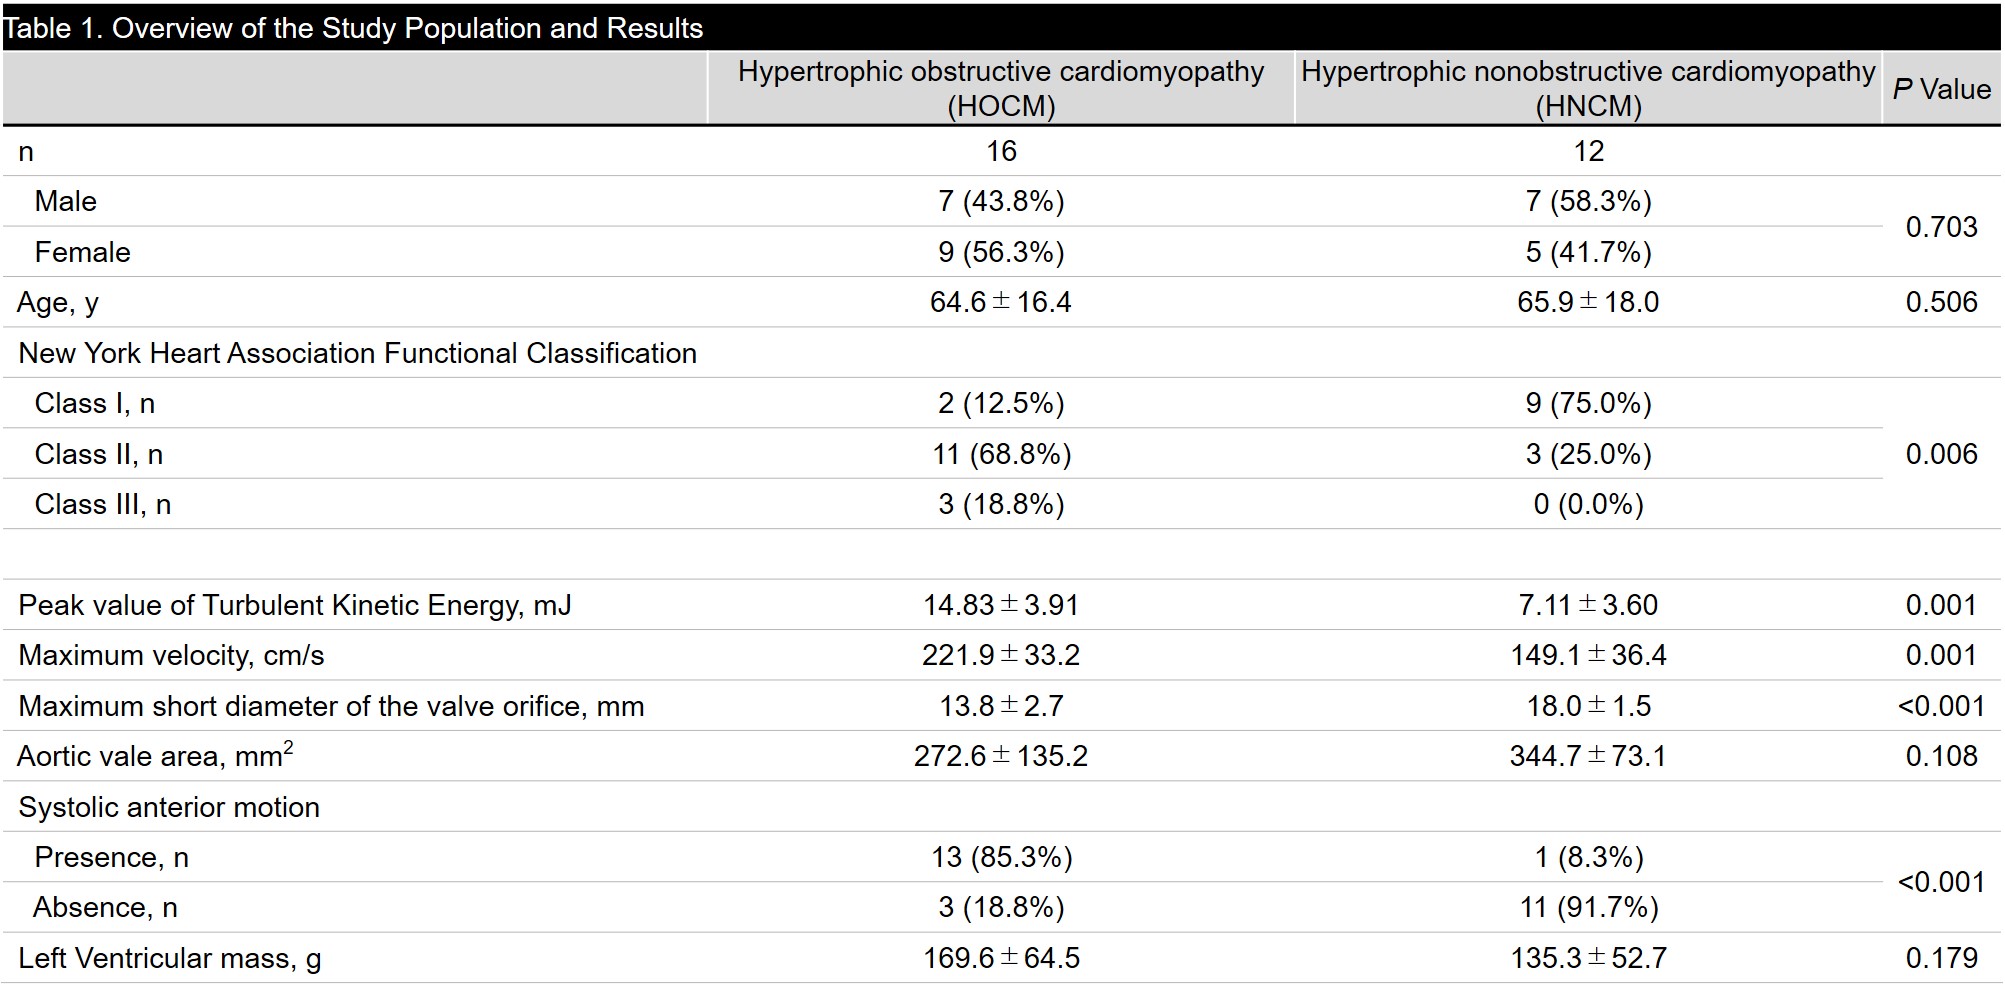
Patients; We recruited 9 volunteers (30.9 ± 3.0 years old, 6 males) and 28 HCM patients who were referred for cardiac MR examination. Based on echocardiography, patients were assigned into HCM with LVOT obstruction (HOCM) (16 patients, 64.6 ± 16.4 years old, 7 males) or HCM without LVOT obstruction (12 patients, 65.9 ± 18.0 years old, 7 males).MR acquisition; We performed cardiac MRI including 4D Flow MRI using a 3.0-T MRI unit (Achieva; Philips Healthcare, Best, The Netherlands). The parameters of 4D Flow MRI and are as follows. TR/TE = 4.3/2.7, FA = 11 degrees, Resolution = 1.7*1.7*2.0 mm3; Triple VENC acquisition=50-150-450 cm/s; k-t PCA (acceleration factor, 5-7), cardiac phase 15-21, free breath acquisition; and acquisition time 8-15 min.). TKE was calculated from the magnitude images of multi-VENC data combined with Bayesian estimation by using offline reconstruction software (CRECON, Gyrotools, Zurich, Switzerland). It takes approximately 15 minutes [3].
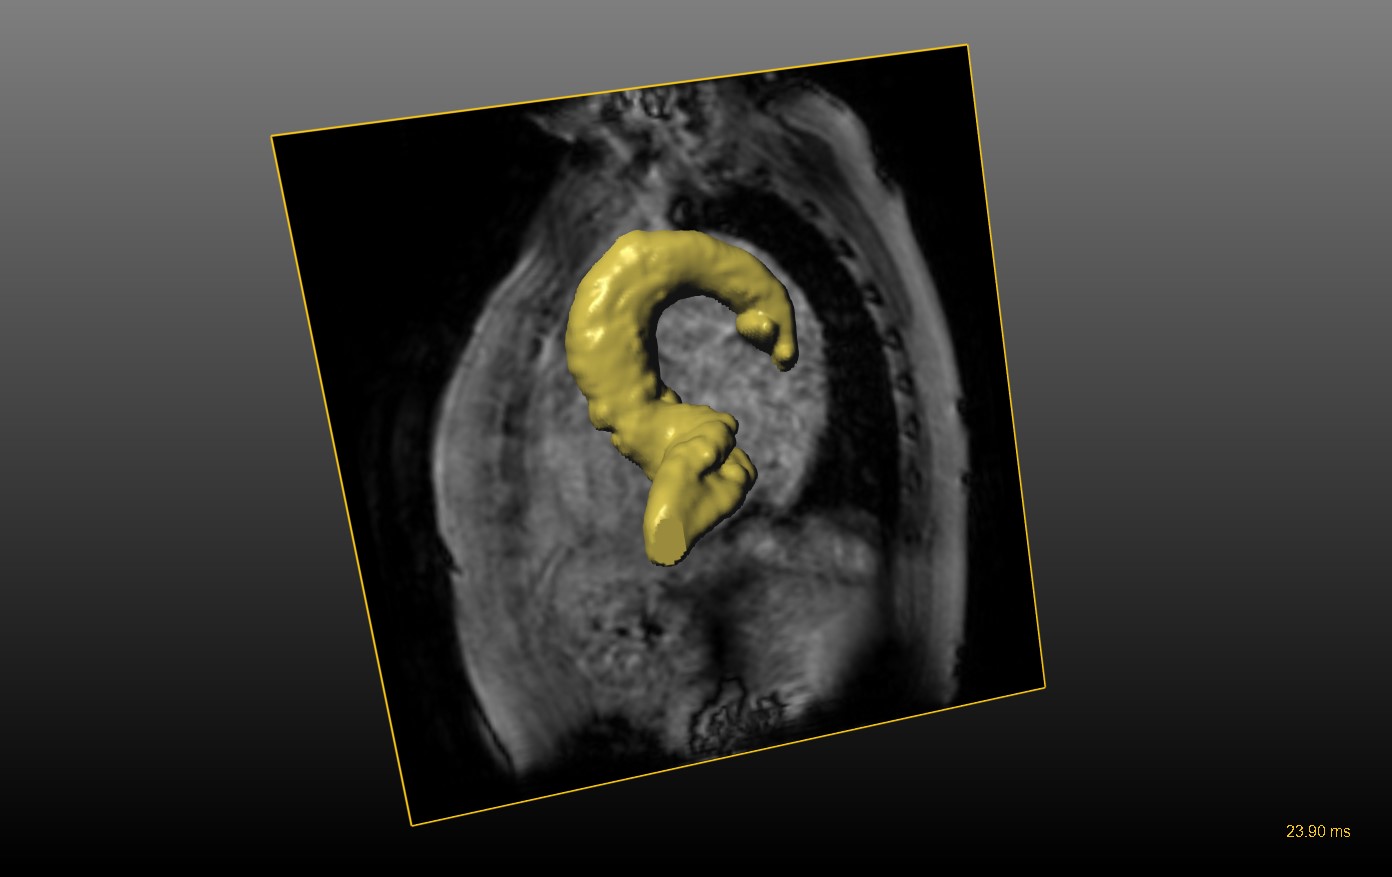
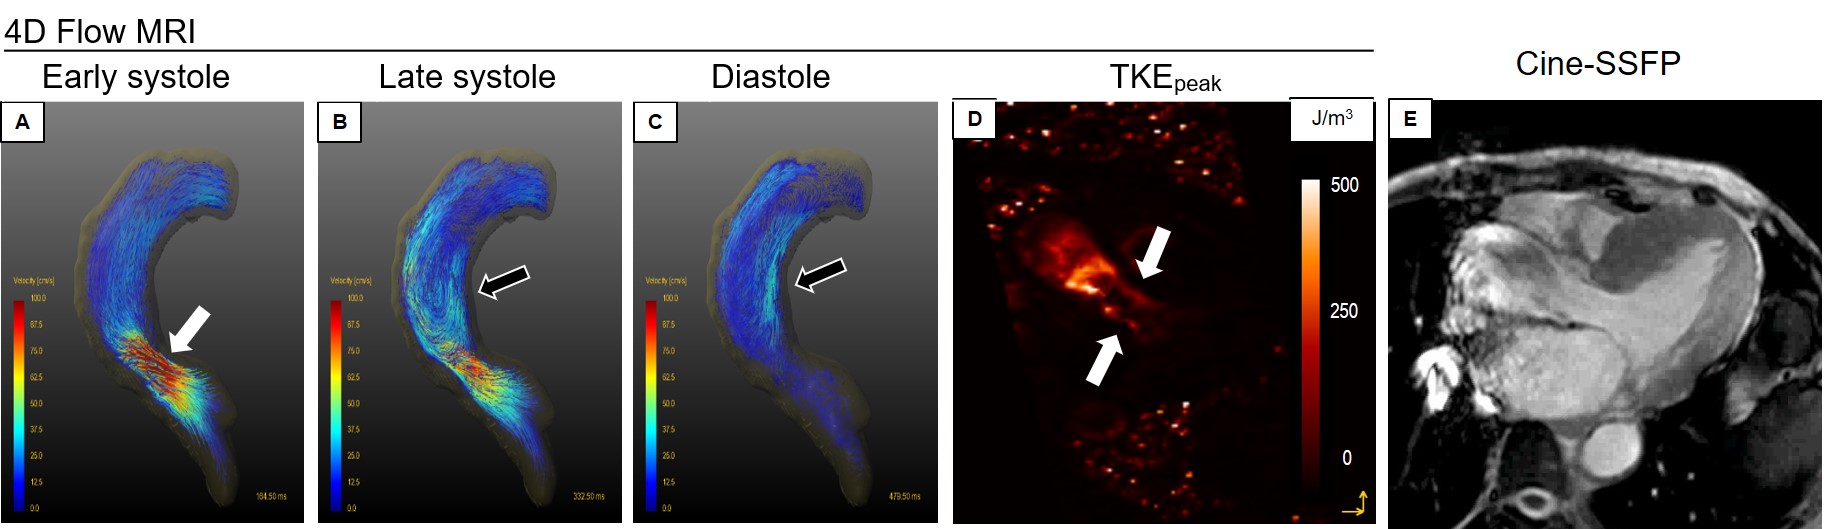
MR analysis; GT Flow (Gyrotools, Zurich, Switzerland) was used. The VOI from left ventricular to aortic arch was drawn semi-automatically based on phase contrast MRA imaging derived from 4D Flow MRI data (Figure 1). TKEphase is calculated as the sum of entire VOI at each cardiac phase. TKEpeak was the highest TKEphase in the all cardiac phase. From the VOI, we measured the maximum velocity at peak systole. The maximum short diameter of the valve orifice and aortic valve area were measured using 3D phase-contrast MRA generated from 4D Flow MRI dataset. Whether the systolic anterior movement (SAM) was present by interpretation of cine-SSFP. LV mass was also measured from cine-SSFP in a standard manner.
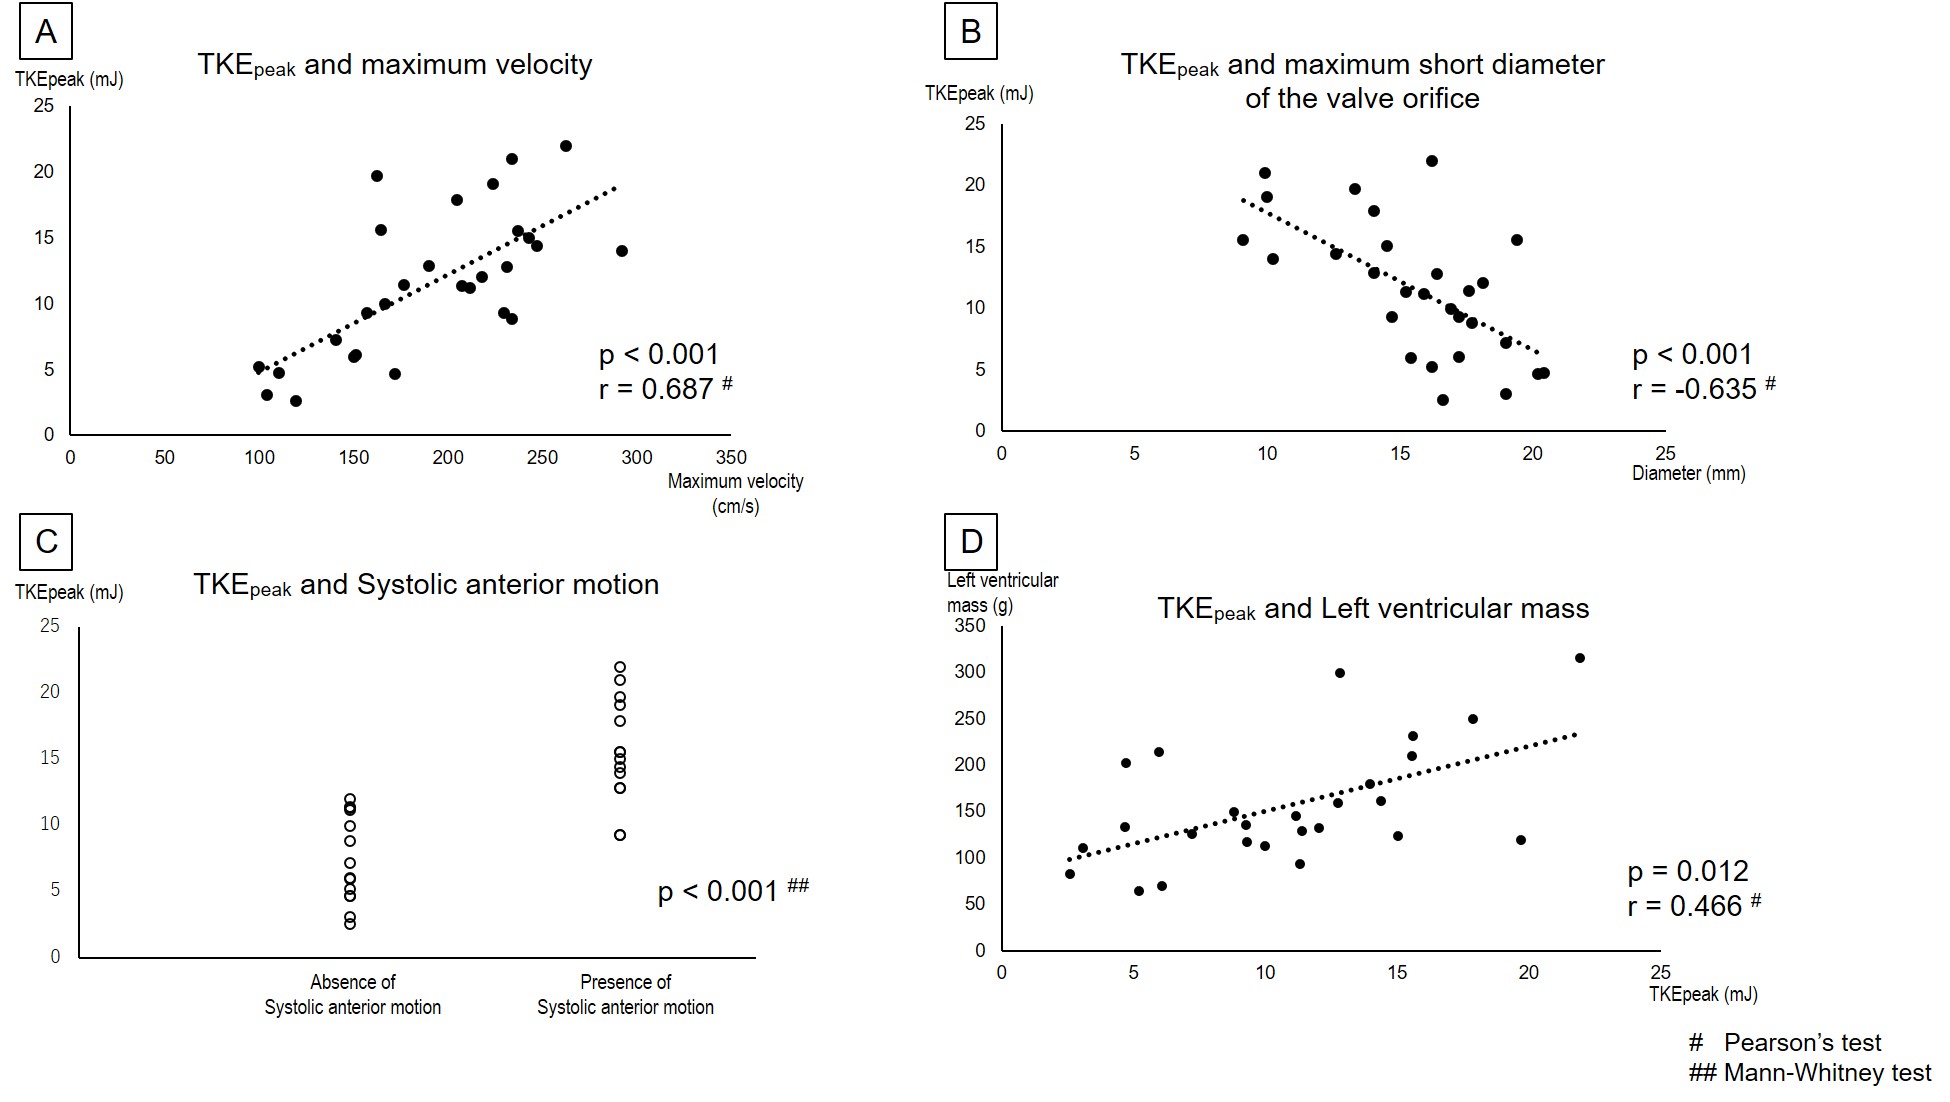
Statistics; To validate whether TKE reflects the condition of HCM, TKEpeak in the HOCM group, HNCM group, and volunteers were compared by one-way ANOVA. To clarify the factors which increase TKE in HCM, the correlation coefficients between TKEpeak and each maximum velocity value, maximum short diameter of the valve orifice, aortic valve area, and presence/absence of SAM were analyzed by Pearson’s test. To reveal the clinical significance of TKE, the correlation coefficient TKEpeak and LV mass in HCM by Pearson’s test.
Results
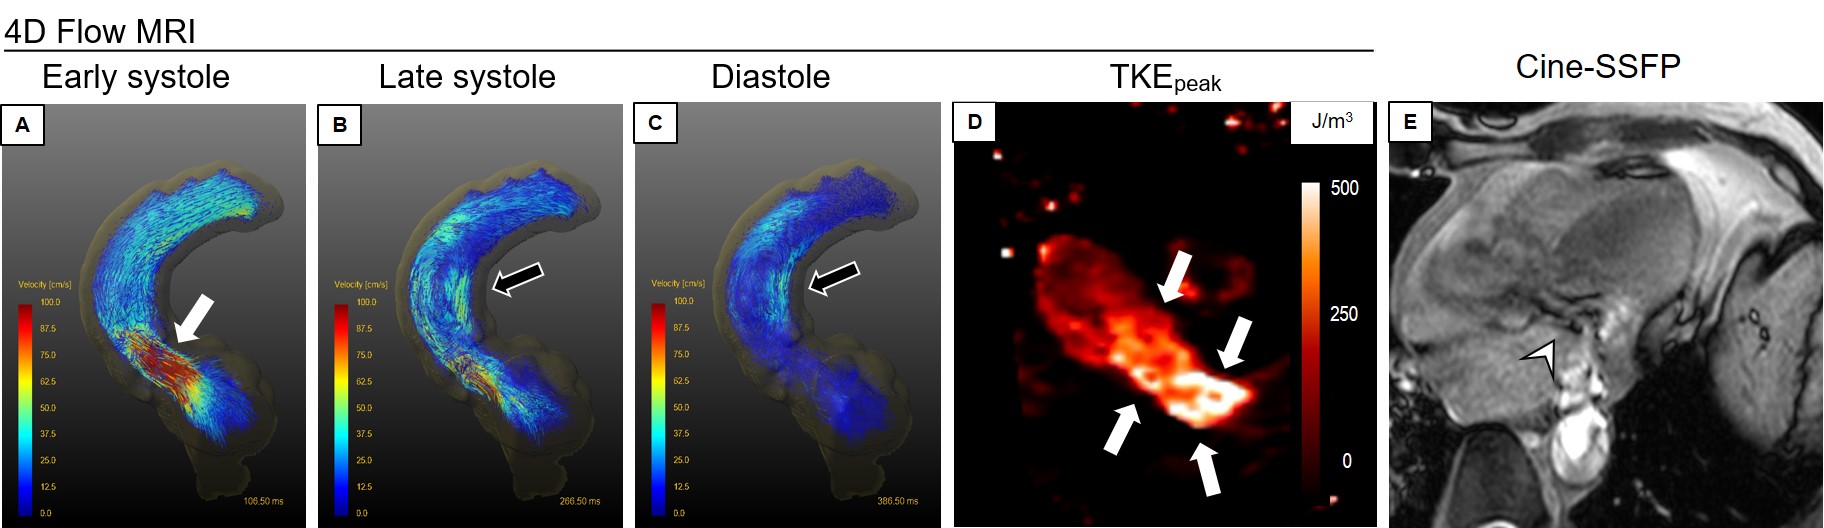
The patients’ characteristics and results were shown in Table 1. The TKEpeak of the HOCM group was significantly higher than the HNCM group or volunteer group (14.83 ± 3.91 vs. 7.11 ± 3.60 vs. 4.50 ± 1.55 mJ, p < 0.001), while there was no significant difference between the HNCM group and volunteer group (p = 0.069). The TKEpeak correlated with the maximum velocity (p < 0.001, r = 0.687) and maximum short dimeter of the valve orifice (p < 0.001, r = −0.635) (Figs. 2-A and B). The TKEpeak in patients with SAM were significantly higher than without SAM (15.60 ± 3.81 vs. 7.44 ± 3.17 mJ, p < 0.001) (Fig. 2-C). TKEpeak was associated with increase in LV mass (p = 0.012, r = 0.466) (Fig. 2-D). Representative cases are shown in Figs. 3 and 4.Discussion
As generally expected, TKEpeak was significantly elevated in patients with HOCM who had higher maximum velocity. In addition, TKEpeak was also associated with morphological changes such as maximum short diameter of the valve orifice. Compared with the previous study validating TKEpeak based on 4D Flow MRI in patients with aortic stenosis, the current study reveals that the TKEpeak in HOCM was lower at peak systole (26.1 ± 9.9 mJ vs. 14.83 ± 3.91 mJ). TKE linearly correlated to LV mass. The high TKE with increasing LV mass indicates the link between pressure loss by LVOT obstruction and the pathological reaction. This reaction is considered as a poor outcome [4].Conclusion
TKE measurement based on 4D Flow MRI can noninvasively detect the flow alteration induced not only by systolic flow jet but also by LVOT geometry such as SAM in HOCM. The elevated TKE with increasing LV mass indicates the link between pressure loss and the pathophysiological reaction.Acknowledgements
No acknowledgement found.References
1. Martin MS, Olivotto I, Betocchi S, Cassey SA, Lesser JR, Losi MA, Cecchi F, Maron BJ. Effect of Left Ventricular Outflow Tract Obstruction on Clinical Outcome in Hypertrophic Cardiomyopathy. N Engl J Med. 2003;348:295-303.
2. Binter C, Gotschy A, Sündermann SH, Frank M, Tanner FC, Lüscher TF, Manka R, Kozerke S. Turbulent Kinetic Energy Assessed by Multipoint 4-Dimensional Flow Magnetic Resonance Imaging Provides Additional Information Relative to Echocardiography for the Determination of Aortic Stenosis Severity. Circ Cardiovasc Imaging. 2017;10:e005486.
3. Knobloch V, Binter C, Gulan U, et al. Mapping mean and fluctuating velocities by Bayesian multipoint MR velocity encoding-validation against 3D particle tracking velocimetry. Magn Reson Med 2014;71:1405-1415.
4. Olivotto I, Maron MS, Autore C, Lesser JR, Rega L, Casolo G, De Santis M, Quarta G, Nistri S, Cecchi F, Salton CJ, Udelson JE, Manning WJ, Maron BJ. Assessment and significance of left ventricular mass by cardiovascular magnetic resonance in hypertrophic cardiomyopathy. J Am Coll Cardiol. 2008;52:559-566.
Figures