2115
Quantifying the impact of pulmonary artery stent interventions on ventricular flow dynamics with 4D Flow MRI1Biomedical Engineering, University of Wisconsin - Madison, Madison, WI, United States, 2University of Wisconsin - Madison, Madison, WI, United States
Synopsis
In a swine model of PAS, this study assessed the effects of early versus delayed stent interventions using 4D Flow MRI. Early and Delayed interventions were both effective but no differences between early and delayed interventions were observed. 4D Flow MRI measured inefficient LV and RV flow in the PAS group and an association was found between EF and vorticity. If confirmed in larger studies, these results provide physiological insight into PAS and congenital heart disease and also highlight the sensitivity of 4D Flow MRI biomarkers to ventricular dysfunction.
Introduction
Congenital heart disease (CHD) is the most common birth defect, occurring in approximately 1% of all newborns [1]. Most complex forms of congenital heart disease (CHD) require surgical repair during infancy [1]. A common post-operative complication of these early surgeries is branch pulmonary artery stenosis (PAS) [2]. PAS is associated with abnormal PA growth, PA hypertension and pulmonary valve insufficiency [3]. These vascular and valve pathologies contribute to reduced exercise capacity, progressive right ventricular dysfunction, right heart failure and decreased life expectancy [4]. Catheter interventions with intravascular stenting are the first line therapy for post-surgical PAS in older patients. Technological advances have recently allowed this therapy to be used in infants and small children. Little is known about the consequences of early PA stent therapy on ventricular function.Ventricular flow analysis using four dimensional flow magnetic resonance imaging (4D Flow MRI) is an increasingly utilized method for studying ventricular function. Studies have shown KE and vortexes to be altered in a variety of cardiovascular diseases [5] including Fontan patients [6].
We hypothesize untreated PAS will cause inefficient RV flow patterns and that early PAS interventions are more effective than delayed interventions for restoring normal RV flow dynamics.
Methods
18 Swine were assigned to four groups: sham (n=4), untreated left PAS (n=4), early intervention (EI) (n=5) and delayed intervention (DI) (n=5). EI had LPA stenting at 6 weeks (5.8 ± 1.4 Kg) with redilation at 10 weeks (32 ± 9 Kg). DI had stenting at 10 weeks. All underwent catheterization and MRI at 20 weeks (55 ± 9 Kg). MRI was performed on a 3.0T imaging system using a short axis balanced steady state free precession (bSSFP) MRI sequence and the 4D Flow MRI sequence PC-VIPR (Phase Contrast Vastly Under sampled Projection Imaging) [17], [18]. Cardiac index (CI) is cardiac output (CO) normalized by bodyweight. End diastolic volume index (EDVI) is EDV normalized by bodyweight.The LV and RV were masked from bSSFP. Kinetic energy (KE), vorticity (ω) and energy dissipation rate (ε) are calculated from the following equations
$KE=1/2 ρ u2$
$ω=curl(u)$
$ε=2μ(S)2$
where ρ is blood density, μ is blood viscosity and S is the strain rate tensor. Results are non-dimensionalized to account for variance in CO and ventricle size. A novel ventricular flow biomarker, the percentage of dissipation due to vorticity, is also quantified based on the theoretical relationship between vorticity and energy dissipation for a vortex ring (Figure 2). The 4 groups were compared using a 1-way ANOVA.
Results
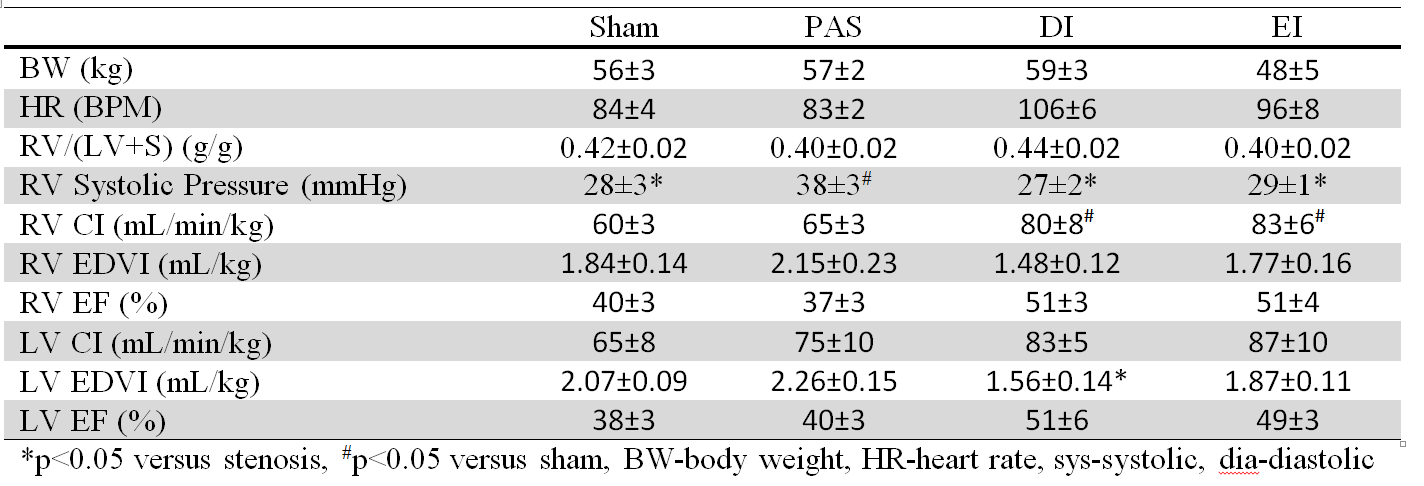
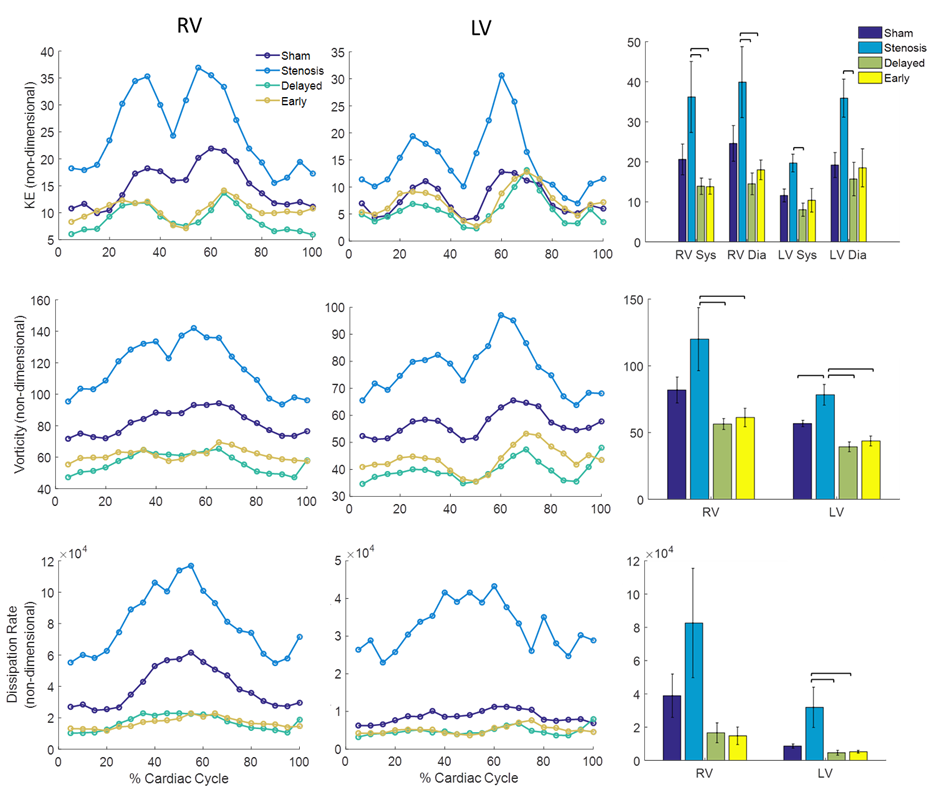
EI and DI had normal RV pressure. LV EDVI was decreased in the delayed intervention group compared to the stenosis group. RV CI was significantly increased in EI and DI. EI and DI trended towards increased heart rate, LV CI, RV EF and LV EF. No differences were found between early and delayed interventions for any measurements.Time curves of non-dimensional KE, vorticity and energy dissipation rate are shown along with systolic and diastolic peak KE, average vorticity and average energy dissipation rate in Figure 1. The stenosis group trended towards higher KE, vorticity and energy dissipation rate in both ventricles. In the LV there were strong trends of the percentage of energy dissipation from vorticity being less in the stenosis group but not in the RV (Fig2).
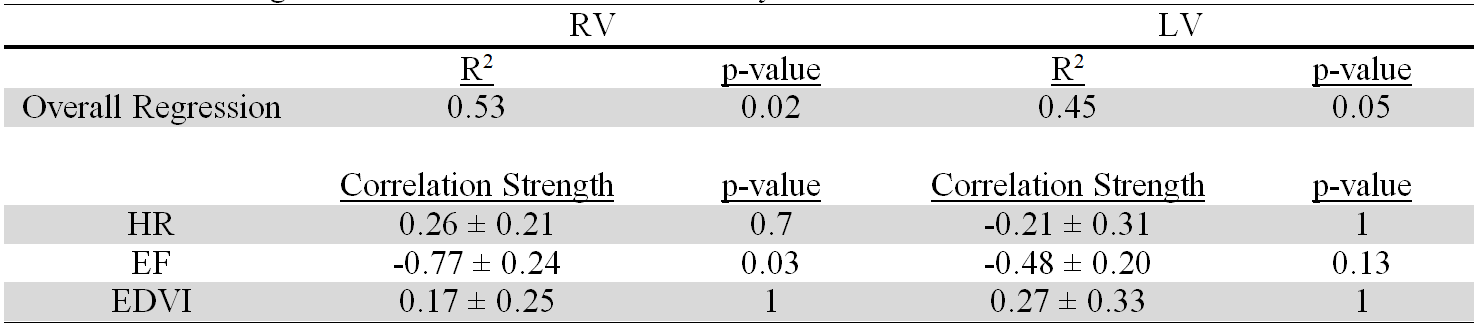
Results from a linear regression of non-dimensional vorticity with the mechanisms to increase cardiac index (HR, EF and EDVI) are shown in Table 2. In the RV there is a strong and significant association between increased EF and decreased vorticity while in the LV the association is moderate and insignificant.
Discussion
In this animal model of PAS intervention is effective but there is no difference between EI and DI. The PA stenosis group with increased RV pressures also has abnormal and inefficient flow in both the RV and the LV. Increased RV EF is associated decreased RV vorticity.The PAS group had mildly increased RV pressures which matches clinical PAS symptoms [7], [8]. The PAS group had abnormal flow in both the RV and the LV despite normal HR, CI and EF values and only the RV being directly affected by the stenosis. The detection of altered RV and LV flow with only mild pulmonary hypertension underscores the sensitivity of 4D Flow MRI derived biomarkers to detect cardiac dysfunction.
Statistical analysis showed strong association between EF and decreased vorticity in the RV but not the LV. RV EF predicts mortality in heart failure patients while the role of LV EF does not have a clear answer. The mechanism by which LV percent energy dissipation from vorticity is reduced in the PAS group is also unknown and future study connecting ventricular contraction with ventricular flow patterns is warranted.
Conclusion
In swine PAS EI and DI were both effective and timing did not affect outcomes. Inefficient LV and RV flow occurred in the PAS group. These results provide physiological insight into PAS and congenital heart disease and also highlight the sensitivity of 4D Flow MRI biomarkers.Acknowledgements
This investigation was supported by the Clinical and Translational Science Award (CTSA) program, through the NIH National Center for Advancing Translational Sciences (NCATS), grant UL1TR002373 (AR, LL and CF), the NIH Ruth L. Kirschstein National Research Service Award T32 HL 007936 from the National Heart Lung and Blood Institute to the University of Wisconsin-Madison Cardiovascular Research Center (RP). The content is solely the responsibility of the authors and does not necessarily represent the official views of the NIH.References
[1] J. I. E Hoffman and R. Christianson, “Congenital Heart Disease in a Cohort of 19,502 Births With Long-Term Follow-Up,” Am. J. Cardiol., vol. 42, no. 4, pp. 641–7, 1978.
[2] J. C. Hirsch, R. S. Mosca, and E. L. Bove, “Complete Repair of Tetralogy of Fallot in the Neonate Results in the Modern Era.”
[3] M. A. Gatzoulis, S. Balaji, S. A. Webber, S. C. Siu, J. S. Hokanson, C. Poile, M. Rosenthal, M. Nakazawa, J. H. Moller, P. C. Gillette, G. D. Webb, and A. N. Redington, “Risk factors for arrhythmia and sudden cardiac death late after repair of tetralogy of Fallot: a multicentre study,” Lancet, vol. 356, no. 9234, pp. 975–981, Sep. 2000.
[4] J. Rhodes, A. Dave, M. C. Pulling, R. L. Geggel, G. R. Marx, D. R. Fulton, and Z. M. Hijazi, “Effect of Pulmonary Artery Stenoses on the Cardiopulmonary Response to Exercise Following Repair of Tetralogy of Fallot,” Am. J. Cardiol., vol. 81, no. 10, pp. 1217–1219, May 1998.
[5] N. Al-Wakeel, J. F. Fernandes, A. Amiri, H. Siniawski, L. Goubergrits, F. Berger, and T. Kuehne, “Hemodynamic and Energetic Aspects of the Left Ventricle in Patients With Mitral Regurgitation Before and After Mitral Valve Surgery.”
[6] D. R. Rutkowski, G. Barton, C. J. François, H. L. Bartlett, P. V Anagnostopoulos, and A. Roldán-Alzate, “Analysis of Cavopulmonary and Cardiac Flow Characteristics in Fontan Patients: Comparison With Healthy Volunteers,” 2019.
[7] O. Wieben, C. Francois, and S. B. Reeder, “Cardiac MRI of ischemic heart disease at 3 T: Potential and challenges,” Eur. J. Radiol., vol. 65, no. 1, pp. 15–28, 2008.
[8] C. J. François, S. Srinivasan, M. L. Schiebler, S. B. Reeder, E. Niespodzany, B. R. Landgraf, O. Wieben, and A. Frydrychowicz, “4D cardiovascular magnetic resonance velocity mapping of alterations of right heart flow patterns and main pulmonary artery hemodynamics in tetralogy of Fallot,” J Cardiovasc Magn Reson, vol. 14, p. 16, 2012.
[9] D. A. Harrison, L. Harris, S. C. Siu, C. J. MacLoghlin, M. S. Connelly, G. D. Webb, E. Downar, P. R. McLaughlin, and W. G. Williams, “Sustained Ventricular Tachycardia in Adult Patients Late After Repair of Tetralogy of Fallot,” J. Am. Coll. Cardiol., vol. 30, no. 5, pp. 1368–1373, Nov. 1997.
Figures