2114
4D Flow MRI reveals abnormal turbulent kinetic energy elevation of the replacement aorta for the aortic dissection1Nippon Medical School Hospital, Tokyoto Bunkyoku, Japan
Synopsis
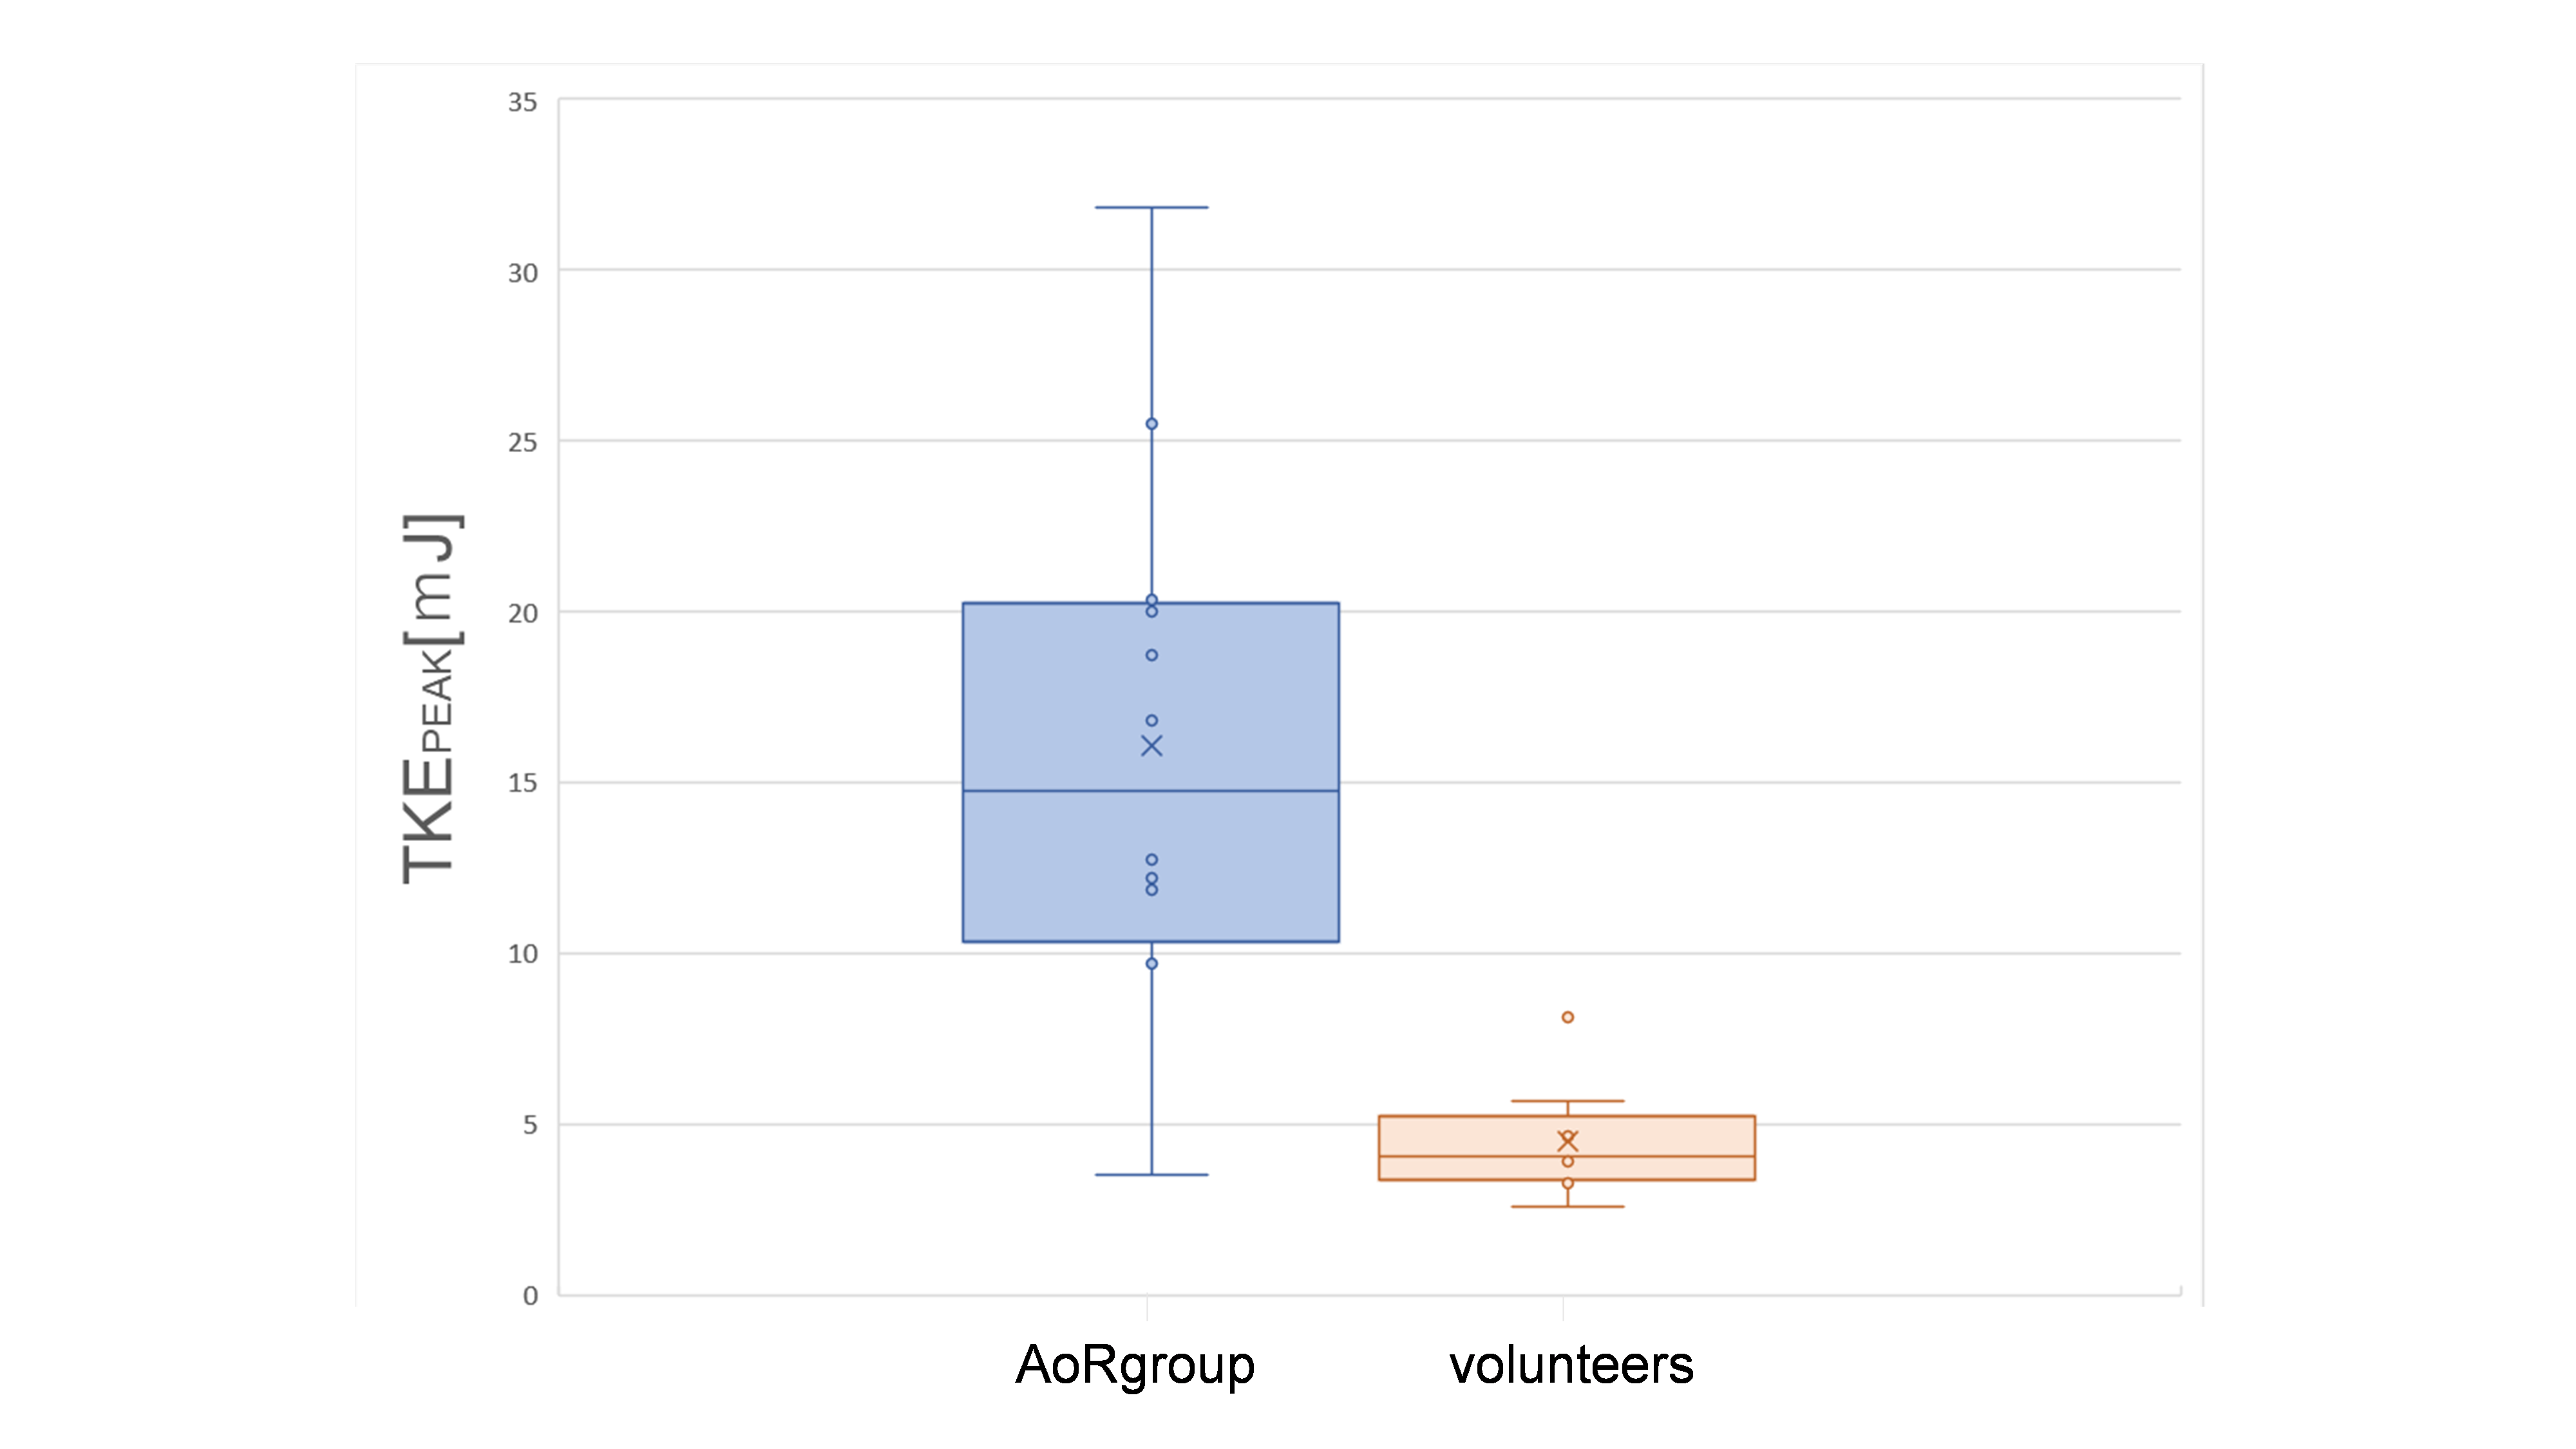
The purpose of this study was to evaluate turbulent kinetic energy (TKE) after aorta replacement (AoR) using 4D Fow MRI. We recruited 13 patients undergoing AoR for the aortic dissection and 9 normal volunteers. The TKEpeak of AoR group was significantly higher than those of volunteers (16.09 ± 7.75 [3.51–31.83] mJ vs. 4.50 ± 1.64 [2.57–8.13] mJ, p < 0.001). The TKE elevation was mainly derived from the distal part of ReAo (p=0.001).
Introduction
The aortic dissection after aorta replacement (AoR) requires long-term follow-up. As the imaging evaluation, the morphological changes distal to replaced aorta (ReAo) are generally checked. However, some reports describe only the morphological evaluation is insufficient and hemodynamics should be considered [1,2]. The fact that AoR has a clear impact on the turbulent flow (TF) has already shown [3,4]. The TF by ReAo is associated with energy loss causing the increase of cardiac load and with altered vessel wall stress resulting in dilatation of distal aorta [2,5]. Recently, turbulent kinetic energy (TKE) estimation based on 4D Flow MRI enables to visualize and quantify the abnormal TF. However, there has been no report assessing TKE derived from ReAo. The purpose of this preliminary study was threefold. First, to validate if the image quality of 4D Flow MRI was good enough to evaluate turbulence in the patients after AoR. Second, to reveal whether TKE increase exists in the ReAo by comparing to healthy volunteers. Third, to clarify the source of the turbulence of the ReAo morphologically.Methods
Subjects;From April 2018 to September 2019, we recruited 13 patients (56.8±13.4 years old, 10 males) with AoR for type A aortic dissection and 9 normal volunteers (30.9±3.0 years old, 6 males). Imaging and reconstruction Cardiac MRI including 4D Flow MRI using a 3.0-T MRI unit (Achieva; Philips Healthcare, Best, The Netherlands) was performed. The parameters were as follows; TR/TE = 4.0 / 2.7ms; FA = 11 degrees; Resolution = 2.0*2.0*2.5mm; multi-VENC acquisition = 50–100–300 cm/s; heart phase, 15–21 depending on heart rate; prospective triggering; k-t PCA acceleration factor, 5–7; free breath acquisition; and acquisition time 10–15 min. TKE was calculated from the magnitude images of multi-VENC data combined with Bayesian estimation by using offline reconstruction software (CRECON, Gyro Tools, Zurich, Switzerland). It takes approximately 15 minutes.
Analysis;
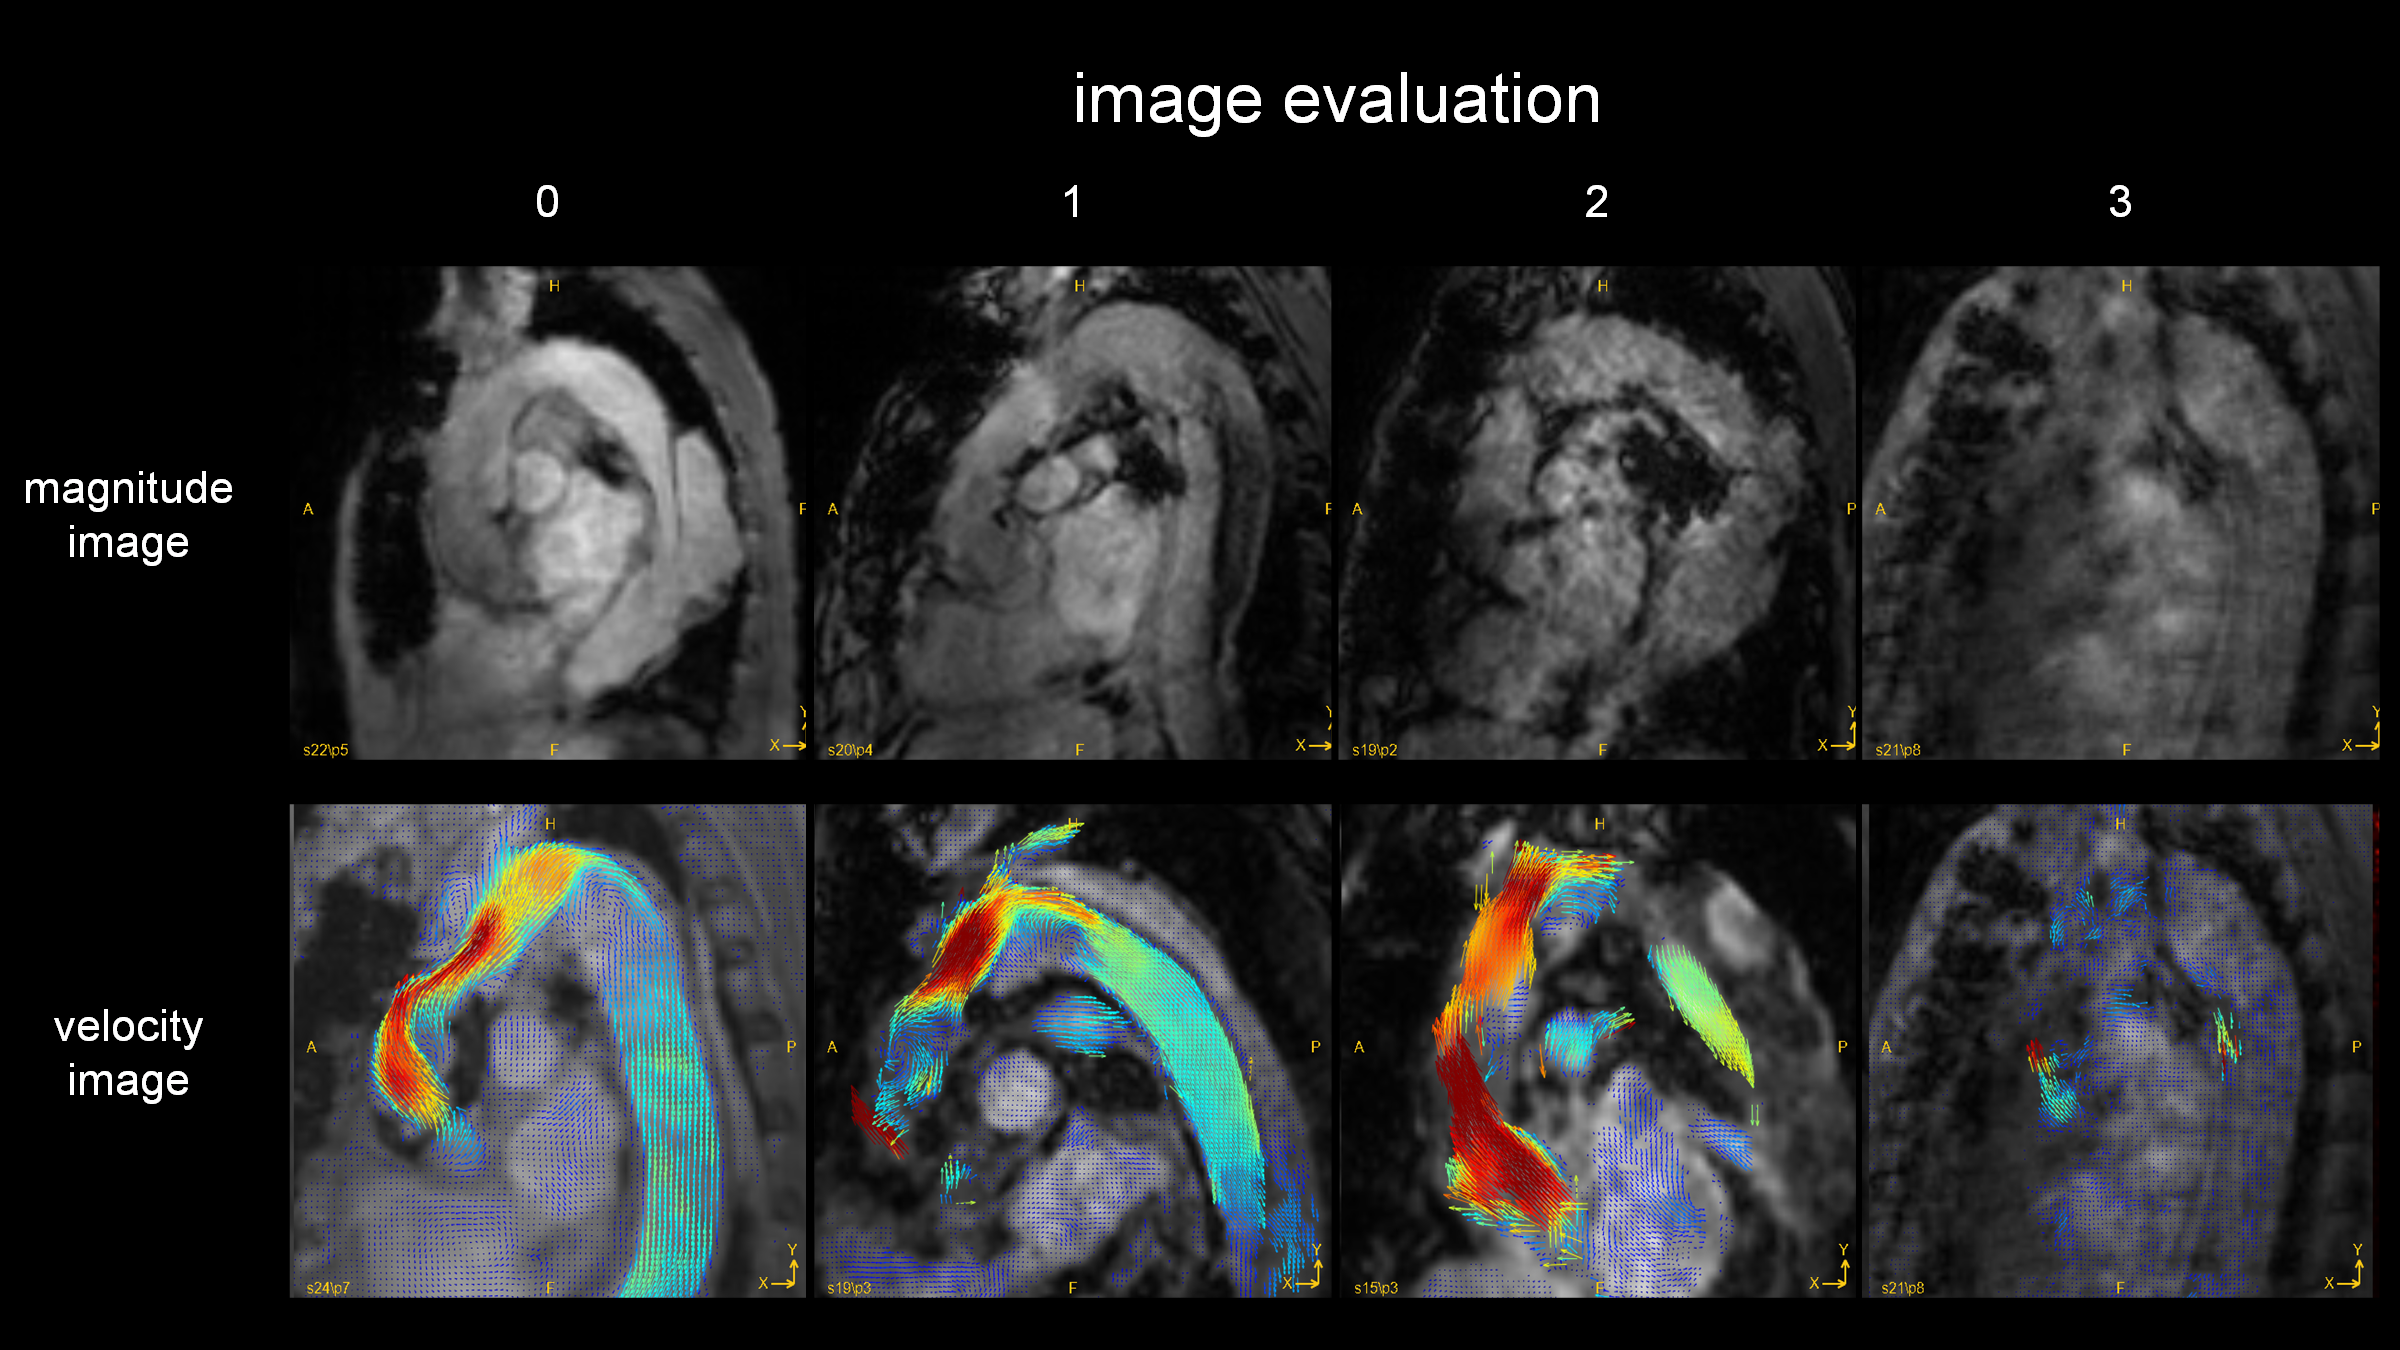
GT Flow (GyroTools, Zurich, Switzerland) was used for visual analysis and TKE quantification. The VOI from left ventricular to aortic arch was drawn semi-automatically based on phase-contrast MRA imaging derived from 4D Flow MRI data. We empirically chose this region because there was no significant TKE increase distal from aortic arch. TKEphase is calculated as the sum of entire VOI at each cardiac phase. TKEpeak was the highest TKEphase in the all cardiac phase. TKEsum was the sum of TKEphase during the entire cardiac cycle. First, to assess the magnitude and velocity imaging data, the visual quality was classified into 4 patterns. The poor images were excluded in further study (Fig. 1). Second, to clarify the blood flow pattern in the patients, TKEpeak was compared between AoR group and volunteers by using Mann-Whitney U-test. Third, to evaluate the correlation between the elevation of TKE and the flow pattern in the ReAo, we visually classified the grade of TF into 3 levels (0=slightly elevated, 1=elevated, 2=extremely elevated) at each proximal, middle and distal part of the ReAo. TKEpeak was compared with the classification at each point by using Pearson’s test.
Results
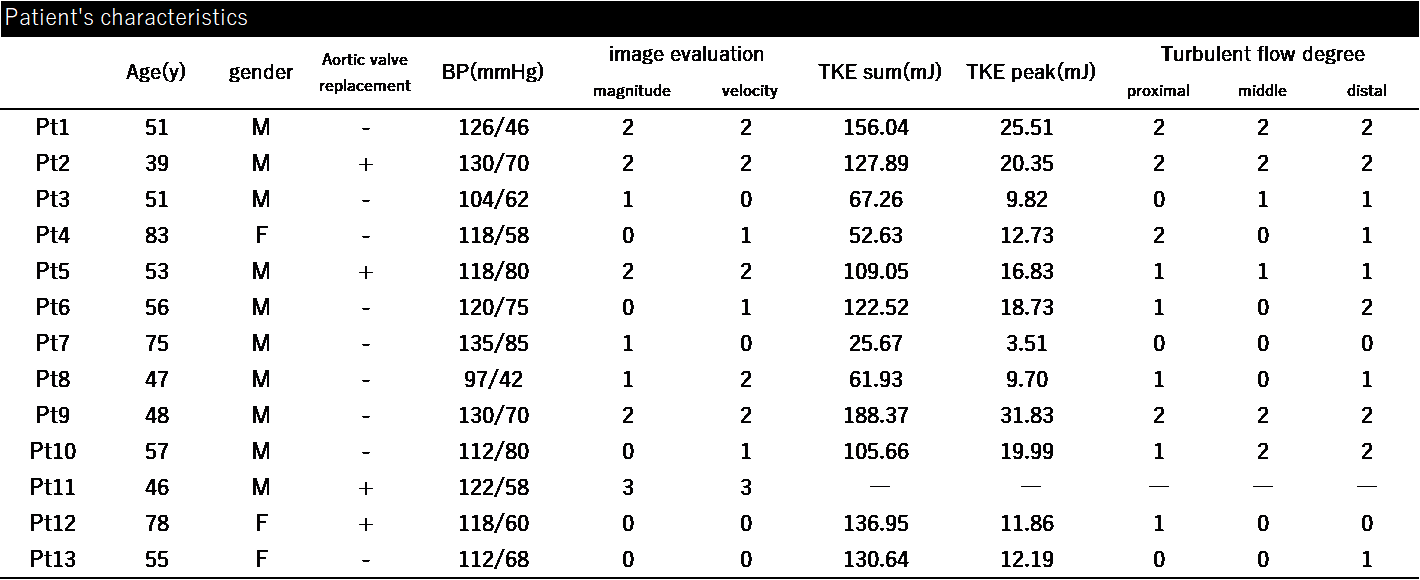
The patients’ characteristics were shown in Table 1. Out of 13 patients, only one case had clinically relevant artifact (score=3) both in magnitude and velocity images. After excluding one case, we evaluated 12 patients (57.8 ± 13.6 years old, 9 males) and 9 normal volunteers (30.9 ± 3.0 years old, 6 males). The TKEpeak of AoR group was significantly higher than those of volunteers (16.09 ± 7.75 [3.51–31.83] mJ vs. 4.50 ± 1.64 [2.57–8.13] mJ, p < 0.001) (Fig. 4). The total elevation of TKEpeak was mainly correlated with the elevation of TKEpeak at the distal part of ReAo compared with proximal or middle part of ReAo (p=0.001 vs. p=0.008 and p=0.004, respectively).Discussion
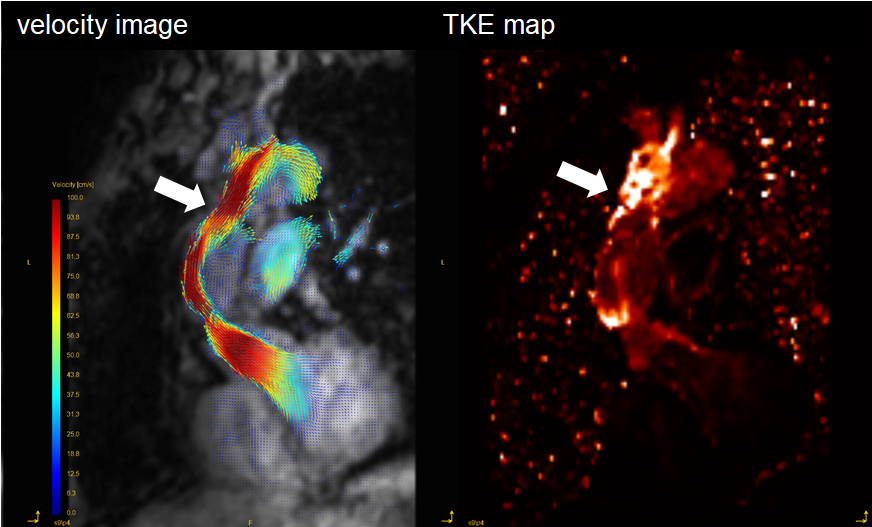
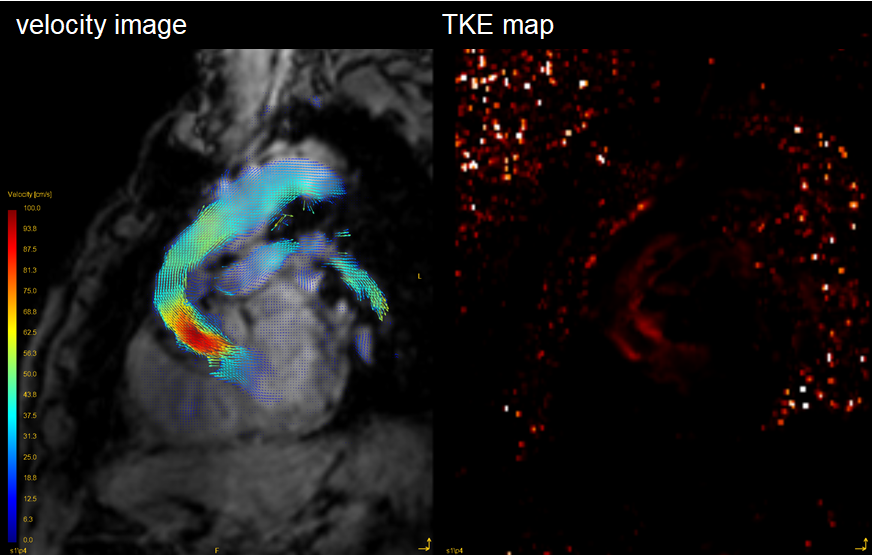
The current study showed image quality of 4D Flow MRI was maintained after post-AoR operation. The significant TKE elevation was observed in ReAo though there was wide diversity in patients. The abnormal TKE elevation was mainly derived from the distal part of ReAo. Our results are in line with the studies which describes that ReAo has a strong effect on TF [3,4]. Generally, TF is generated by rapid contraction, obstruction, and expansion of the outflow tract, which result in energy loss [2]. The morphological features in the distal part of ReAo may cause the elevation of TKE. As for aortic stenosis (AS) or the bicuspid valve, it is known that energy loss is generated in the distal part of the narrow segment, which makes TKEpeak higher. It is also shown to be in correlation with the severity of AS [6]. Compared with the previous study validating TKEpeak based on 4D Flow MRI in patients with aortic stenosis, TKEpeak in ReAo can be considered as the moderate elevation (26.1 ± 9.9 mJ vs. 16.09 ± 7.75 mJ) [6]. Interestingly, TKE value in the AoR group was highly heterogeneous. Regarding the evaluation of turbulence, TKE estimation may have a potential for further evaluation after AoR.Conclusion
The TKE is significantly higher in AoR group than in volunteers, which is mainly derived from the distal part of ReAo. TKE estimation based on 4D Flow MRI may help us to understand the clinical course in the patients with post-operation of aortic repair.Acknowledgements
References
1. Andrew G. Sherrah, MBBS, Fraser M. Callaghan, et al. Multi-Velocity Encoding Four-Dimensional Flow Magnetic Resonance Imaging in the Assessment of Chronic Aortic Dissection. AORTA, 2017; volume 5, Issue 3:80-90.
2. A.J. Barker, P. van Ooij, K. Bandi, et al. Viscous Energy Loss in the Presence of Abnormal Aortic Flow. Magnetic Resonance in Medicine, 2014; 72(3): 620–628.
3. Zhuo Cheng, Emaddin Kidher, Omar A. Jarral, et al. Assessment of Hemodynamic Conditions in the Aorta Following Root Replacement with Composite Valve-Conduit Graft. Annals of Biomedical Engineering, 2016; 44(5): 1392–1404
4. Omar A. Jarral, Matthew K.H. Tan, Mohammad Yousuf Salmasi, et al. Phase-contrast magnetic resonance imaging and computational fluid dynamics assessment of thoracic aorta blood flow: a literature review. European Journal of Cardio-Thoracic Surgery, 2019.
5. Yusuke Takei, Keiichi Itatani, Shohei Miyazaki, et al. Four-dimensional flow magnetic resonance imaging analysis before and after thoracic endovascular aortic repair of chronic type B aortic dissection.Interactive CardioVascular and Thoracic Surgery, 2019; 28: 413–420
6. Christian Binter, Alexander Gotschy, Simon H. Sundermann, et al. Turbulent Kinetic Energy Assessed by Multipoint 4-Dimensional Flow Magnetic Resonance Imaging Provides Additional Information Relative to Echocardiography for the Determination of Aortic Stenosis Severity. Circ Cardiovasc Imaging 2017; 10
Figures