2113
Measuring left ventricular diastolic function with dual-echo dual velocity encoding PC-MRI: Clinical validation1Physics, University of Houston [Main Campus], Houston, TX, United States, 2Department of Diagnostic and Interventional Radiology, Baylor St. Luke's Medical Center, Houston, TX, United States, 3Baylor St. Luke's Medical Center, Houston, TX, United States, 4University of Houston [Main Campus], Houston, TX, United States
Synopsis
A common clinical index of left ventricular (LV) diastolic function is the ratio of peak trans-mitral blood velocity (E) to mitral annular velocities (Em) during early diastole. Here, we provide clinical validation of a single TR, dual-echo approach wherein the first and second echoes are velocity sensitized to encode E and Em respectively.
Introduction
More people die of heart disease than any other world-wide extracting a tremendous human and economic toll on society. As nearly one of two heart failure patients have preserved ejection fraction (HFpEF), there is an increased interest in the estimation of diastolic function. A widely used echocardiographic metric for evaluating LV diastolic function is the ratio of transmitral velocity (E) to mitral annular velocity (Em) during the early filling phase of diastole. Measuring E/Em, using conventional phase contrast MRI (PC-MRI) is challenging. As Em is several fold lower than E, it is challenging to simultaneously measure both velocities with adequate sensitivity with a single velocity sensitivity (VENC value), e.g., the traditional approach of setting VENC slightly above the maximum velocity (e.g., E in this instance) will have sub-optimal velocity to noise ratio (VNR) for estimating Em [1]. To circumvent this, traditional PC-MRI approaches measure E and Em, independently over the course of two repetition times (TRs), at the cost of prolonged scan time. We have previously described a dual echo PC-MRI approach, in which the first and second echoes are sensitized to velocities in the range of E and Em respectively[2].Purpose: (1) To demonstrate the clinical feasibility of a dual echo PC-MRI technique with velocity sensitivities suitable to encode transmitral blood velocities with the first echo, and mitral annular velocities with the second echo. (2) To compare the performance of the dual-echo dual velocity (DEDV) phase contrast MRI in the measurement of E/Em in normal and clinical subjects.
Materials and Methods:
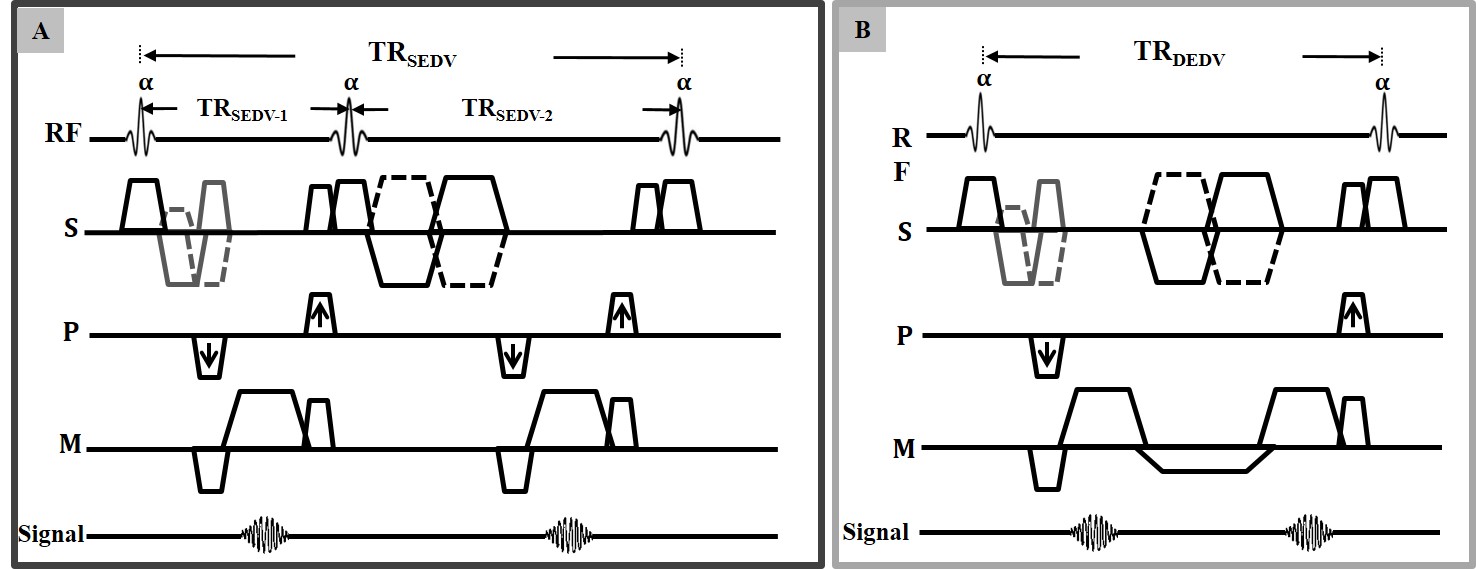
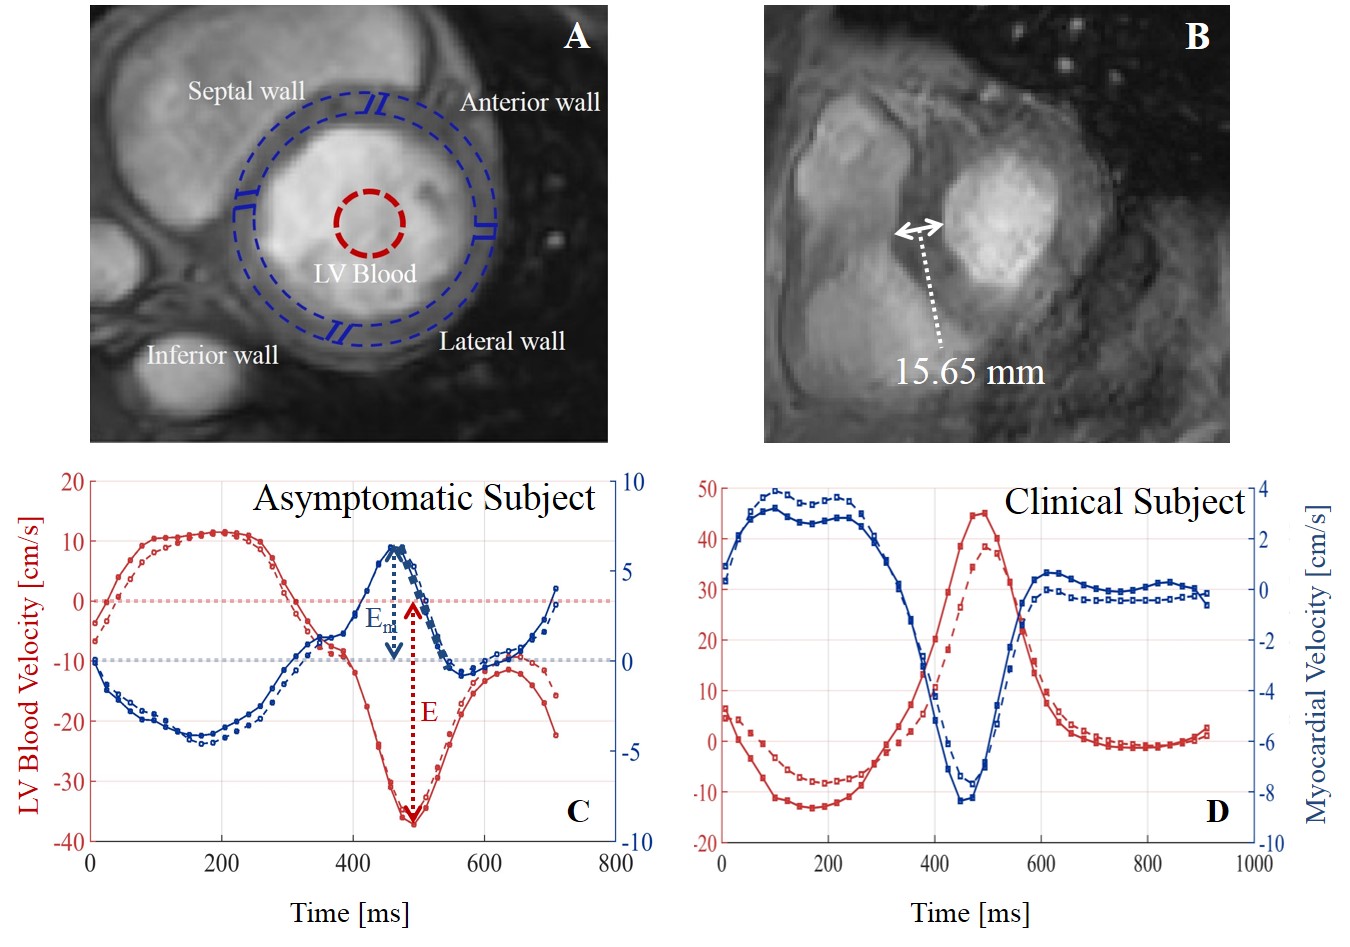
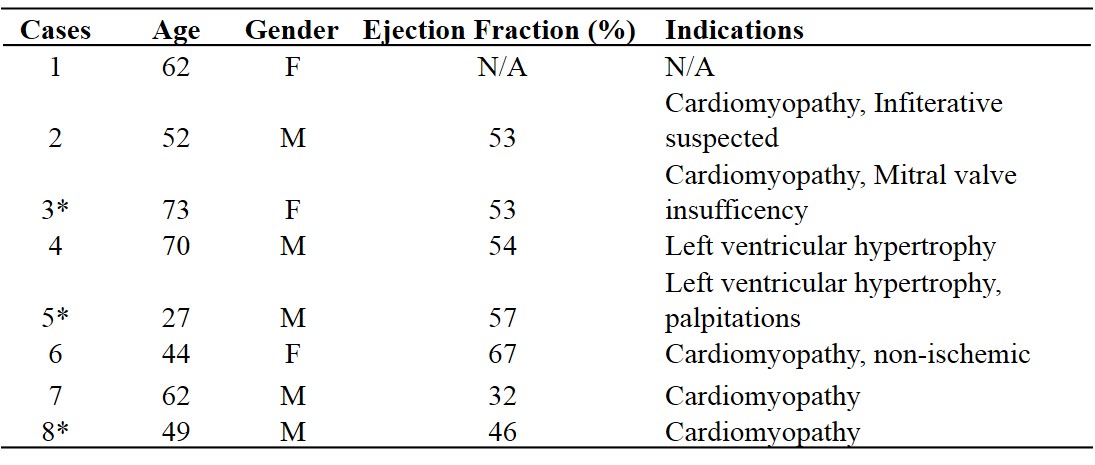
Subjects: 6 asymptomatic subjects (5 males, age: 49 $$$\pm$$$ 13 yrs), and 8 clinical patients (details summarized in Table 1) were imaged on a commercial 3T MR imager (Ingenia, Philips Healthcare) with VCG gating. A 32 element thoracic phased array coil was used for signal reception. All subjects provided written informed consent. MRI acquisition: A custom dual echo pulse sequence that allowed the prescription of different VENC values for a dual echo scan was created (Figure 1) for a free-breathing segmented k-space PC-MRI sequence. PC-MRI of the short axis slice positioned below and parallel to the mitral valve plane was acquired with the DEDV pulse sequence with velocity sensitivity for the first and the second echoes set at: 150 cm/s and 20 cm/s; acquired voxel size: 2 x 2 x 8 mm$$$^3$$$; temporal resolution: 20 ms. The same slice was acquired with conventional SEDV technique with VENC values set at 150 cm/s and 20 cm/s in two separate scans. All other parameters, such as prescribed FOV, acquired voxel size, flip angle (15$$$^\circ$$$), and NSA (2), were kept identical for both the SEDV and DEDV scans.Data Analysis: Trans-mitral blood and myocardial tissue velocities were estimated from regions of interest (ROIs) circumscribing LV blood and myocardium (Figure 2), from PC-MRI acquired with high and low velocity sensitivities respectively. Myocardial region was further subdivided into equiangular segments to extract Em of septal, inferior, lateral, and anterior walls. E/Em was calculated for each segment using both techniques as indicated in Figure 2 (C and D) for symptomatic and clinical subjects. The positive axis of velocity was defined as tissue motion towards the apex of the heart. For classification purposes, E/Em ratio greater than 15 (or greater than 12) in the septal region (or lateral) is indicative of elevated LV pressure[3].
Results
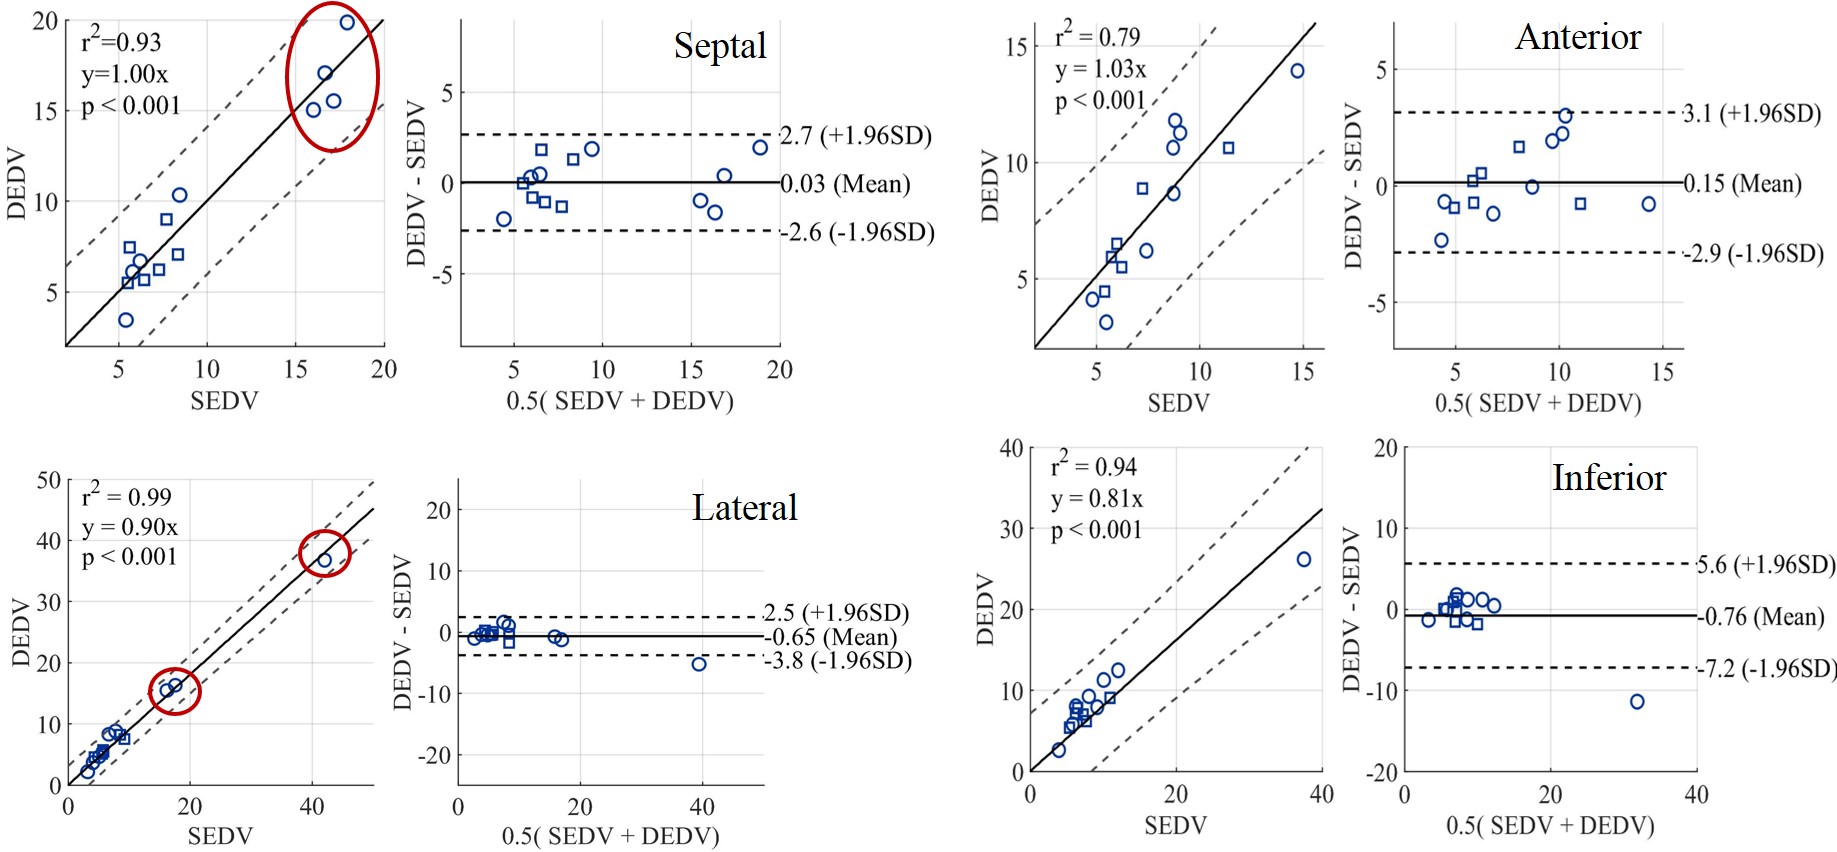
The mean scan time for SEDV and DEDV techniques were: 7.2$$$\pm$$$2.4 min versus 4.5$$$\pm$$$2.3 min, respectively. Representative mean velocity versus time curves derived from phase contrast images acquired using the DEDV and conventional SEDV methods for asymptomatic and clinical subjects are shown in Figure 2 (C and D). Figure 2B shows a magnitude image obtained at peak diastole, with a wall thickness of about 15.7 mm (> 11 mm normal threshold), which may be associated with the lower peak early diastolic filling velocity seen in the myocardium (Figure 2D). 7 out of 8 clinical subjects had preserved ejection fraction. E/Em ratios estimated using the SEDV and DEDV methods were highly correlated (Figure 3), and showed elevated estimates in the septal (and lateral) region of the myocardium for 50% (and 37.5%) of the clinical subjects. E/Em obtained in the anterior and lateral walls of the myocardium were mostly in the normal or intermediate zone, except for a single subject that showed E/Em ratio as high as 37.5 in the inferior wall. 3 clinical subjects had E/Em ratios in the normal range, and were diagnosed to be normal as well. All asymptomatic volunteers showed E/Em in the normal zone or in the lower intermediate zone.Discussion
(a) Imparting two velocity sensitivities within one TR reduces scan time by sharing the temporal overhead associated with slice excitation, spoiling, etc, and can be relevant for dual VENC 4D flow MRI for improved VNR.(b) The DEDV method can be used to estimate E/Em that is comparable to that obtained with the conventional SEDV method in asymptomatic and clinical subjects.
(c) The estimated E/Em ratios are useful for evaluating diastolic function, but more diastolic indices such as deceleration time (DT), E/DT will improve diagnosis of diastolic dysfunction[4].
(d) The results obtained need to be confirmed in a larger clinical study.
Acknowledgements
No acknowledgement found.References
[1] N. J. Pelc, R. J. Herfkens, A. Shimakawa, and D. R. Enzmann, ''Phase contrast cine magnetic resonance imaging'', Magn. Reson. Q., vol. 7, no. 4, pp. 229–254, 1991.
[2] A. Ajala, J. Zhang, E. Buko, L Wang, D, Dees, J. Swaab, B. Cheong, P.-H. Hor, and R. Muthupillai, ''Simultaneous Measurement of Myocardial and Blood Flow Velocities using a DualEcho Dual Velocity Encoding (DEDV) Phase-Contrast MRI (PC-MRI) Approach for Evaluating LeftVentricular (LV) Diastolic Function'' ISMRM 27th Annual Meeting & Exhibition (7387), 2019.
[3] S. F. Nagueh et al., “Recommendations for the Evaluation of Left Ventricular Diastolic Function by Echocardiography,” Eur J Echocardiogr, vol. 10, no. 2, pp. 165–193, Mar. 2009.
[4] O. F. Sharifov, C. G. Schiros, I. Aban, T. S. Denney, and H. Gupta, “Diagnostic Accuracy of Tissue Doppler Index E/e’ for Evaluating Left Ventricular Filling Pressure and Diastolic Dysfunction/Heart Failure With Preserved Ejection Fraction: A Systematic Review and Meta-Analysis,” J Am Heart Assoc, vol. 5, no. 1, Jan. 2016.
Figures