2111
Hemodynamic assessments of intracranial aneurysm (IA) following hypotensor medication: A pilot study1Center for Biomedical Imaging Research, Department of Biomedical Engineering, Tsinghua University, Beijing, China, 2Department of Interventional Neuroradiology, Beijing Neurosurgical Institute and Beijing Tiantan Hospital, Capital Medical University, Beijing, China
Synopsis
In this study, we utilize 4D-flow MRI to investigate the relationship between hemodynamics and blood pressure change following hypotensor medication. Statistics indicated that FlowAPA significant increased when blood pressure drops. No differences were found in FlowIA, VAPA and VIA. This is probably because hypotensor medication has a vasodilatory effect, the widening of blood vessel will result in an increased flow. The results of this pilot study suggested that an acute blood pressure drop affects hemodynamic conditions of APA rather than IA.
Introduction
The rupture of intracranial aneurysm (IA) is the most common cause of subarachnoid hemorrhage (SAH), resulting in patient death and disability1. Hypertension is considered as an important risk factor of IA formation2-4, and blood pressure control has been reported as an effective treatment to prevent IA rupture5. There is a hypothesis that hypotensor medication treats IA by affecting its hemodynamics. However, no direct observational evidence has been provided to verify this hemodynamic hypothesis. Therefore, it is essential to evaluate local IA hemodynamics in both pre- and post-hypotensor medication, which helps further understanding the role of blood pressure in IA mechanism. In this study, we utilized 4D-flow MRI to investigate the relationship between hemodynamics and blood pressure change following hypotensor medication.Methods
Study Population: 10 patients (5 males and 5 females, age range: 39 ~ 72 years) with IA diagnosed by time-of-flight (TOF) were included in this study. Measurement of systolic and diastolic blood pressure at 8 am in the morning when the patient did not take antihypertensive drugs for 24 hours. All patients’ blood pressure were higher than 130/85 mmHg. Written informed consents were obtained from all patients.MR Experiments: All MRI scan were performed on a 3.0T MRI scanner (Philips Achieva, Best, Netherlands) with a 32-channel head coil. 4D-flow MRI was used for hemodynamic evaluation. Scan parameters were: TR/TE = 8.0/3.6 ms, FOV = 160 x 160 x 30 mm3, voxel size = 1 x 1 x 1 mm3, VENC = 120 cm/s. MR scan was conducted in both pre- and post-hypotensor medication (10 mg of the Nifedipine) with a 3-6 hour interval. Blood pressure was measured before and after the medication.
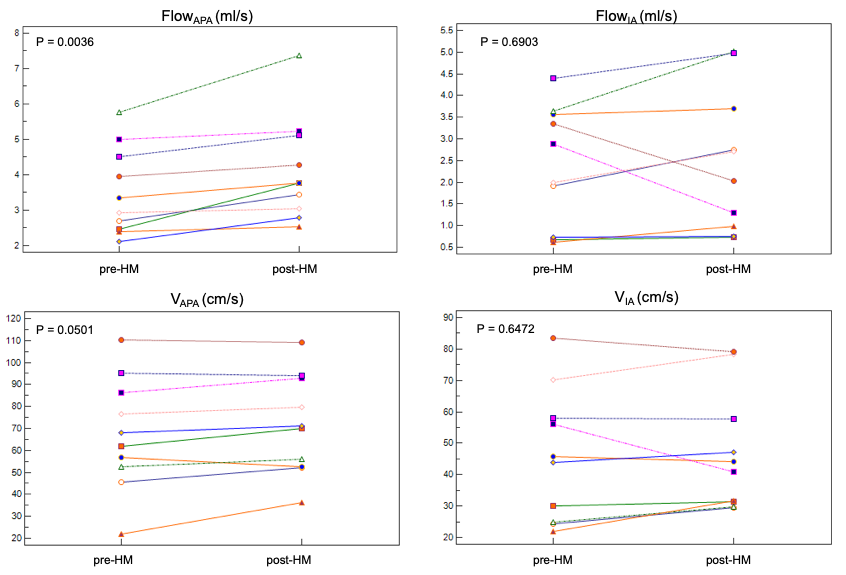
Data Analysis: To monitor the change of the blood supply of the brain and the hemodynamic status inside the aneurysm, maximum through-plane velocity (VAPA, cm/s) in adjacent parent artery (APA), maximum through-plane velocity (VIA, cm/s) within aneurysm, average blood flow in APA (FlowAPA, ml/s), and maximum blood flow in IA (FlowIA, ml/s) were measured before and after hyportensor medication. All hemodynamic measurements were implemented at the time when peak velocity appears. Cross-sectional plane, which is perpendicular to the streamline containing the maximum velocity point with IA and APA, was created. Contours were drawn manually. Parameters were measured in GTFlow, version 2.2.15 (GyroTools, Zurich, Switzerland), as shown in Figure.1.
Statistical analysis: All statistical analysis were conducted by MedCalc (MedCalc Software, Mariakerke, Belgium). The difference of VAPA, VIA, FlowAPA, FlowIA between pre- and post-hypotensor medication were evaluated by paired sample t-test. The level of statistical significance was set at p < 0.05.
Results
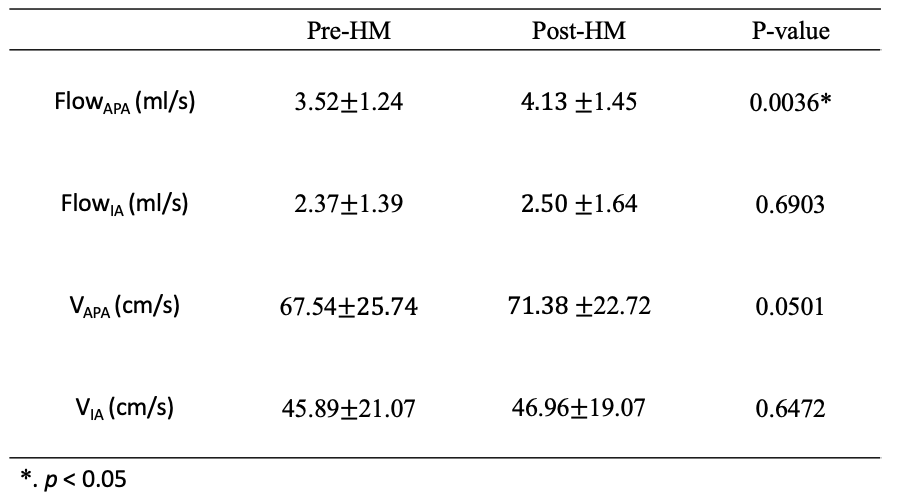
After hypotensor medication for 3-6 hours, all patients’ blood pressure decreased from a range of 130/85~194/120 mmHg by 10~30 mmHg. Figure.2 showed one example of IA flow pattern before and after hypotensor medication. Figure.3 showed the change of FlowAPA, FlowIA, VAPA, VIA of all patients before and after blood pressure deduction. Furthermore, Paired samples t-test indicated that FlowAPA (p = 0.0036) significantly increased when blood pressure drops. There is no difference of FlowIA (p = 0.6903), VAPA (p = 0.0501) and VIA (p = 0.6472) before and after blood pressure drop, as shown in Table.1.Discussion and Conclusion
In this study, we assessed and compared the difference of hemodynamics in IA before and after hypotensor medication. Statistics indicated that FlowAPA significantly increased when blood pressure drops from a range of 10~30 mmHg in 3-6 hours, while no differences were found in VAPA. This is probably because the hypotensor medication has a pronounced vasodilatory effect6. By widening Arteries and arterioles and APA, hypotensor medication decreases systemic vascular resistance (SVR), resulting in an increased blood flow to tissues7. However, as for the internal condition of the aneurysm, hypotensor medication nifedipine may has limited expansion on the aneurysm wall and lesions of vessel. So FlowIA didn’t change when blood pressure drops. Therefore, the results of this pilot study suggested that an acute blood pressure drop affects hemodynamic conditions of APA rather than IA.Acknowledgements
No acknowledgement found.References
1. Hijdra A et al. Journal of Neurosurgery, 1987, 67(1):29-33.
2. Bonita R. Stroke 1986, 17(5):831.
3. Monte SM et al. Am J Med 1985, 78(6):957-964.
4. Inci S et al. Surgical Neurology, 2000, 53(6):530-542.
5. Mayberg MR et al. Circulation, 1994, 90(3):2592-2605.
6. Bertel O et al. The American Journal of Medicine, 1985, 79(4A):31-35.
7. Thurston G B. Microvascular Research, 1976, 11(2):133-146.
Figures