2109
Left Ventricular Reverse Remodeling in Dilated Cardiomyopathy: Does Ejection Fraction Reflect Subtle Ventricular Dysfunction?1Biomedical Imaging Center, Pontificia Universidad Católica de Chile, Santiago, Chile, 2Electrical Engineering, Pontificia Universidad Católica de Chile, Santiago, Chile, 3Millennium Nucleus for Cardiovascular Magnetic Resonance, Santiago, Chile, 4Guy's and St Thomas' NHS Foundation Trust, London, United Kingdom, 5School of Imaging Sciences and Biomedical Engineering, King's College London, London, United Kingdom, 6Department of Mechanical Engineering, Universidad Técnica Federico Santa María, Santiago, Chile, 7Radiology Department, School of Medicine, Pontificia Universidad Católica de Chile, Santiago, Chile
Synopsis
An important number of patients with dilated cardiomyopathy have improved their left ventricular function with an optimal treatment. However, it is not well understood whether remodeling represents a recovery in left ventricular (LV) hemodinamics1. In this abstract, we discuss the capacity of the ejection fraction to represent disease remission, by analyzing LV blood flow.
Introduction
Left ventricular reverse remodeling (LVRR) has been validated as a key prognostic tool in dilated cardiomyopathy (DCM)1. This is defined as the improvement in LV function. Several studies have reported an improvement above a threshold level, often set at LV ejection fraction (LVEF) 50%1,2,3,4. As ventricular flow is altered in the early stages of remodeling, it is probable that the flow itself can influence disease progression. Insights about the quantification of LV blood flow are available now by 4D flow MR5. Previous studies have demonstrated altered LV flow patterns in seemingly compensated DCM patients6,7. Therefore, an LVEF-based definition of recovery may also be inadequate as subtle dysfunction in cardiac strain or energetics, even in the presence of apparently normalized LVEF8. The purpose of this study was to investigate the relationship between LVEF and blood flow parameters during cardiac remodeling.Methods
Multi-slice 2D cine balanced steady-state free-precession (b-SSFP) and 4D flow MRI data of 12 healthy volunteers and 13 DCM patients were acquired in a clinical MR Scanner of 1.5T (Philips Achieva, Best, The Netherlands). At the time of diagnosis, DCM was defined as the presence of symptoms and signs of heart failure with echocardiographic signs of ventricular enlargement and systolic myocardial dysfunction in the absence of hypertension, valve diseases or significant coronary artery disease sufficient to cause global systolic impairment, in accordance with the definition of the European Society of Cardiology9. Our DCM cohort all received treatment following the heart failure guidelines. Five patients in the DCM cohort responded to treatment, with an improved LVEF at the time of CMR imaging (range 51-66%). To process the 4D Flor MRI, registration between the multi-slice b-SSFP and the 4D Flow MRI data was used quaternion-derived rotation matrix performed in the Eidolon Software (King’s College London, London)10. Then, we double the number of slices in the b-SSFP images. LV endocardium was delineated semi–automatically in the short-axis b-SSFP images, using the software Segment v2.2 R6410 (Medviso AB, Lund, Sweden)11-13. Segmentation curves were exported and converted to LV binary mask and tetrahedral meshes were generated. We estimated the cardiac phases under study, and we transfer the velocity information at each node of the mesh from the 4D Flow MRI datasets using a cubic interpolation. Then, using a finite element approach, we calculated velocity, energy loss, vorticity, helicity density, viscous dissipation and kinetic energy14-15. We used the software GraphPad Prism version 6.0.1 (GraphPad software Inc., San Diego, California, USA) for all statistical analysis. Global hemodynamic parameters were compared using the Kruskal-Wallis test, with statistical significance assigned at p-values < 0.05. These data were displayed in box-whisker plots.Results
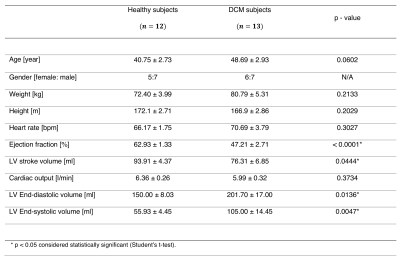
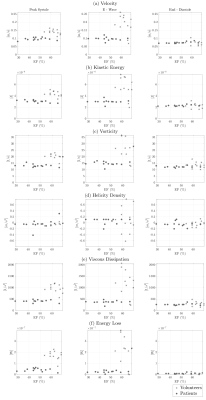
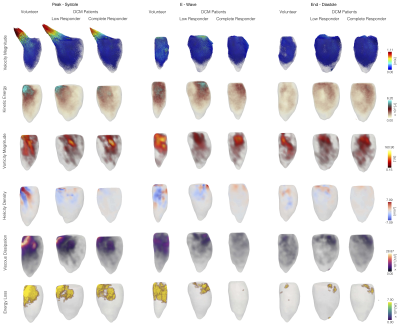
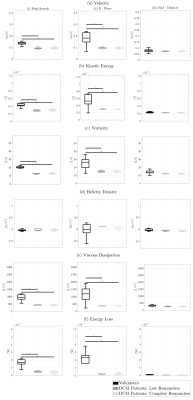
Table 1 shows the clinical data of DCM patients and volunteers. Statistical differences were found in ejection fraction, LV end-diastolic volume, and LV end- systolic volume. In figure 1, we show each global hemodynamic parameter vs ejection fraction. It cannot be appreciated any linear relations between any hemodynamic parameter and ejection fraction for the whole group of data. Figure 2 shows the 3D maps each hemodynamic parameter analyzed in this study, for one representative healthy volunteer and two DCM patients: low and complete responders to the cardiac resynchronization therapy. The DCM patients showed in general smaller values than the healthy volunteers, in all the hemodynamic parameters studied. Assessment of global parameters (Figure 3) showed statistical difference between volunteers and DCM patients (low and complete responders) at peak systole and e-wave in velocity magnitude (p < 0.0001* p < 0.0001+, p = 0.0031* p = 0.0030+), vorticity magnitude (p < 0.0001* p < 0.0001+, p = 0.0022* p = 0.0025+), viscous dissipation (p < 0.0001* p < 0.0001+, p = 0.0024* p = 0.0024+), energy loss (p < 0.0001* p < 0.0001+, p = 0.0028* p = 0.0030+) and kinetic energy (p = 0.0025* p = 0.0025+, p = 0.0030* p = 0.0029+). There were no statistical differences in the parameters at end-diastole. Furthermore, we did not find statistical differences between DCM groups.Conclusions
In DCM patients that show LVRR in response to treatment, the flow derived hemodynamic parameters remained low. This shows that LVEF is unable to reflect subtle ventricular dysfunction, which potentially can be better assessed using flow-based parameters, because of their sensitivity to abnormal pumping function5. Such analyses can help to characterize the extent of LVRR and provide better prognostic stratification1.Acknowledgements
This publication has received funding from Millenium Science Initiative of the Ministry of Economy, Development and Tourism, grant Nucleus for Cardiovascular Magnetic Resonance. Also, has been supported by CONICYT - PIA - Anillo ACT1416, CONICYT FONDEF/I Concurso IDeA en dos etapas ID15|10284, FONDECYT #1181057. Sotelo J. thanks to FONDECYT Postdoctorado 2017 #3170737 and Franco P. thanks to CONICYT – PCHA/ Doctorado-Nacional/2018-21180391.References
1. Merlo M, et. al., Prevalence and prognostic significance of left ventricular reverse remodeling in dilated cardiomyopathy receiving tailored medical treatment, J Am Coll Cardiol. 2011; 57(13):1468-76. doi: 10.1016/j.jacc.2010.11.030.
2. Steimle AE, et. al., Prediction of improvement in recent onset cardiomyopathy after referral for heart transplantation, J Am Coll Cardiol 1994; 23: 553-559.
3. Kurbanek, et. al., Novel predictors of left ventricular reverse remodeling in individuals with recent-onset dilated cardiomyopathy, J Am Coll Cardiol 2013; 61:54-63.
4. Upasana T, et. al., Myocardial remodelling and recovery in dilated cardiomyopathy, JRSM Cardiovasc Dis. 2017; 6:2048004017734476. doi: 10.1177/2048004017734476.
5. Stoll V, , et, al., Left Ventricular Flow Analysis: Novel Imaging Biomarkers and Predictors of Exercise Capacity in Heart Failure, Circ Cardiovasc Imaging 2019;12(5): e008130. doi: 10.1161/CIRCIMAGING.118.008130
6. Franco P, et. al., Comprehensive 3D flow characterization in patients with Dilated Cardiomyopathy from 4D flow MRI data using a finite element method and 17 – Segment Bullseyes, Oral Presentation Velocity & Flow 8:15-10:15, Jun 20, 2018. ISMRM annual meeting, Jun 16-21th, Paris, France http://indexsmart.mirasmart.com/ISMRM2018/PDFfiles/0692.html
7. Franco P, et. al., Sensitivity Study of 4D flow Left Ventricular Hemodynamics Parameters in Healthy Volunteers and Dilated Cardiomyopathy Patients, Oral Presentation Advances in Flow Imaging 8:15-10:15, May 13, 2019. ISMRM annual meeting, May 11-16th, Montréal, Canada indexsmart.mirasmart.com/ISMRM2019/PDFfiles/0094.htm
8. Okada M, et, al., Subclinical myocardial dysfunction in patients with reverse-remodeled dialted cardiomyopathy, J Am Soc Echocardiogr 2012; 25:726-732.
9. Elliot P, et. al., Classification of the cardiomyopathies: a position statement from the European Society Of Cardiology Working Group on Myocardial and Pericardial Diseases. Eur Heart J. 2008;29(2):270-6. doi:10.1093/eurheartj/ehm342.
10. Kerfoot E, et. al., Eidolon: Visualization and Computational Framework for Multi-modal Biomedical Data Analysis. In: Zheng G (eds) Medical Imaging and Augmented reality, MIAR 2016. Lecture Notes in Computer Science, vol 9805. Springer, Cham.
11. Heiberg E, et. al., Design and Validation of Segment – a Freely Available Software for Cardiovascular Image Analysis. BMC Medical Imaging, 10:1,2010.
12. Tufvesson J, et. al., Validation and Development of a New Automatic Algorithm for Time-Resolved Segmentation of the Left Ventricle in Magnetic Resonance Imaging. Biomed Res Int, 2015:970357.
13. Heiberg E, et. al., Time-Resolved Three-dimensional Segmentation of the Left Ventricle. In Proceedings of IEEE Computers in Cardiology 2005(32). Pp 599-602, Lyon, France, 2005.
14. Sotelo J, et. al., 3D Quantification of Wall Shear Stress and Oscillatory Shear Index Using a Finite-Element Method in 3D CINE PC-MRI Data of the Thoracic Aorta. IEEE Trans Med Imaging. 2016 Jun;35(6):1475-87.
Figures


