2108
Aortic Wall Shear Stress and Oscillatory Shear Index in Patients with Repaired Tetralogy of Fallot1Department of Biomedical Engineering and Environmental Sciences, National Tsing Hua University, Hsinchu, Taiwan, 2Department of Radiology, Kaohsiung Veterans General Hospital, Kaohsiung, Taiwan, 3Department of Pediatrics, Kaohsiung Veterans General Hospital, Kaohsiung, Taiwan, 4Department of Pediatrics, National Yang-Ming University, Taipei, Taiwan
Synopsis
We aimed to explore the difference of the wall shear stress (WSS) and oscillatory shear index (OSI) between control and rTOF patients. The rTOF patients were divided into rTOF1and rTOF2 groups according to their indexed right ventricular end-systolic volume (RVESVi). The rTOF patients presented decreased WSSaxial and OSIcirc in the ascending aorta. In rTOF2 group the WSSaxial and OSIcirc correlated with resistance index and flow velocity. In conclusion, higher resistance index and slower flow velocity correlated with decreasd WSSaxial and OSIcirc in rTOF2. The deceasing OSIcirc may slightly improve the stress condition of vascular wall.
Introduction
Aortopathy is associated with numerous congenital heart diseases, including tetralogy of Fallot (TOF)1. The degeneration of the tunica media of aorta was presented in TOF from infancy and was an important cause of aortic root dilatation2, which is one of the late complications affecting long-term prognosis among patients after TOF repair (rTOF). The enlarged diameter of the aorta can alter the flow velocity and thus the viscous forces on the aortic wall3. The wall shear stress (WSS) is a known pathophysiological stimulus leading to gene expression and extracellular matrix remodeling4. Oscillatory shear index (OSI), representing directionality of WSS, is another important determinant of cellular responses to cell proliferation and morphology5. Previous study reported that the diameter of ascending aorta negatively correlated with velocity and WSS in patients with rTOF3. The indexed right ventricular end-systolic volume (RVESVi) was reported as a suitable parameter for assessing the progression of RV dilation6. The relationship between hemodynamic alterations and the wall characteristics was demonstrated as an adaptive process with disease progress. However, correlations among aortic hemodynamic characteristics in rTOF patients with different degrees of RV dilatation has not been discussed thoroughly. This study aims to explore the possible correlation and adaptive mechanisms among the aortic hemodynamic characteristics in rTOF patients with different degrees of RV dilatation.Methods
This study recruited 39 rTOF patients (male/female=25/14, 23 ±4 y/o) and 38 age-matched normal subjects (male/female=23/15, 22 ±2 y/o) without known cardiovascular diseases. The rTOF patients were divided into rTOF1 (n=12, male/female=7/5, 24±4 y/o) and rTOF2 groups (n=27, male/female=18/9, 23±4 y/o) according to their RVESVi6.Images were acquired in a 3-T clinical MR scanner (Tim Trio or Skyra, Siemens, Erlangen, Germany) with prospective ECG triggering and navigator-echo to synchronize with cardiac and respiratory motion. 4D flow was acquired with TR/TE=10.8/2.9 ms, voxel size=3.2x1.4x3.5 mm3, flip angle=7°, Venc=150 cm/s, acceleration factor=5, and temporal resolution=41.6 ms. Fourteen 2D planes were determined perpendicular to the long axis of the aorta for calculating aortic hemodynamics (Figure 1). The diameter index was the aortic diameter indexed to body surface. The resistance index (RI) reflected the resistance to blood flow caused by microvascular bed distal to the site of measurement: RI=(peak systolic velocity–end diastolic velocity)/peak systolic velocity. The WSS is calculated as described in$$ WSS (N/m^2)=\eta\times\frac{\partial V_{Z}}{r}$$
where is the viscosity of blood, V is the velocity component and z is the spatial dimension parallel to the main direction of blood flow7. To evaluate temporal oscillations in the WSS, the OSI, the WSS deviated from its averaged direction during one cardiac cycle, was defined as:
$$OSI=\frac{1}{2}\times(1-\frac{\mid\int_{0}^{T} WSSdt\mid}{\int_{0}^{T} \mid WSS\mid dt})$$
where T is the duration of the cardiac cycle7.
ANOVA and Pearson correlation were performed when appropriate. P<0.05 was considered as statistical significance.
Results
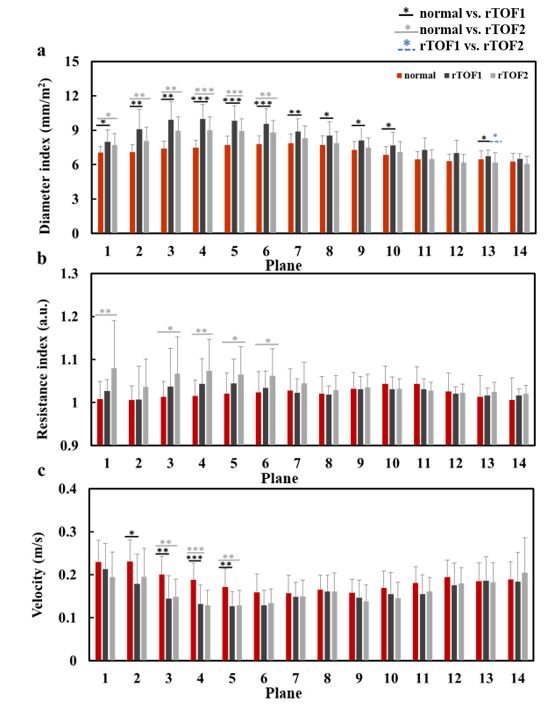
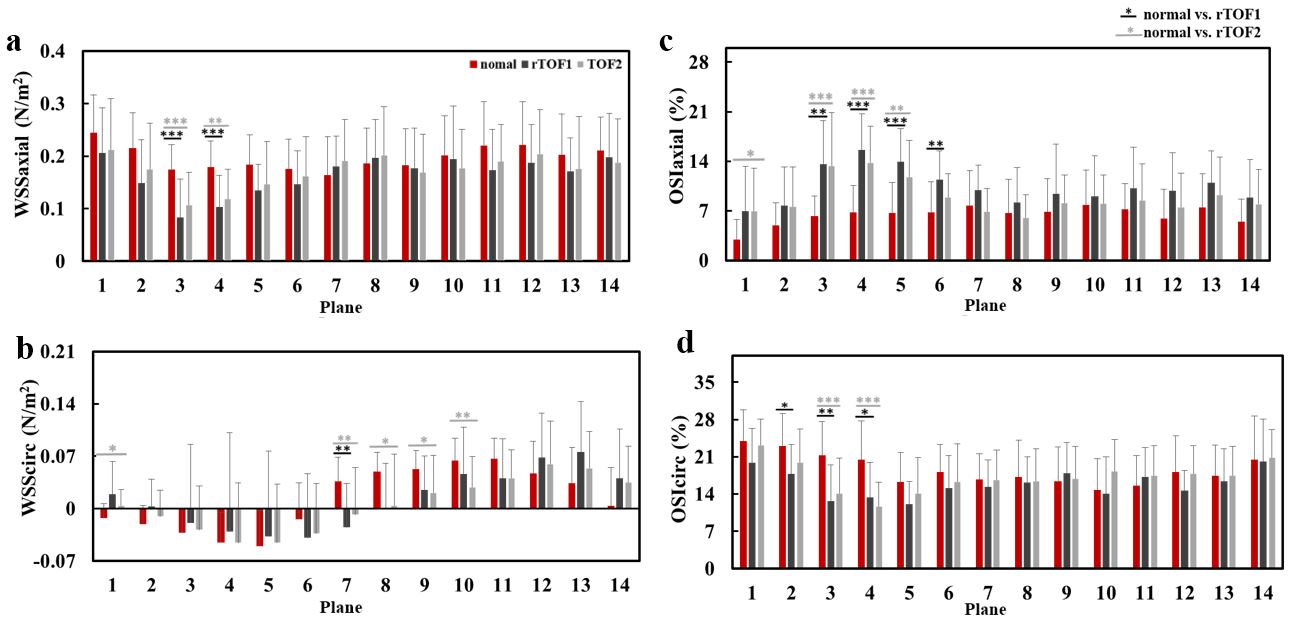
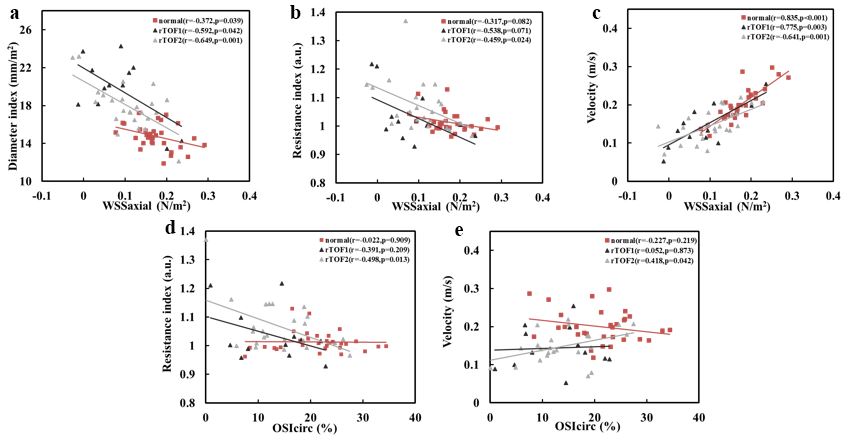
The normal subjects were with RVESVi of 33.7±7.6 cm3/m2. According to this RVESVi, the rTOF patients were divided into rTOF1 with normal RVESVi and rTOF2 with significantly larger RVESVi (31.8±6.3 vs. 74.6±30.6 cm3/m2, p<0.001). Table 1 illustrates the demographics of normal, rTOF1, and rTOF2 groups. Only the rTOF2 group presented dilated RV.In Figure 2, compared to normal group, rTOF1 group presented enlarged diameter index (p<0.05~0.001) along the ascending aorta (AAo) and aortic arch (AA) while rTOF2 group only showed dilated diameter (p<0.05~0.001) in AAo. Only the rTOF2 group demonstrated significant higher RI than normal group in AAo (p<0.05~0.01). Increased flow velocity was shown in the AAo of the two rTOF subgroups (p<0.05~0.001). The two rTOF subgroups presented decreased WSSaxial in AAo (p<0.01~0.001) while only the rTOF2 group demonstrated substantial lower WSScirc in AA (p<0.05~0.01) than normal group (Figure 3(a,b)). The two rTOF subgroups demonstrated increased OSIaxial and decreased OSIcirc (all p<0.05~0.001) in AAo (Figure 3(c,d)). The WSSaxial correlated with diameter index and velocity at plane 3 of all three groups, while only the rTOF2 presented significant correlation between WSSaxial and RI (r=-0.459, p=0.024). Similarly, only in rTOF2 subgroup, plane 3 exhibited substantial correlations between OSIcirc and RI (r=-0.498, p=0.013) and velocity (r=0.418, p=0.042).
Discussion and Conclusions
In this study, the altered diameter index, RI, and flow velocity along the aorta were assessed in rTOF patients with different degrees of RV dilatation. We found the wall characteristics (i.e. WSSaxial and OSIcir) presented correlations with RI only in the rTOF2 subgroup, which is with dilated RV. In our study, the dilated aortic diameter, decreased WSSaxial, and increased OSIaxial as well as OSIcirc altogether reflected the disturbed blood flow in the AAo of two rTOF subgroups. The negative correlation of WSSaxial with aortic diameter was consistent with the previous study3. Lower OSI was reported to be more conducive to endothelial cell growth5. In our study, the reduced OSIaxial and OSIcirc in the two rTOF subgroups may involve in the growth of enthothelium and may change the wall characteristics in AAo. Moreover, the RI presented correlations with WSSaxial and OSIcirc only in the rTOF2 subgroup implied that rTOF patients with dilated RV may exert an adaptive mechanism between wall characteristics and resistance. In conclusion, understanding the correlation between wall characteristics (i.e. WSSaxial and OSIcir) and RI in rTOF patients with RV dilatation can be helpful to elucidate the possible adaptive mechanism between wall characteristics and resistance.Acknowledgements
No acknowledgement found.References
- Therrien J , Webb G ,et al. Clinical update on adults with congenital heart disease. The Lancet. 2003; 362(9392):1305-1313.
- Tan, J. L, et al.Intrinsic Histological Abnormalities of Aortic Root and Ascending Aorta in Tetralogy of Fallot: Evidence of Causative Mechanism for Aortic Dilatation and Aortopathy. Circulation. 2005; 112(7):961-968.
- Lee, Suji, et al. Evaluation of Flow Pattern in the Ascending Aorta in Patients with Repaired Tetralogy of Fallot Using Four-Dimensional Flow Magnetic Resonance Imaging. Korean journal of radiology. 2019; 20(9): 1334-1341.
- Buchanan J R ,
Kleinstreuer C , Truskey G A , et al. Relation between non-uniform hemodynamics
and sites of altered permeability and lesion growth at the rabbit aorto-celiac
junction. Atherosclerosis. 1999; 143(1):27-40.
- Chakraborty A , Chakraborty S , Jala V R , et
al. Effects of biaxial oscillatory shear stress on endothelial cell
proliferation and morphology. Biotechnology and Bioengineering. 2012;
109(3):695-707.
- Buddhe S , Shah A , Lai W W, et al. Progression of right ventricular dilation in repaired tetralogy of fallot. Journal of Magnetic Resonance Imaging. 2015; 41(3): 730-737.
- Frydrychowicz, A., et al., Three-dimensional analysis of segmental wall shear stress in the aorta by flow-sensitive four-dimensional-MRI. Journal of Magnetic Resonance Imaging. 2009. 30(1):77-84.
Figures
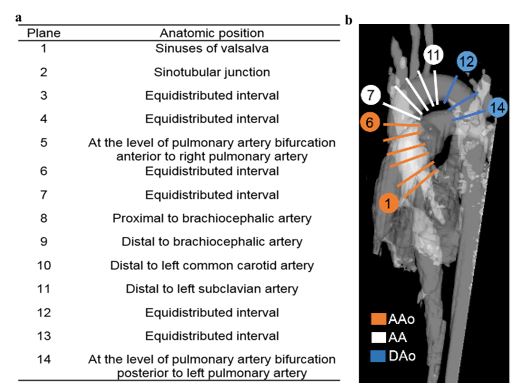
Figure 1. (a) The landmarks of manually determined 14 2D planes for computing hemodynamics. (b) The illustration of the determined 14 planes along the aorta. Aao: ascending aorta; AA: arch; Dao: descending aorta
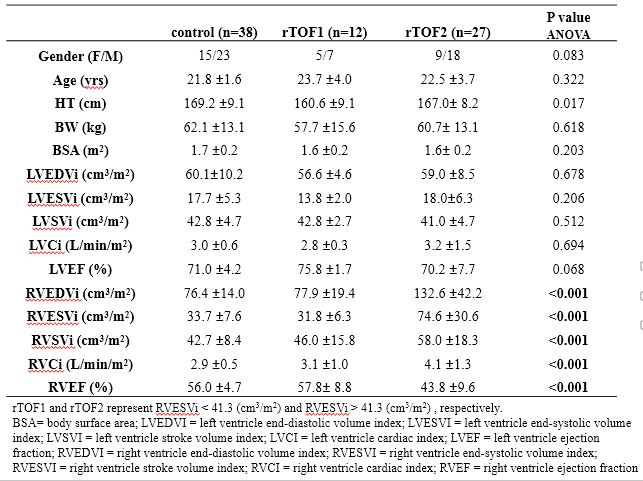
Table 1. The demographic characteristics of the study population.