2106
Pulse wave velocity and wall shear stress in the carotid arteries of familial hypercholesterolemia patients1Department of Radiology and Nuclear Medicine, Amsterdam UMC, Amsterdam, Netherlands, 2Department of Paediatrics, Amsterdam UMC, Amsterdam, Netherlands, 3Department of Physics and Biomedical Engineering, Amsterdam UMC, Amsterdam, Netherlands, 4Department of Clinical Epidemiology, Biostatistics and Bioinformatics, Amsterdam UMC, Amsterdam, Netherlands
Synopsis
Familial hypercholesterolemia (FH) is characterized by elevated low-density lipoprotein (LDL) cholesterol levels form birth onwards and premature cardiovascular disease. Statins are currently the preferred pharmacological therapy. Results from a recent study suggest that initiation of lipid-lowering treatment during childhood reduces the risk for cardiovascular disease in adulthood. With advanced acquisition strategies of 2D and 4D flow MRI we investigated PWV and WSS in the carotid arteries of 43 FH patients and 18 healthy controls of a similar age (33 years), as PWV and WSS have both been associated with atherosclerosis.
Introduction
Familial hypercholesterolemia (FH) is characterized by elevated low-density lipoprotein (LDL) cholesterol levels form birth onwards and premature cardiovascular disease. Statins are currently the preferred pharmacological therapy. Results from a recent study suggest that initiation of lipid-lowering treatment during childhood reduces the risk for cardiovascular disease in adulthood [1].In the last years novel MRI acquisition and reconstruction techniques have been developed, allowing for high temporal resolution 2D flow MRI and accurate pulse wave velocity (PWV, a proxy for vessel stiffness) assessment in small vessel segments [2]. Additionally, similar techniques [3] have enabled fast 4D flow MRI protocols and wall shear stress (WSS) assessment.
Low WSS and high PWV have been associated with atherosclerosis [4,5]. In this study, PWV and WSS were measured in a cohort of young patients and healthy controls, to investigate the effect of lipid-lowering treatment from early childhood on these biomarkers.
Methods
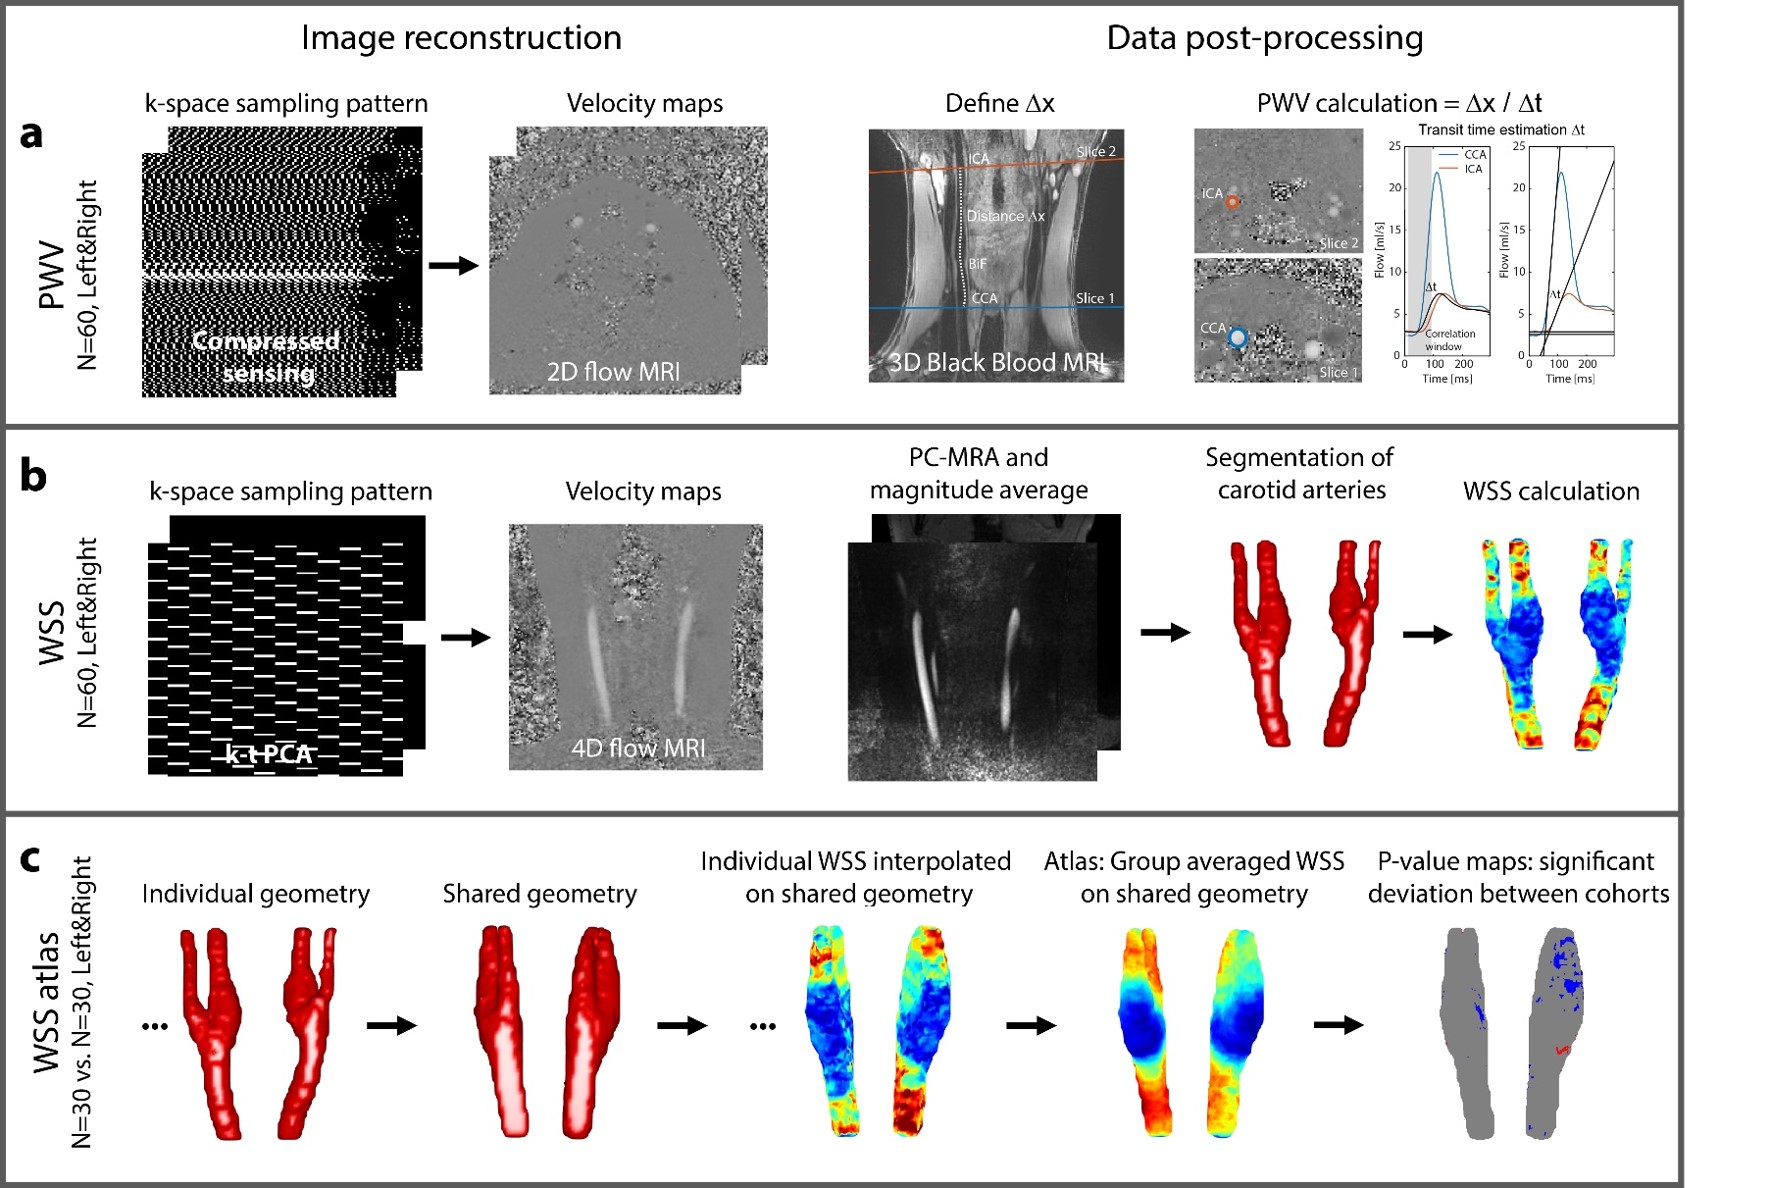
A group of 43 FH patients (21 male, 32.6±2.8 years) and 18 healthy controls (12 male, 33.1±3.3 years) were scanned. The protocol consisted of two 2D flow MRI scans, acquired with a compressed sensing (CS) technique [2] and including a 3D Black Blood scan for path length estimation (Figure 1a). Additionally, 8-fold k-t PCA accelerated 4D flow MRI (10 min scan time) was acquired (Figure 1b). Scans were done on a Philips 3T Ingenia scanner using a 8-channel neck coil.Scan parameters were for 2D flow: TR=8.0/TE=3.9ms, flip angle=25°, VENC=150cm/s, 0.8x0.8x3mm3 resolution, 4 ms temporal resolution and for 4D flow: TR=7.8/TE=4.6ms, flip angle=8°, VENC=150cm/s, 0.8x0.8x0.8mm3 spatial and 80 ms temporal resolution. Transit times for PWV estimation were calculated by the time shift between flow curves in CCA and ICA using an average of foot-to-foot and correlation methods [2]. Additionally, peak systolic velocities within each ROI were derived from 2D flow MRI.
For WSS estimation from 4D flow MRI [6], the vessel lumen 2 cm above and below the carotid bulb was segmented for which a combination of time-averaged magnitude and PC-MRA images were used. In order to compare systolic WSS between FH and healthy controls carotid artery geometries were registered to a shared geometry [7] and WSS values of each individual were interpolated on the surface of the shared geometry (Figure 1b). WSS values per group were then averaged to create a 3D ‘atlas’ [8].
For statistical comparison the group was divided in categories FH/healthy control, male/female and smoking/non-smoking. WSS atlases were calculated for each group. Additionally, for individual WSS values on the shared geometry, differences between groups were calculated using a Wilcoxon rank sum test for each voxel. These p-value maps indicated significant differences between two groups. Mean arterial blood pressure (MAP), LDL, HDL (high-density lipoprotein), length and weight were acquired before MRI examination and compared to PWV and WSS using linear regression. Differences between two groups were tested with a Wilcoxon rank sum test. P<0.05 was considered significant.
Results
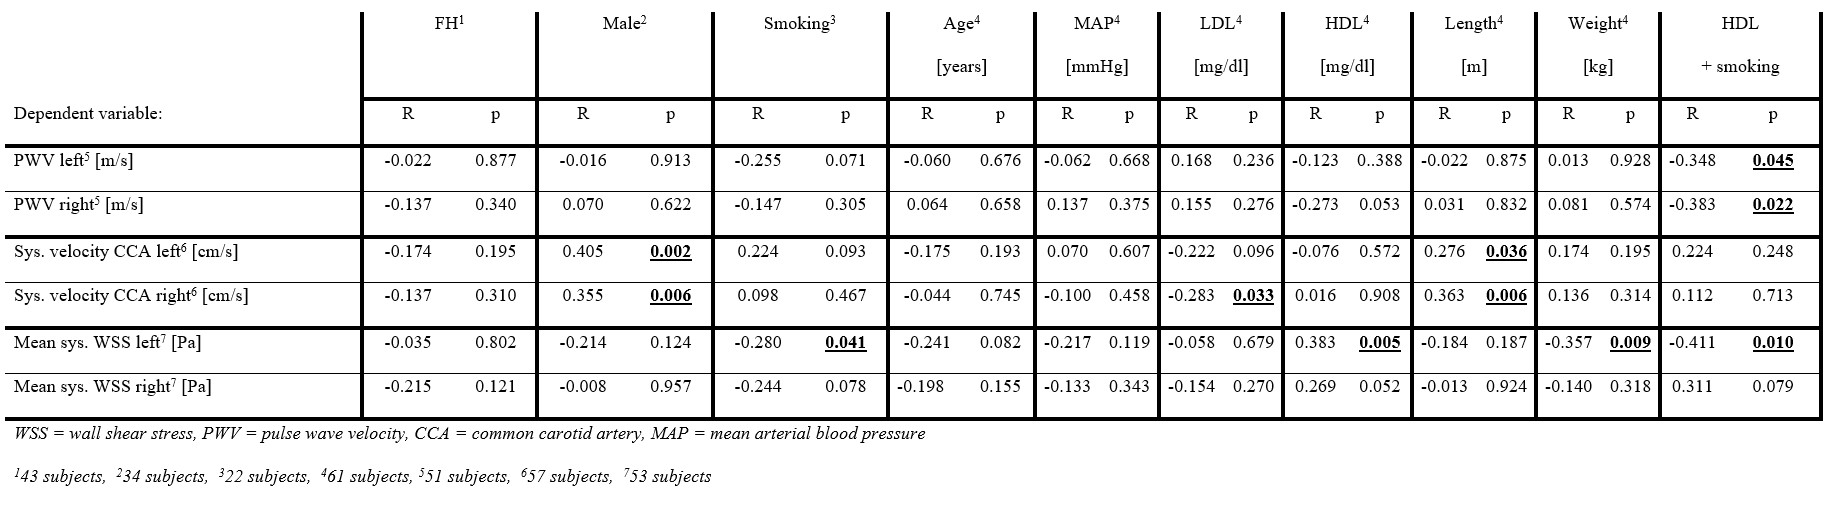
For 6 datasets PWV could not be calculated due to small transit times and for 4 datasets image quality of 4D flow MRI was insufficient. WSS atlases for all data are shown in Figure 2. Velocities were significantly higher in male than in female and lower in smokers than in non-smokers, as well as lower in FH than in healthy controls. These differences were more prominent in the right than in the left carotid artery. Healthy, female and non-smoking groups revealed slightly higher WSS values in CCA and ICA, however these difference were mainly not significant as the p-value maps indicate.Velocity values in the CCA measured with 2D flow MRI correlated with male gender, however not with FH and smoking status. Table 1 shows that mean WSS correlated negatively with smoking status in the left carotid. PWV did not show significant correlations per group, although a trend towards lower PWVs in smokers could be observed. Correlations of velocity values with male gender decreased (p=0.023 left, p=0.193 right) when body weight and length were included in the model. Negative correlations between PWV and smoking status became more prominent when HDL was included in the model. Mean WSS showed positive correlations with HDL level in the left and a tendency in the right carotid. No correlations between PWV and WSS were found. Figure 3 shows significantly higher velocities in male subjects in the CCA. LDL was significantly higher in FH patients and MAP was significantly higher in men than in women, as well as in smokers than in non-smokers.
Discussion and Conclusion
Understanding the mechanisms of onset and development of atherosclerosis is important. In this study we did not find significant differences in WSS and PWV for FH patients in comparison to healthy controls. Small regions of lower WSS could be detected in FH patients, male and smoking cohorts, however a larger number of subject is needed for a valid comparison and it remains difficult to discriminate between adaptive effects of regular smoking, abstinence [9] or smoking before the scan. PWV did not show differences between FH and controls. This might all be explained by the effective lipid-lowering treatment, as also in a previous study no differences in intima-media thickness were detected [1].Acknowledgements
No acknowledgement found.References
1. Luirink IK, Wiegman A, Kusters DM, Hof MH,
Groothoff JW, de Groot E, et al. 20-Year Follow-up of Statins in Children with
Familial Hypercholesterolemia. N Engl J Med. 2019;381:1547–56.
2. Peper ES, Strijkers GJ, Gazzola K, Potters W V, Motaal AG, Luirink IK, et al. Regional assessment of carotid artery pulse wave velocity using compressed sensing accelerated high temporal resolution 2D CINE phase contrast cardiovascular magnetic resonance. J Cardiovasc Magn Reson. 2018;20:1–12.
3. Pedersen H, Kozerke S, Ringgaard S, Nehrke K, Won YK. K-t PCA: Temporally constrained k-t BLAST reconstruction using principal component analysis. Magn Reson Med. 2009;62:706–16.
4. Markl M, Wegent F, Zech T, Bauer S, Strecker C, Schumacher M, et al. In vivo wall shear stress distribution in the carotid artery: effect of bifurcation geometry, internal carotid artery stenosis, and recanalization therapy. Circ Cardiovasc Imaging. 2010;3:647–55.
5. Gotschy A, Bauer E, Schrodt C, Lykowsky G, Ye YX, Rommel E, et al. Local arterial stiffening assessed by MRI precedes atherosclerotic plaque formation. Circ Cardiovasc Imaging. 2013;6:916–23.
6. Potters W V., Marquering HA, VanBavel E, Nederveen AJ. Measuring wall shear stress using velocity-encoded MRI. Curr Cardiovasc Imaging Rep. 2014;7:1–12.
7. van Ooij P, Cibis M, Rowland E, Vernooij M, van der Lugt A, Weinberg P, et al. Spatial correlations between MRI-derived wall shear stress and vessel wall thickness in the carotid bifurcation. Eur Radiol Exp. 2018;
8. van Ooij P, Potters W V., Nederveen AJ, Allen BD, Collins J, Carr J, et al. A methodology to detect abnormal relative wall shear stress on the full surface of the thoracic aorta using four-dimensional flow MRI. Magn Reson Med. 2015;73:1216–27.
9. Vafaee MS, Gjedde A, Imamirad N, Vang K, Chakravarty MM, Lerch JP, et al. Smoking normalizes cerebral blood flow and oxygen consumption after 12-hour abstention. J Cereb Blood Flow Metab. 2015;35:699–705.
Figures