2098
Quantitative myocardial perfusion with an alternating radial 2D simultaneous multi-slice and 3D stack-of-stars sequence1Biomedical Engineering, University of Utah, Salt Lake City, UT, United States, 2Utah Center for Advanced Imaging Research (UCAIR), University of Utah, salt lake city, UT, United States
Synopsis
Here we propose a unique perfusion acquisition that applies a 2D/3D alternating acquisition method to obtain 2D simultaneous multi-slice (SMS) and 3D stack-of-stars (SoS) data every other heartbeat. Within each heartbeat, 2D SMS and 3D acquisitions are performed following a saturation pulse. Potential advantages include different spatio-temporal resolution and artifacts, accurate AIF acquisitions and the ability to compare the sequences directly with a single injection. Preliminary quantitative results of 7 dog and 3 human studies show the promise of this approach.
Introduction
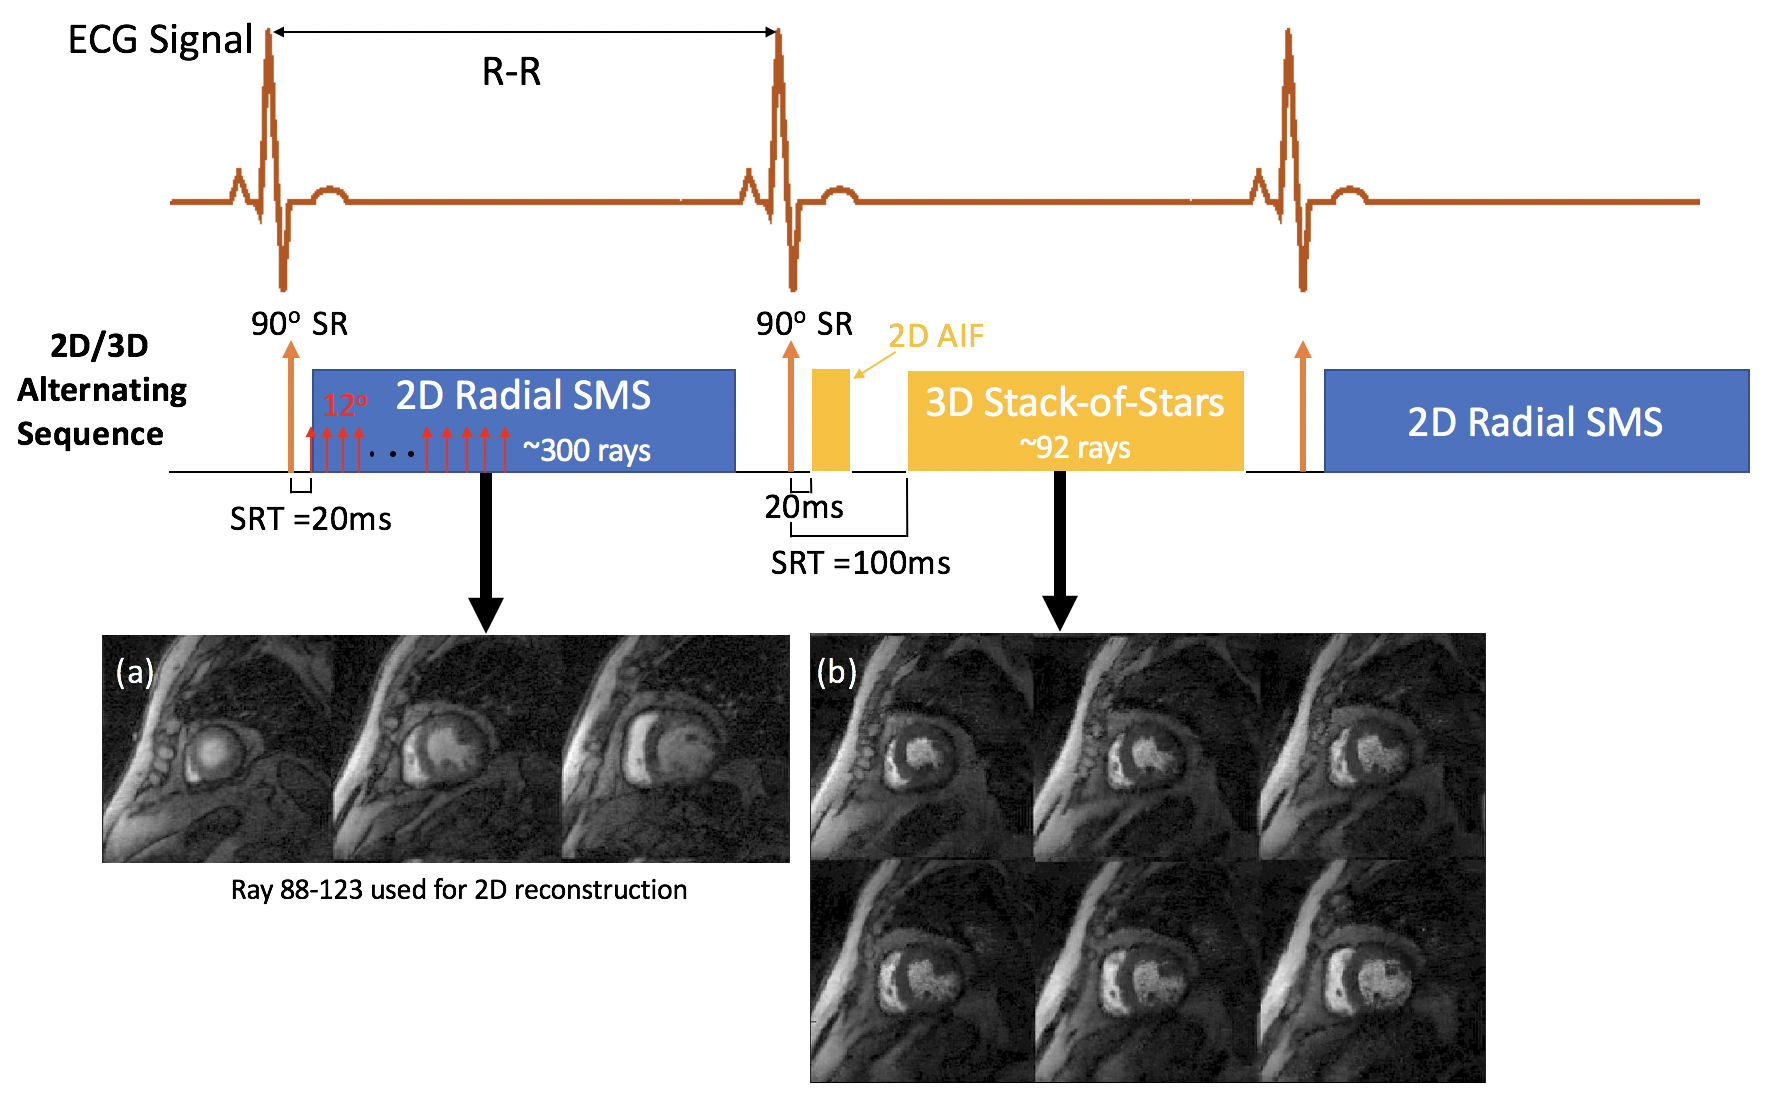
Quantitative myocardial perfusion can be a valuable tool for studying perfusion reserve in different disease states (1,2). Current Dynamic Contrast Enhanced (DCE) MRI methods have trade-offs in resolution and coverage and image quality (3-5). Two relatively new methods have been proposed for quantifying perfusion. The first is a hybrid radial 2D SMS sequence that uses a single saturation pulse each heartbeat and then acquires continuously (Fig. 1). This allows for an accurate AIF acquisition initially, and then retrospective selection of rays to reconstruct at any phase of the cardiac cycle, with a “hybrid” weighting of saturation recovery or steady-state gradient echo. The second method is a 3D stack of stars sequence, with a radial 2D acquisition for the AIF. The methods are quite different in terms of spatial and temporal resolution, image contrast, cardiac cycle timing, and the effects of cardiac and respiratory motion.Here, we propose a unique perfusion acquisition that uses 2D SMS and 3D alternating each heartbeat. This allows for direct comparison of the methods, even at stress, and offers the possibility that the methods may complement each other and offer more information than acquiring with only one of the techniques. Since there has been relatively little study of quantitative techniques that acquire every other beat, we first studied if every other beat is a sufficient sampling.
Methods
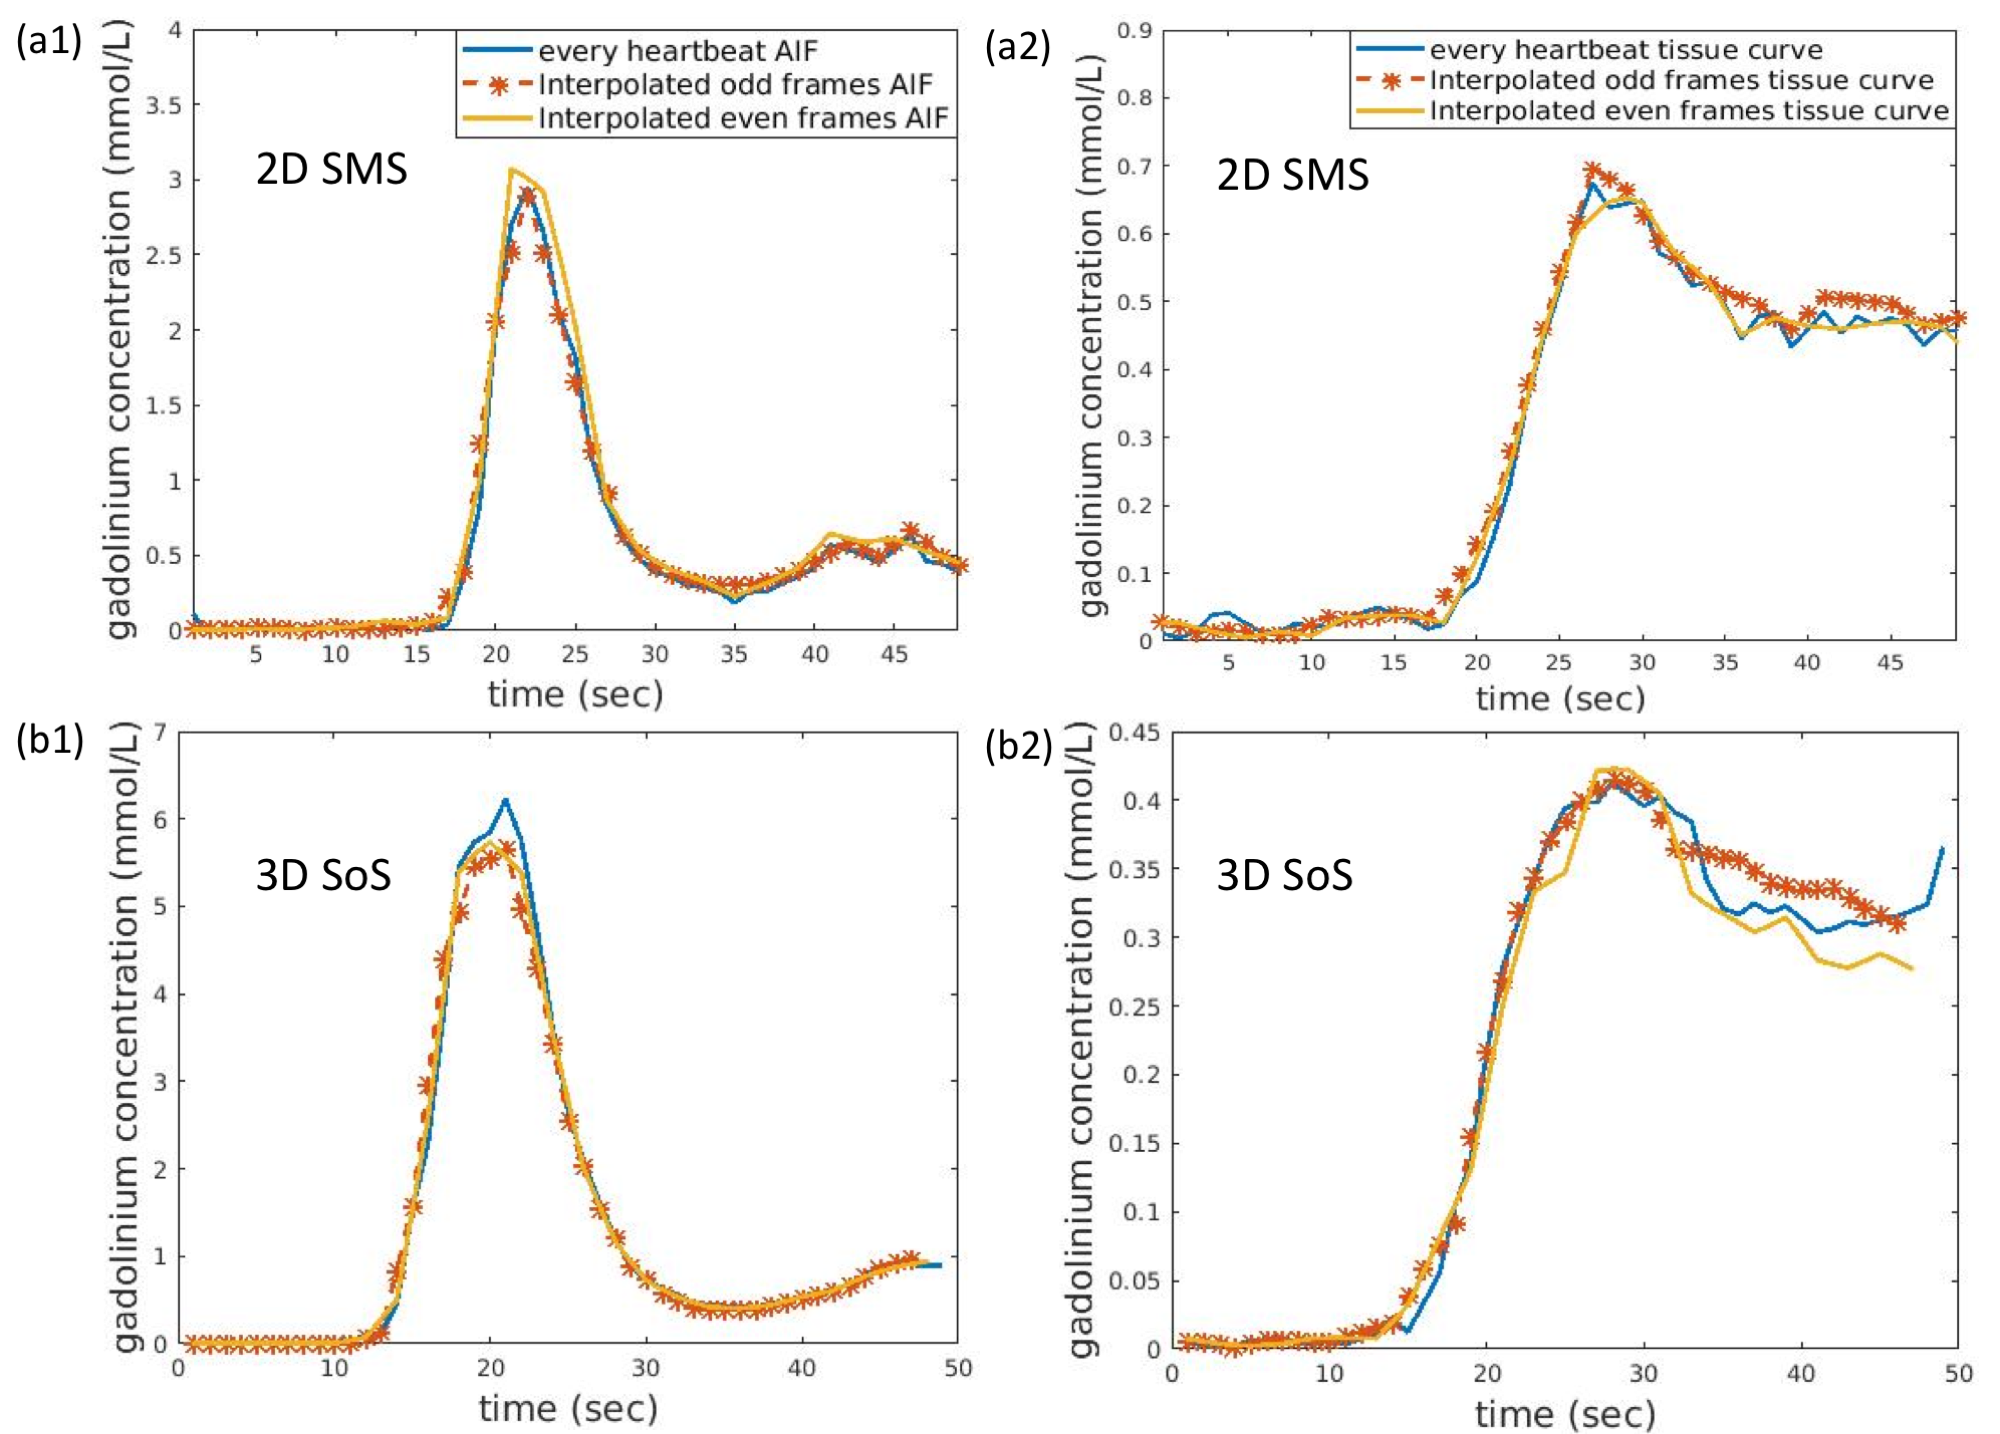
5 datasets of “full” every beat 2D SMS and 2 datasets of 3D SoS were acquired. The 2D SMS typically obtained around 300 rays (golden ratio ordering) each heartbeat, simultaneously at 3 slices, one. TR/TE=2.3/1.1msec, ~1.8x1.8x8mm pixel size. The 3D SoS (6) acquired ~92 rays each heartbeat with 8 short axis slices (center 6 slices used for analysis). TR/TE=2.1/1.1msec, ~1.8x1.8x5mm pixel size. A non-selective saturation pulse was played once per heartbeat and actual data readouts started 20msec after the saturation pulse for 2D SMS and for the 2D AIF portion of the 3D scan, and 100msec after for 3D acquisition respectively. The AIF was generated by first 24 rays which ensures the linearity between gadolinium concentration and signal intensities. The 3D SoS used an “efficient” 2D AIF (6) and the tissue readout was acquired at systole. Both 2D SMS and 3D raw data were reconstructed with an iterative spatial temporal constrained reconstruction (STCR) method (7). The resulting images were then registered to compensate for respiratory motion and converted to gadolinium concentration using proton density images. The curves were fit to a compartment model to give perfusion values. Perfusion values from the full every beat acquisition, and after every other beat was discarded were compared.A sequence was created to alternate the 2D SMS and 3D SoS each heartbeat and used in 3 human subjects and 7 dogs on a 3T Prisma (Siemens) scanner. Scans were done at both rest (n=12) and adenosine stress (n=4) with 0.05-0.075mmol/kg gadoteridol. Fig. 1 shows the 2D/3D alternating sequence.
Results
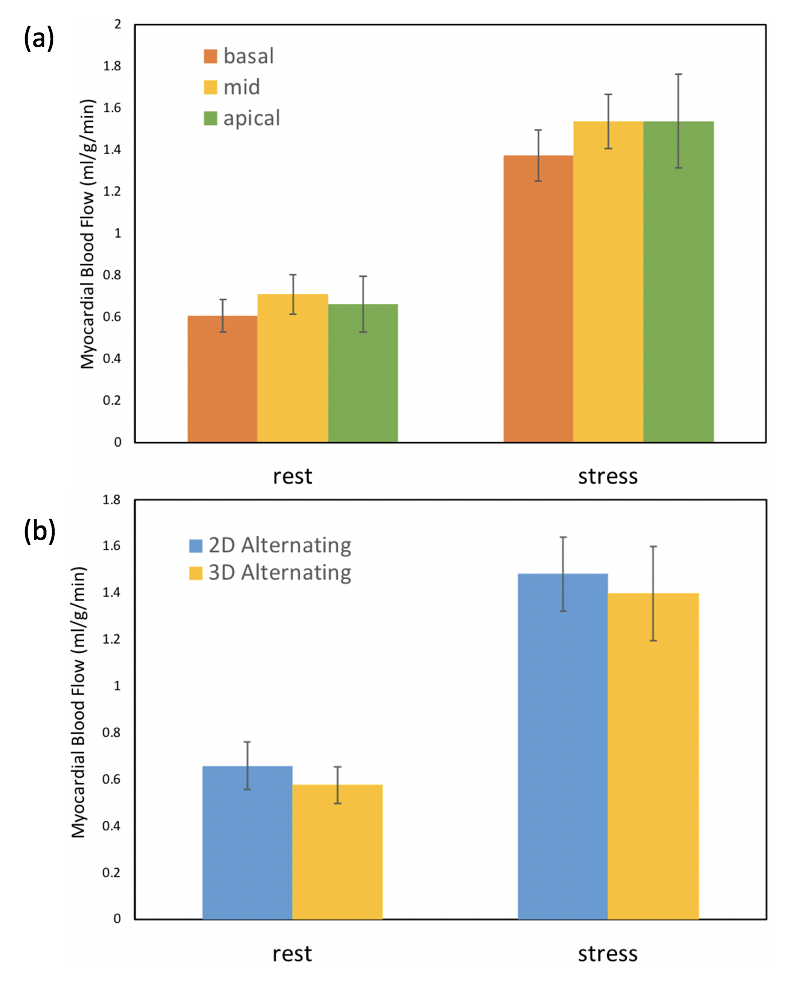
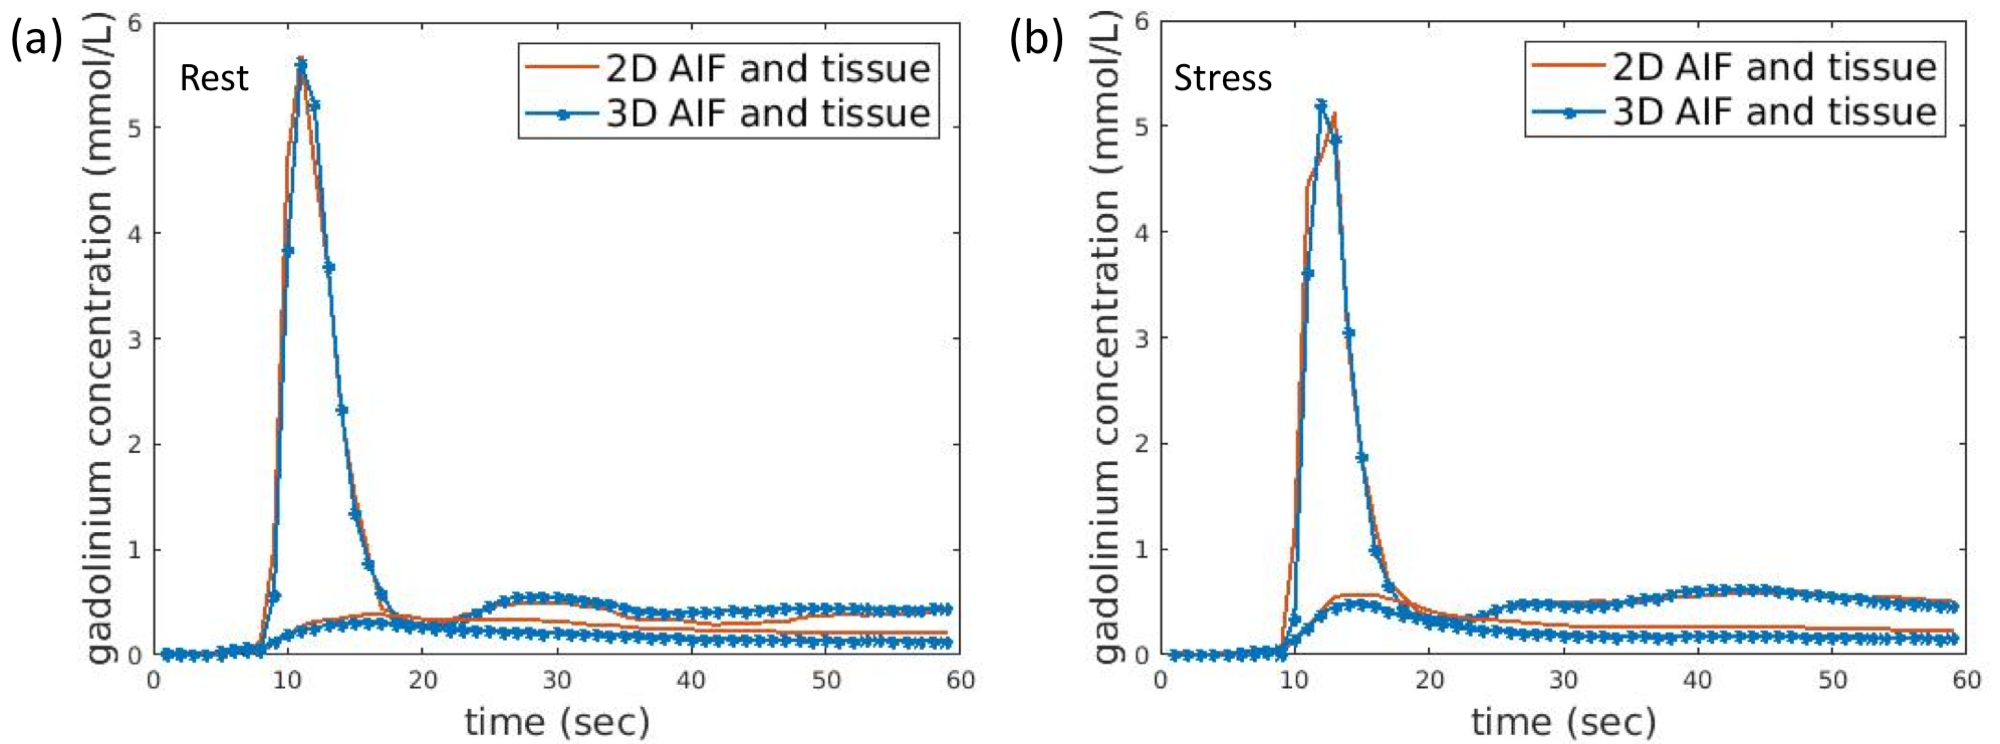
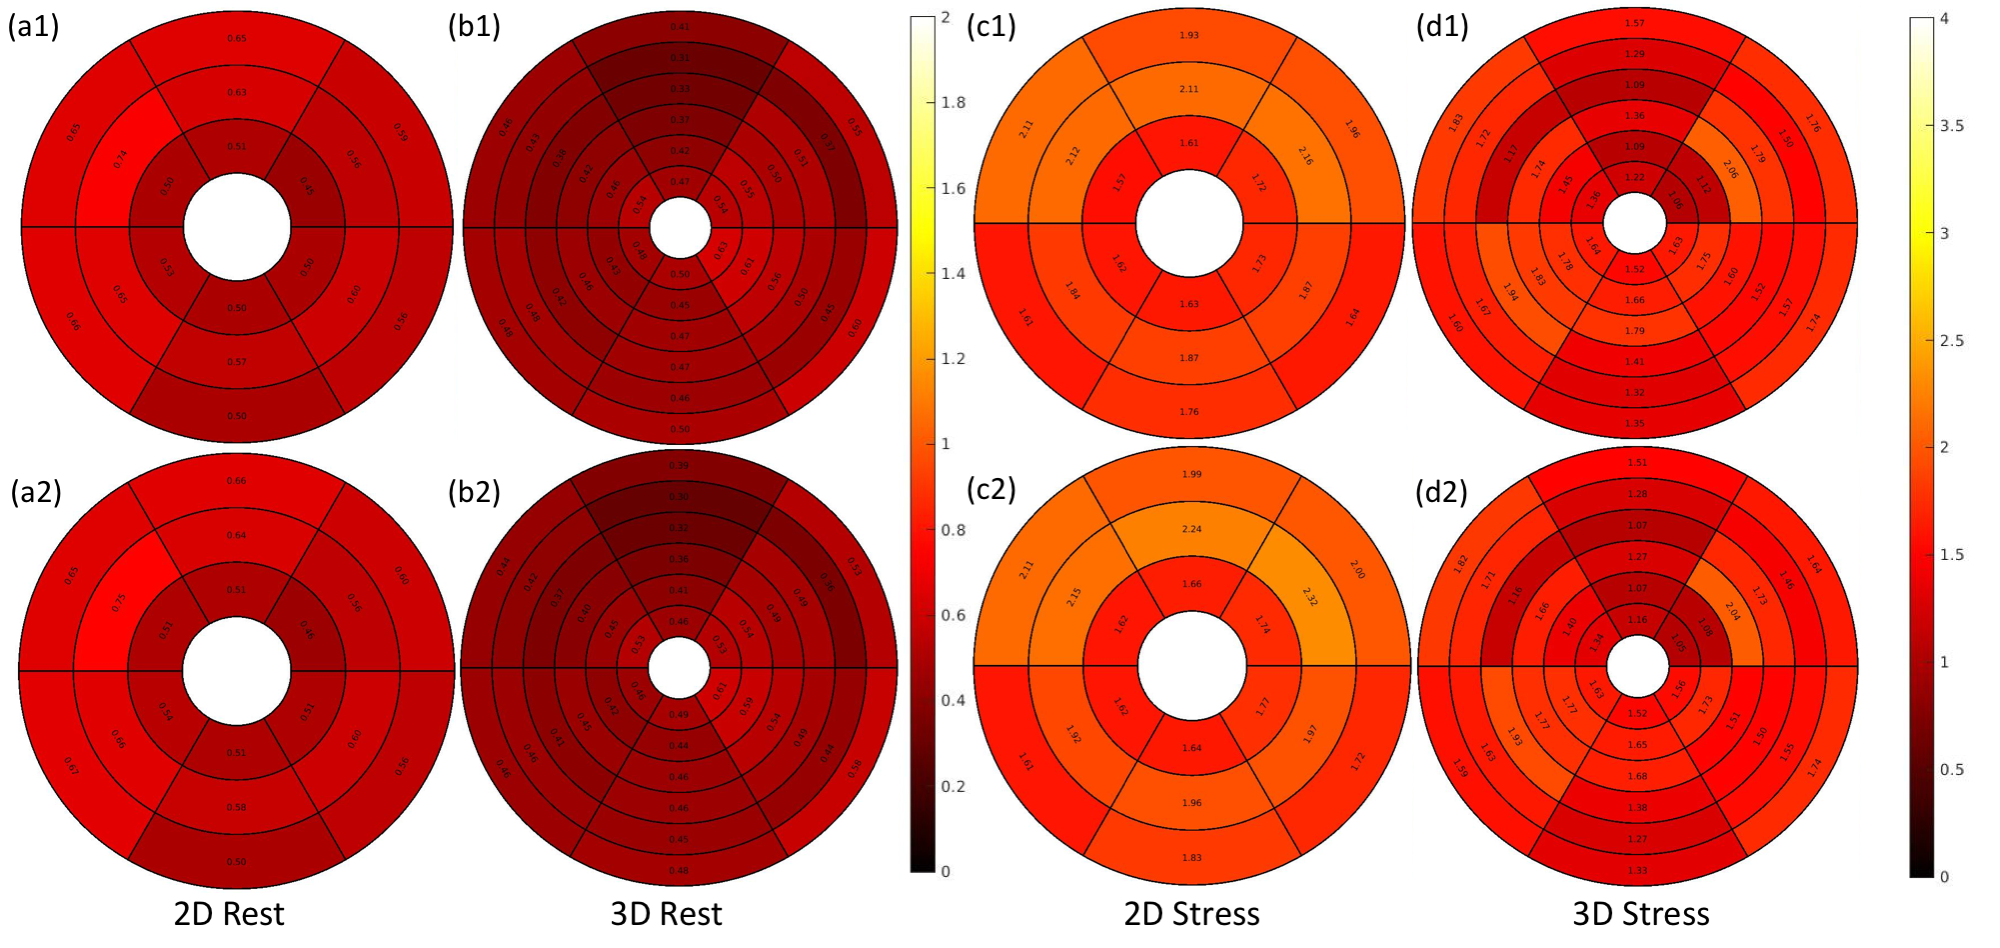
Figure 2 shows an example of good agreement of time curves when only every other beat is retained. Figure 3(a) shows quantitative flow values from the alternating 2D/3D, 4 stress studies and 12 rest studies. Mean flow of six regions from each slice of each subject indicates ~0.6-0.7ml/min/g for rest and ~1.35-1.55 ml/min/g for stress cases. Figure 3(b) shows the comparison of perfusion results between 2D SMS and 3D SoS with efficient AIF methods. 2D generally showed slightly higher perfusion results compared with 3D. Fig. 4 illustrates the perfusion differences between 2D and 3D alternating sequences may be more related to tissue curves in the 2D acquisition being slightly higher than that of 3D, while the AIFs are similar.Discussion
We expected from previous works by others that sampling every other beat provides reasonable sampling of tissue curves, but may not be rapid enough to accurately realize the AIF peak. The alternating 2D/3D can be combined to have a single AIF sampled every beat, which did not seem essential in our initial investigations but likely is important in some cases. Figure 5 showed the example of the comparison between the 2D/3D alternating quantitative results and a method with a composite AIF and interpolated tissue curves for both the stress and the rest. By a composite AIF we mean the combination of 2D and 3D AIFs while tissue curves of 2D and 3D acquisition are interpolated separately to match the sampling of the composite AIF. Similar perfusion values as those of the 2D/3D alternating method with separate AIFs were observed when using the composite AIF.Conclusion
We demonstrated an alternating quantitative 2D/3D myocardial DCE perfusion imaging sequence with reasonable agreement between 2D and 3D quantitative results. Further work is needed to understand the trade-offs of the 2D and 3D sequences and the possible complementary information that they may provide.Acknowledgements
No acknowledgement found.References
1. Adluru G, McGann C, Speier P, Kholmovski EG, Shaaban A, Dibella EV. Acquisition and reconstruction of undersampled radial data for myocardial perfusion magnetic resonance imaging. J Magn Reson Imaging 2009;29(2):466-473.
2. Wang H, Bangerter NK, Adluru G, Taylor MI, DiBella EV. Myocardial perfusion imaging with an interleaved multi-slice acquisition for steady-state readout without saturation preparation or gating. Proc Intern Soc Magn Reson Med(ISMRM) 2014;22:3934.
3. Chen L, Adluru G, Schabel MC, McGann CJ, Dibella EV. Myocardial perfusion MRI with an undersampled 3D stack-of-stars sequence. Med Phys 2012;39(8):5204-5211.
4. Motwani M, Kidambi A, Sourbron S, Fairbairn TA, Uddin A, Kozerke S, Greenwood JP, Plein S. Quantitative three-dimensional cardiovascular magnetic resonance myocardial perfusion imaging in systole and diastole. Journal of Cardiovascular Magnetic Resonance 2014;16(1):19.
5. Wissmann L, Niemann M, Gotschy A, Manka R, Kozerke S. Quantitative three-dimensional myocardial perfusion cardiovascular magnetic resonance with accurate two-dimensional arterial input function assessment. Journal of Cardiovascular Magnetic Resonance 2015;17(1):108.
6. Mendes JK, Adluru G, Likhite D, Fair MJ, Gatehouse PD, Tian Y, Pedgaonkar A, Wilson B, DiBella EVR. Quantitative 3D myocardial perfusion with an efficient arterial input function. Magn Reson Med 2019.
7. Adluru G, Awate SP, Tasdizen T, Whitaker RT, Dibella EV. Temporally constrained reconstruction of dynamic cardiac perfusion MRI. Magn Reson Med 2007;57(6):1027-1036.
Figures