2094
Improved precision of T1 estimation for 1.5T quantitative myocardial perfusion imaging using a high flip angle SSFP reference image1School of Biomedical Engineering and Imaging Sciences, King's College London, London, United Kingdom, 2MR Research Collaborations, Siemens Healthcare Limited, Frimley, United Kingdom
Synopsis
Accurate quantification of myocardial blood flow using cardiac MR perfusion imaging requires a linear relationship between the arterial input function and myocardial signal intensity curves. Typically this condition is not fulfilled with standard contrast agent doses, but can be achieved using signal calibration techniques for direct contrast concentration quantification. These methods use a low flip angle (LFA) reference image for normalisation. However, normalisation based on a low SNR reference image results in poor precision of T1 estimates. In this study the use of a high flip angle reference image shows improved precision compared to a LFA technique.
Introduction
Accurate quantitative measurements of myocardial blood flow (MBF) using cardiac MR perfusion imaging generally relies on a linear relationship between the arterial input function (AIF) and myocardial signal intensity curve. It is difficult to satisfy this requirement with standard contrast agent doses, since there is a non-linear relationship between signal and contrast concentration1,2. Signal calibration techniques have been proposed for spoiled gradient echo sequences to correct for non-linearity by converting the signal values to T1 times, allowing direct quantification of gadolinium concentration3. These techniques can be applied to balanced steady state free precession (bSSFP) imaging, which is attractive for perfusion imaging due to increased SNR4. These methods use a low flip angle reference image (LFA) for normalisation. In this study, we propose the use of a high flip angle bSSFP reference image (HFA) for normalisation to improve precision of T1 estimates.Methods
Proposed sequenceA conventional bSSFP perfusion imaging sequence with a LFA (8˚) reference image was modified to acquire an additional HFA (50˚) reference image, following a 5-heartbeat recovery period.
Dynamic myocardial T1 mapping
T1 fitting software was developed in Matlab using a signal dictionary-based approach with a GPU implementation. The dictionary is created using Bloch simulations to model bSSFP signal evolution for the reference (Ref) and saturation-recovery (SR) images. A T1 of 1200ms is assumed for the reference signal, and a range of T1 values (1-1200ms) are modelled for the SR signal. The dictionary values are scaled by a normalisation factor:
$$ Normalisation Factor = \frac{SI_{Meas, Ref} + SI_{Meas, SR} }{ SI_{Dict, Ref} + SI_{Dict, SR} }$$
An exhaustive search of the dictionary is performed to determine the best T1 for measured signal values using least-squares fitting.
Experimental Validation
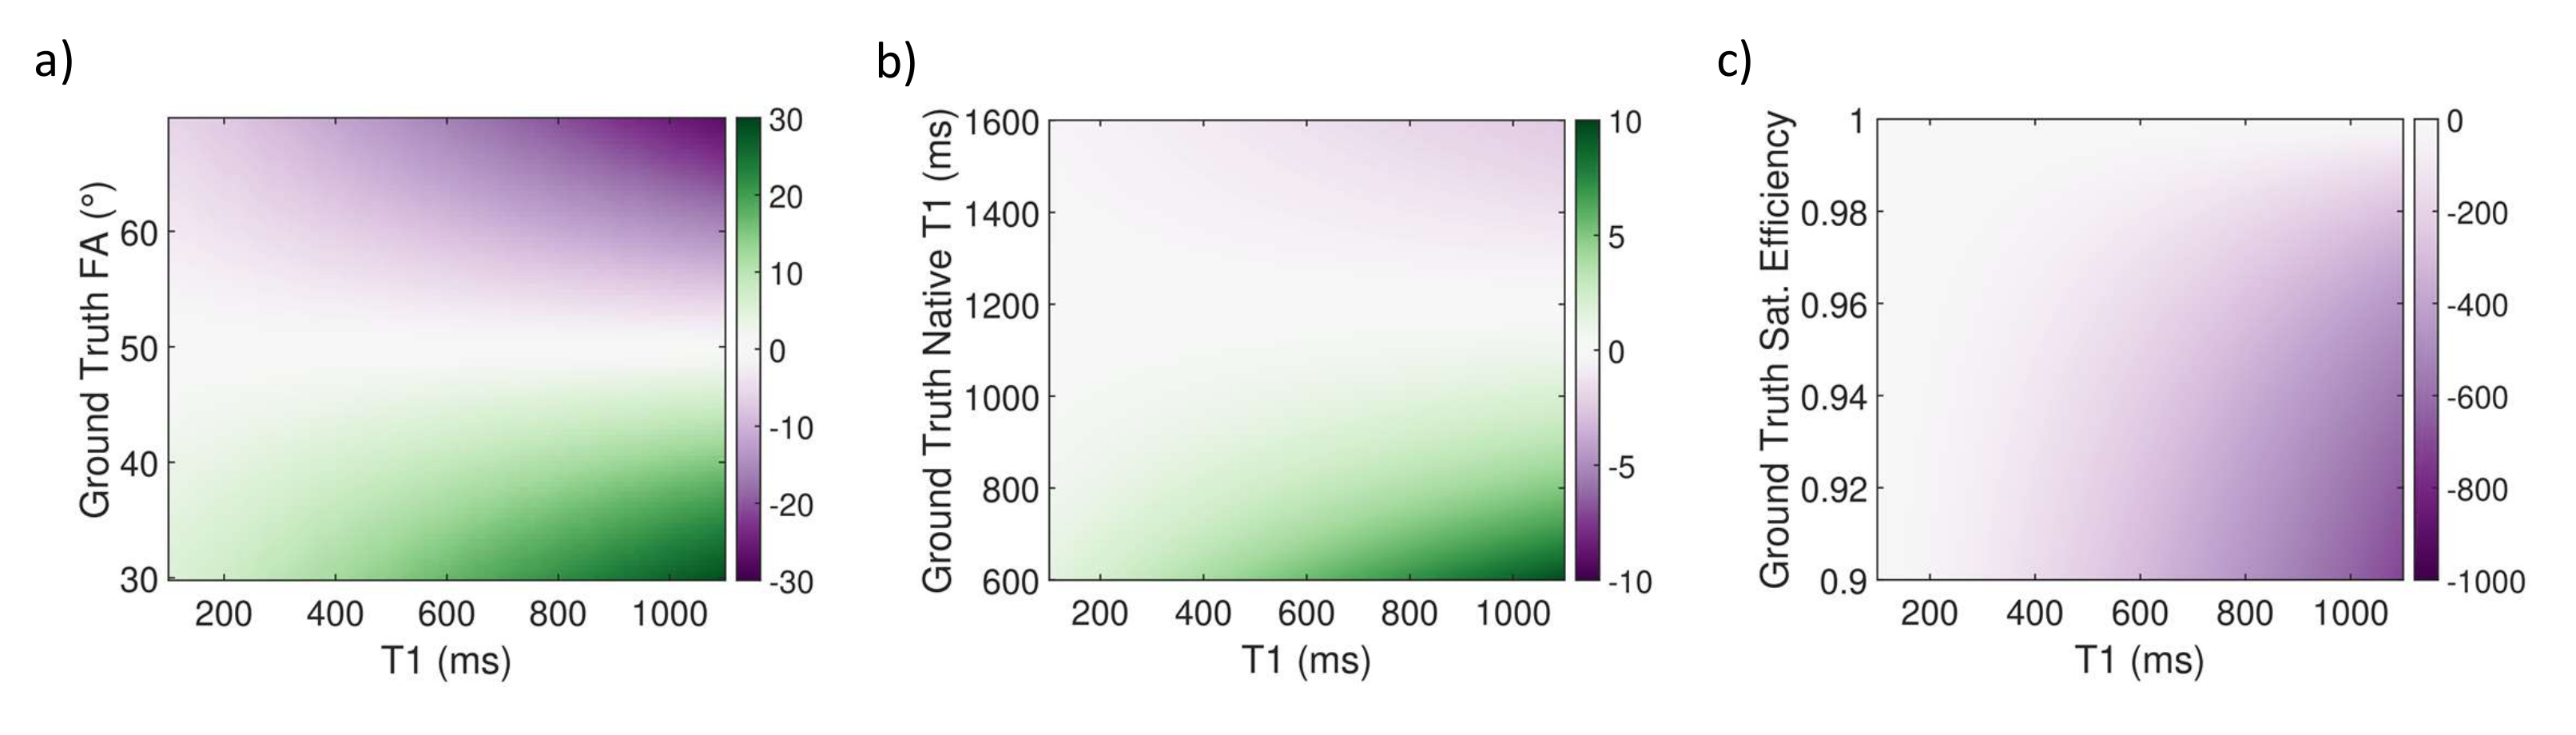
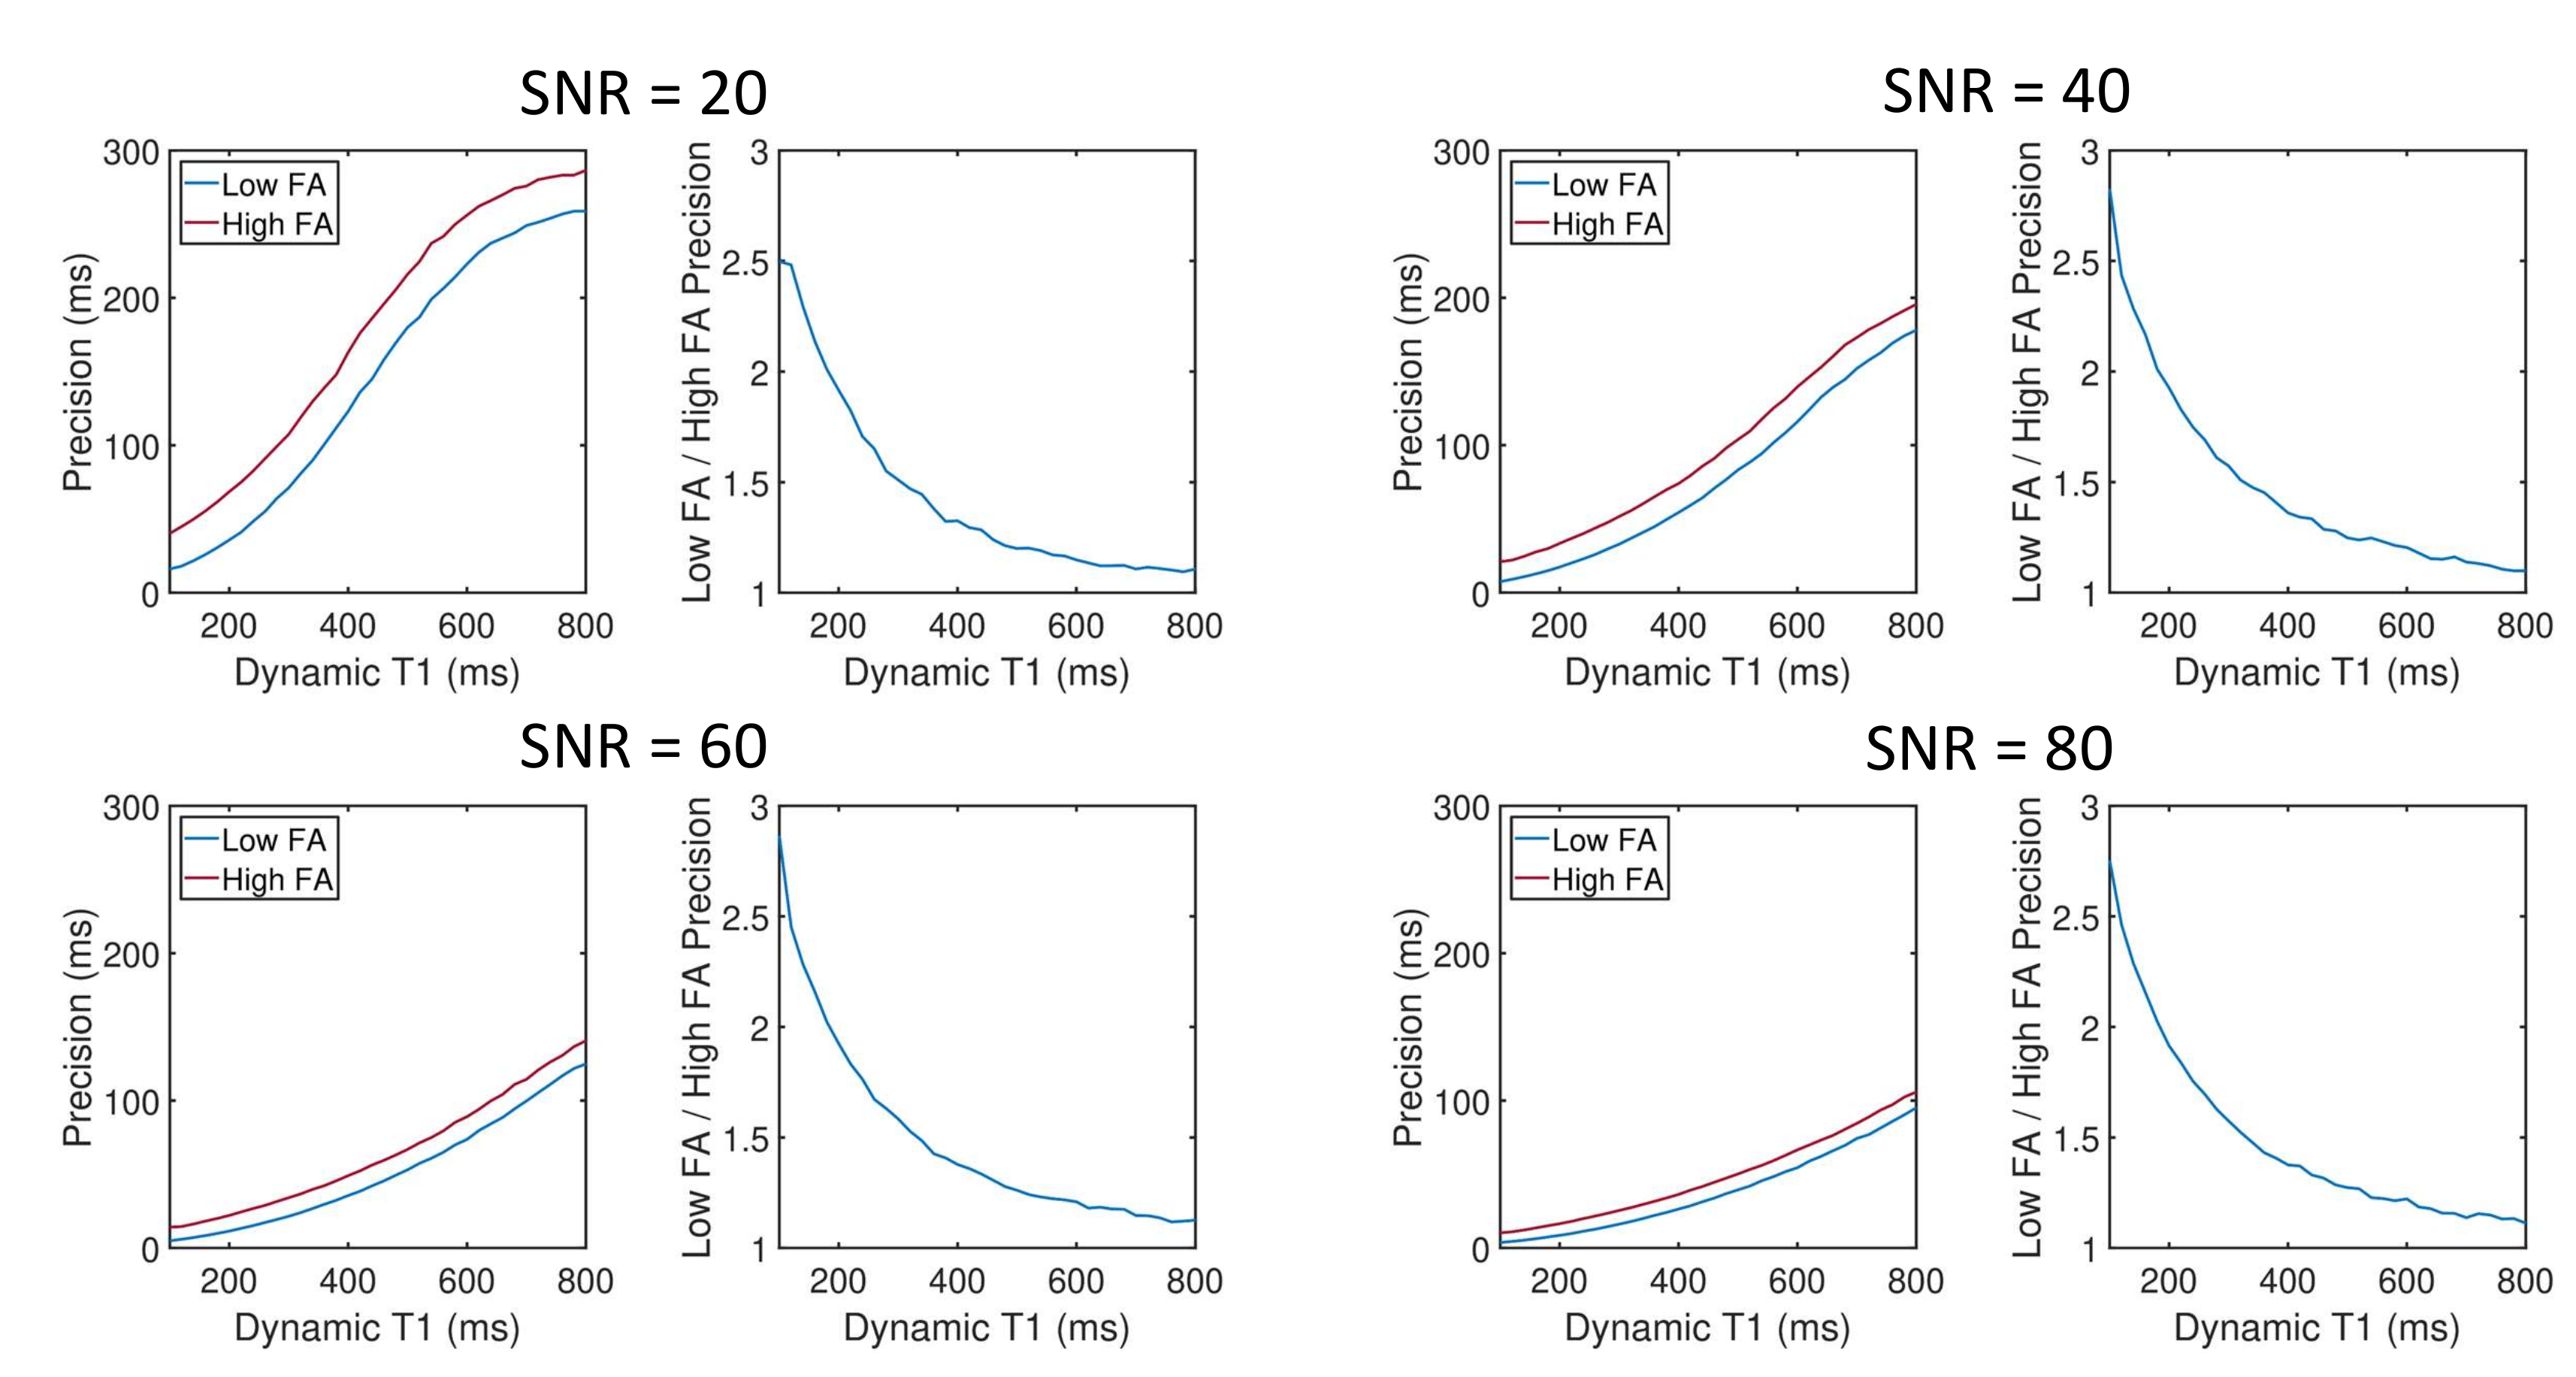
Simulations: The following fixed parameters were used in creation of the signal-T1 dictionary: Native T1=1200ms, Native T2=50ms, Flip angle=50˚, Saturation Efficiency=100%. Simulations were carried out to assess any potential biases in T1 estimates as a result of these fixed parameters. The precision of T1 values estimated using the HFA and LFA techniques was also characterised in simulations for a range of signal-to-noise ratios.
In-vivo Evaluation: The proposed sequence was evaluated at 1.5T (MAGNETOM Aera, Siemens Healthcare, Erlangen, Germany) in 7 patients (4M, mean age:50±23yrs). All patients were recruited under ethical approval for 15 minutes additional scan time. Each subject underwent rest myocardial perfusion (contrast dose: 0.075mmol/kg) using the proposed sequence with the following sequence parameters: TR/TE/TS/FA: 2.45ms/1.04ms/94ms/50°, reference images LFA/HFA:8°/50°, saturation pulse:composite 90°-90°-90°, voxel size:1.9x1.9x10mm3, typical FOV:360x360mm2, number of slices:3, bandwidth:1302Hz/px, number of dynamics:60. Patients were asked to breathe gently for the duration of the perfusion acquisition, and inline motion correction (MOCO) was applied. The perfusion sequence was followed by a Modified Look-Locker inversion Recovery (MOLLI) sequence, acquired in a single mid-short-axis slice to reduce bias from gadolinium wash-out/ T1 recovery. Dynamic T1 maps were created using both the LFA and HFA technique for all patients, as described above. Mean myocardial T1 estimates at the end of the perfusion sequence were calculated for LFA, HFA and MOLLI techniques for the mid-short-axis slice using an AHA myocardial segment representation5. For LFA and HFA techniques, the T1 was calculated as the mean T1 estimate over the last 5 perfusion dynamics to reduce the impact of noise. Precision of T1 estimates was calculated for LFA and HFA techniques as the mean over last 20 dynamics of the spatial standard deviation (SD) of T1.
Results
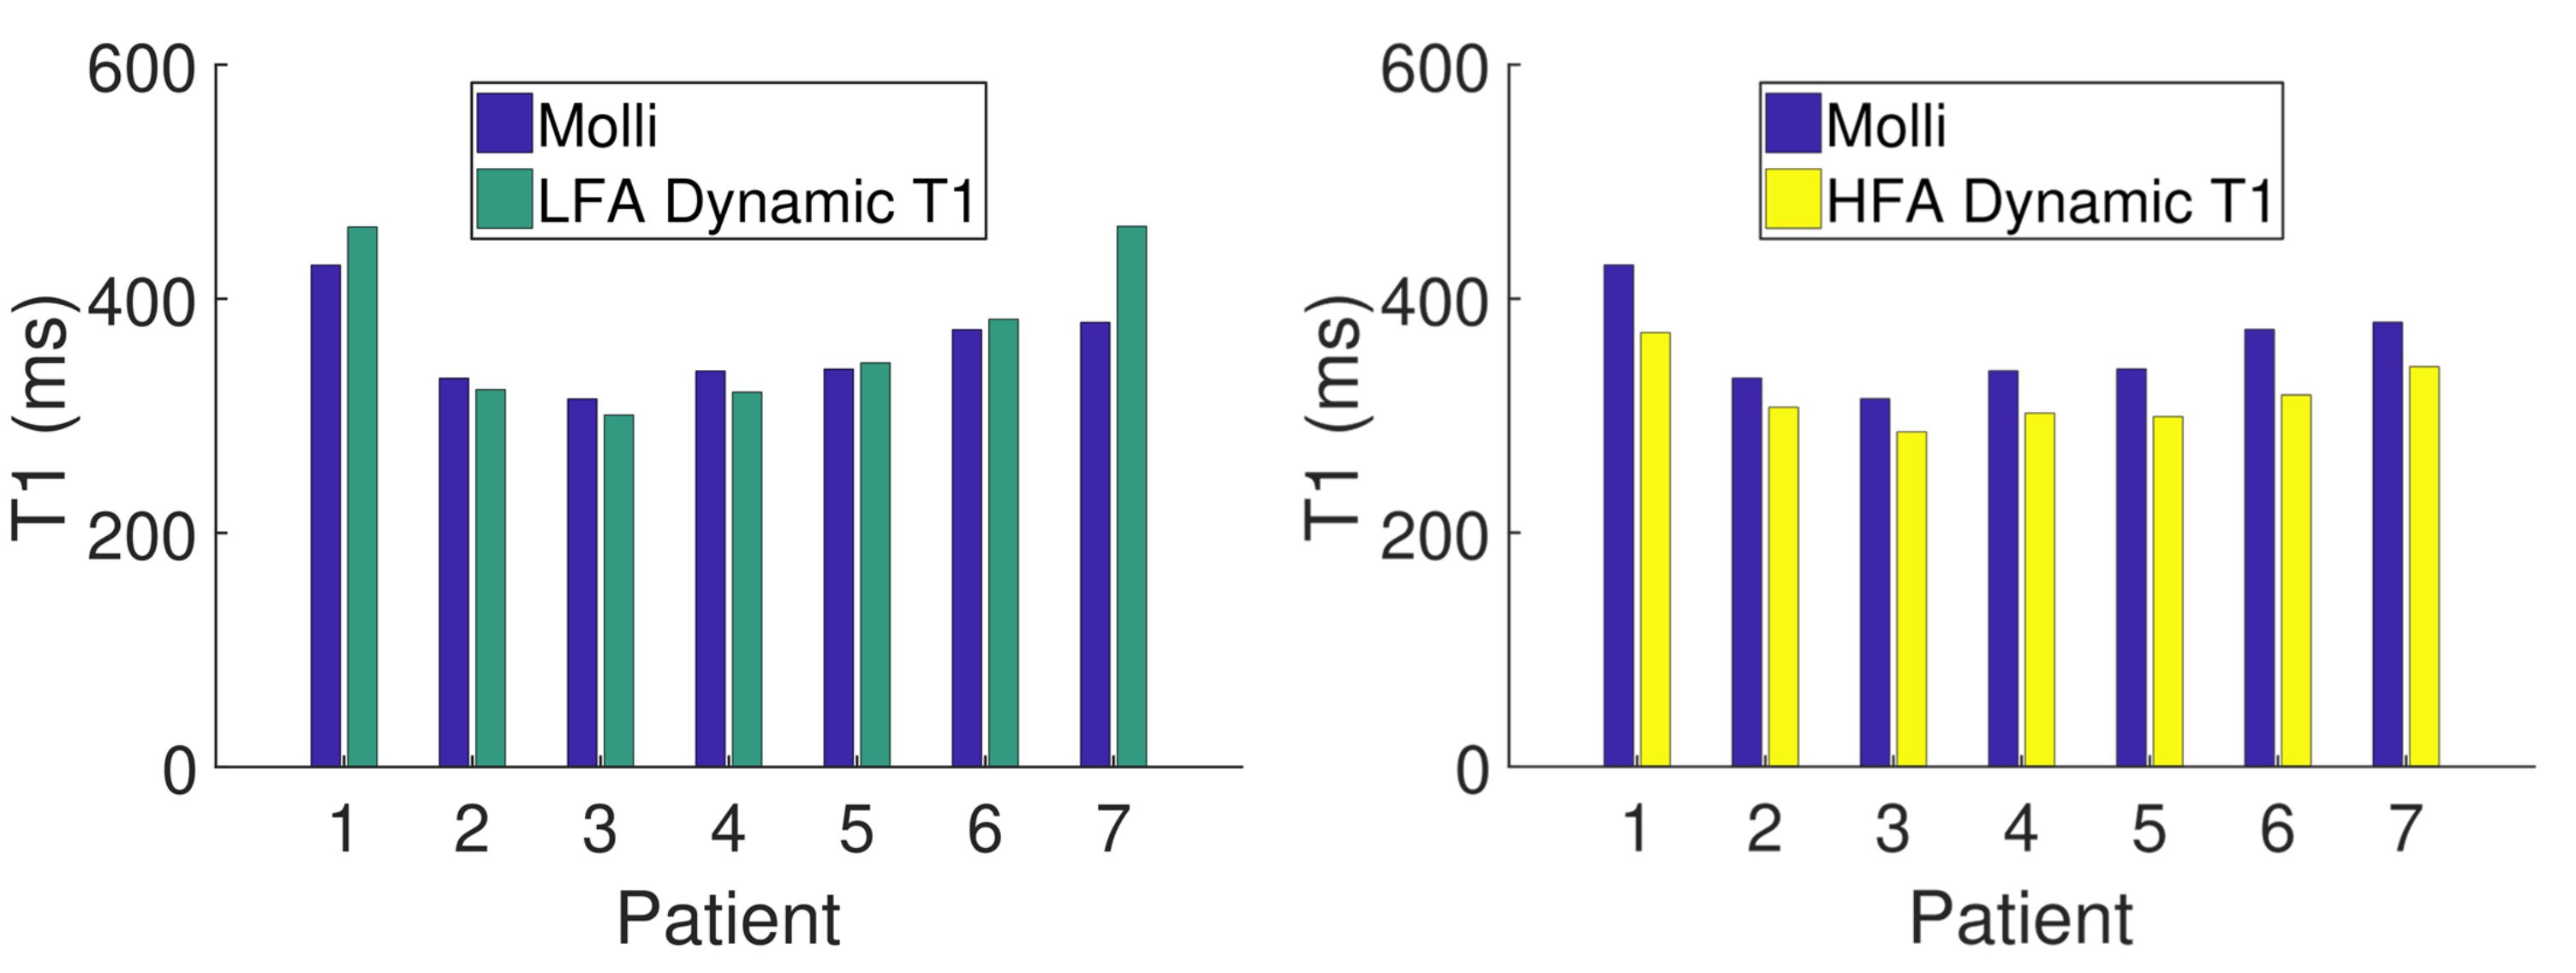
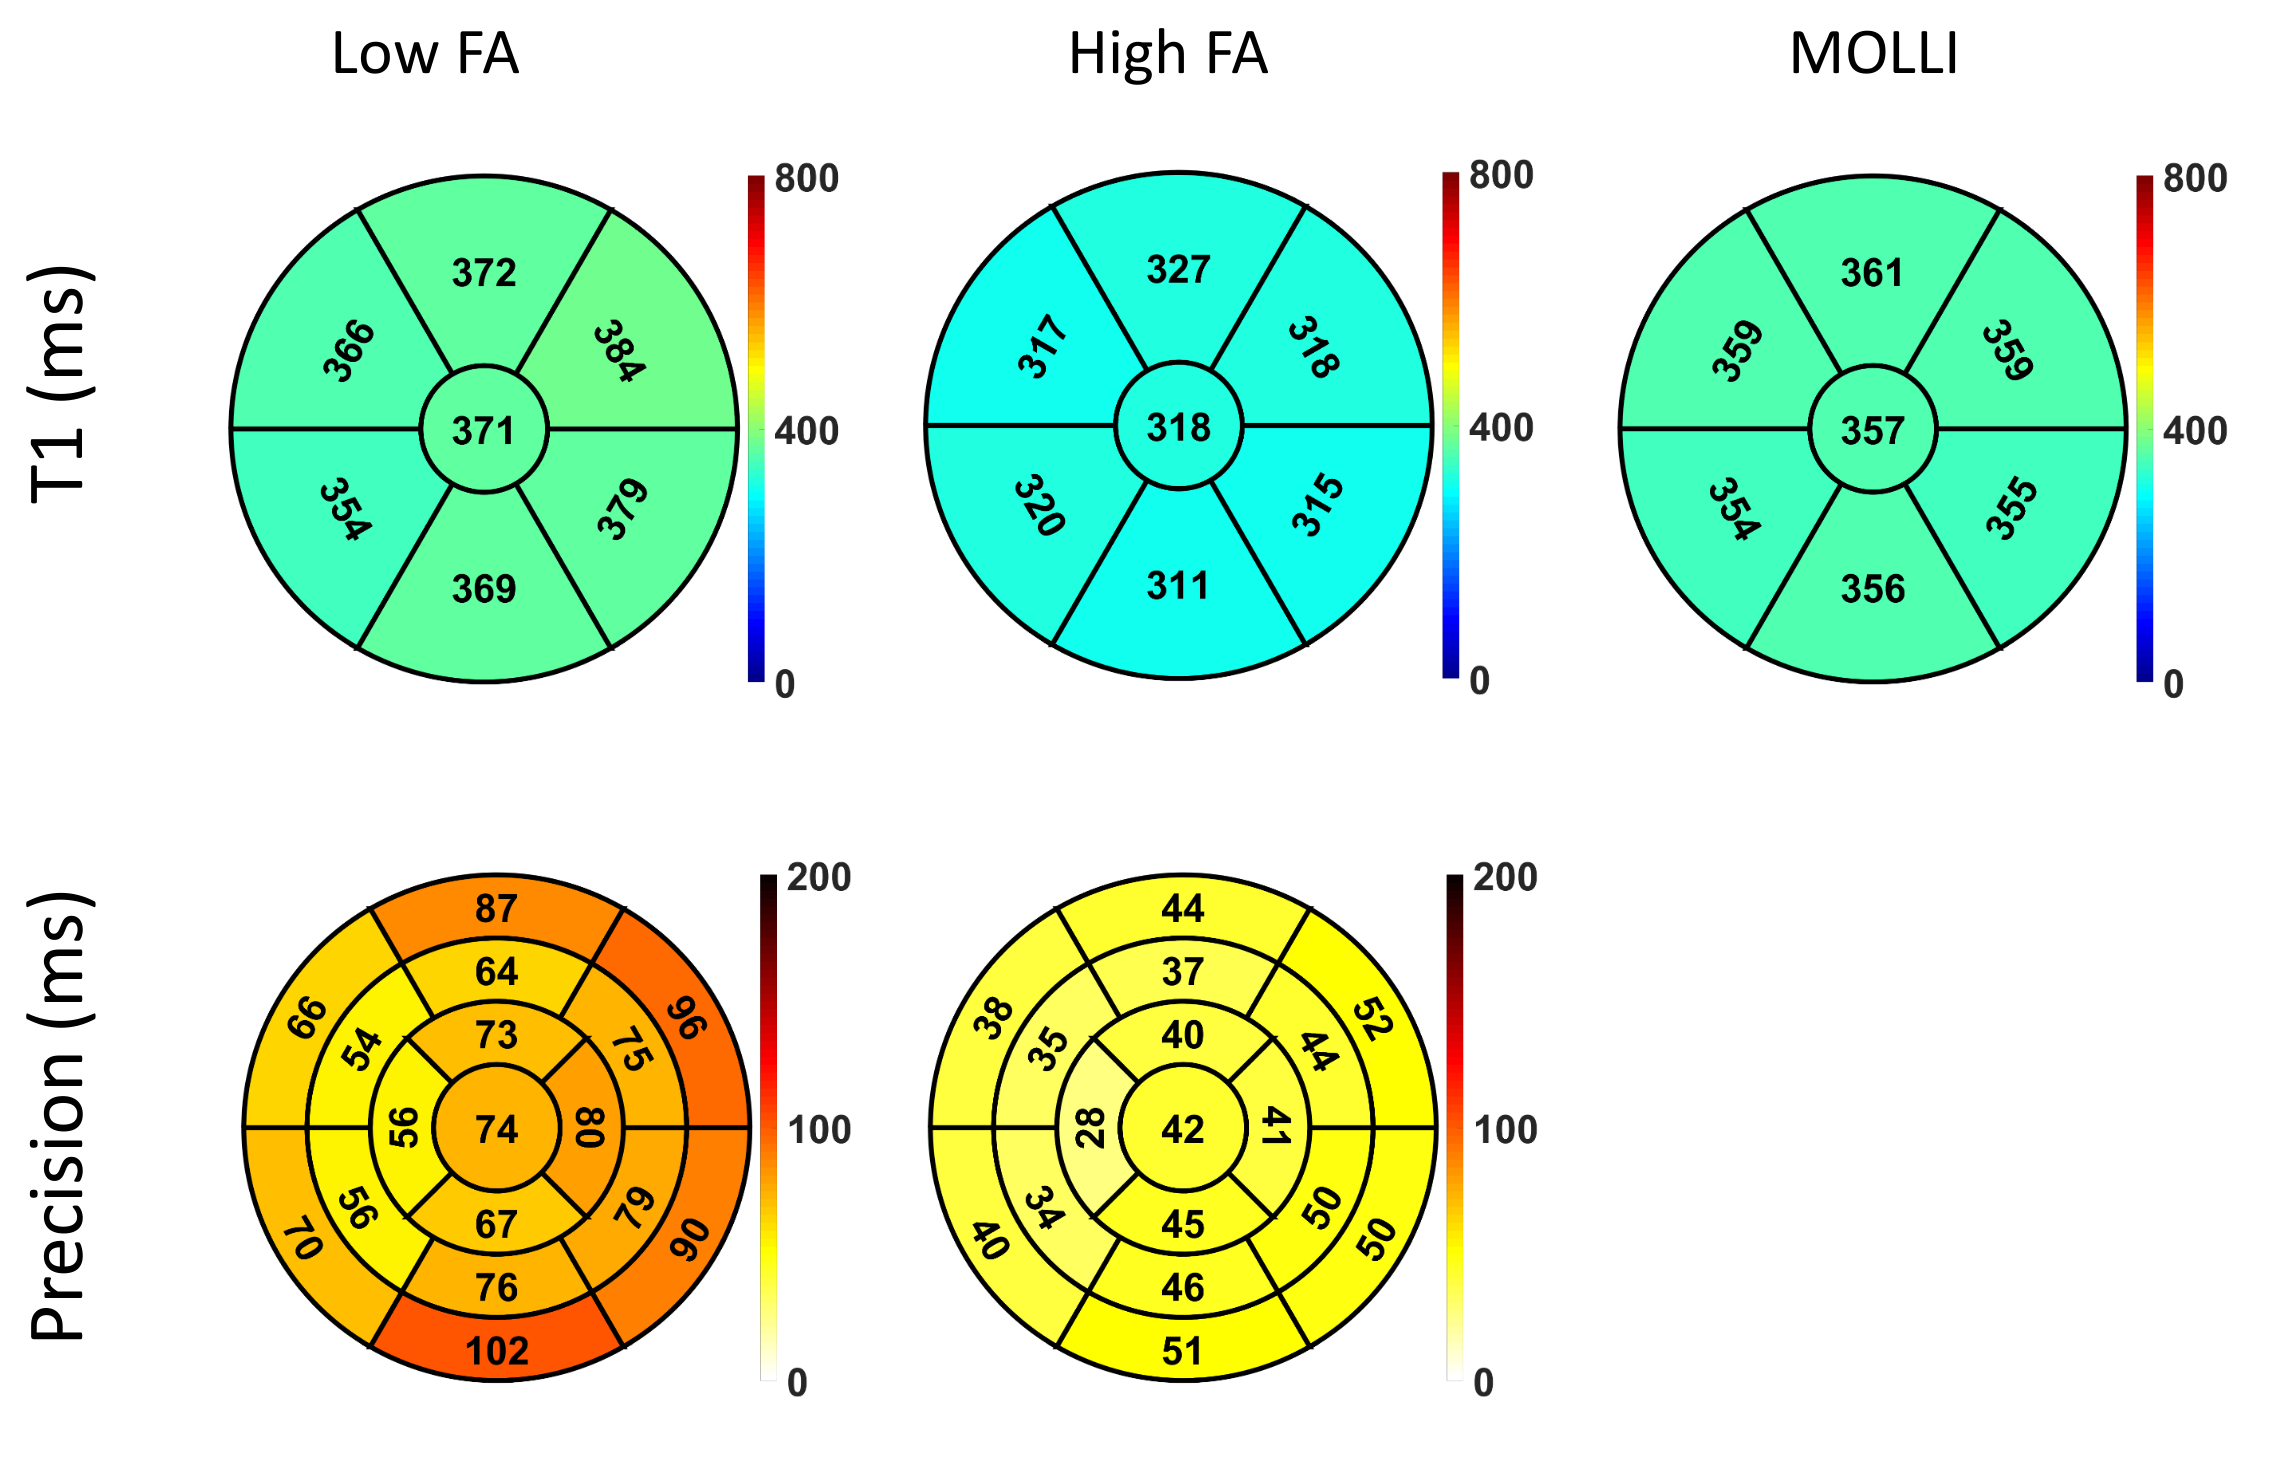
Simulations showed that errors in imaging FA and native T1 prescribed in the modelling framework have limited impact on T1 estimates using a HFA approach (<3% and <1% respectively, Fig.1a-b), while imperfect saturation efficiency can result in significant T1 errors (up to 50%/30% for baseline/typical perfusion T1 times, Fig.1c). HFA resulted in improved precision by a factor of 1.5-3 when compared to LFA for a typical T1 range of 100-300ms (Fig.2).Example dynamic T1 maps produced using the HFA technique are presented in Fig.3. Fig.4 shows the mean HFA, LFA and MOLLI T1 estimates for each patient. The top row of Fig.5 shows the average T1 values across all patients for each segment and averaged over all 6 segments (centre of bullseye plot). The HFA approach demonstrates consistent T1 underestimation in all patients, with an average underestimation bias across all patients and all segments of 39 ms. The LFA approach overestimated T1 in 4 patients and underestimated T1 in 3 patients, resulting in an average overestimation bias across all patients and all segments of 14ms. The HFA approach reduced the T1 SD by 45% on average compared to the LFA approach (Fig.5, bottom).
Discussion
Dynamic T1 estimates were underestimated compared to MOLLI using the HFA approach which may be due to imperfect saturation efficiency and wash-out of gadolinium between perfusion and MOLLI imaging. Further optimisation of this technique to improve or correct for saturation efficiency is warranted to improve accuracy of T1 estimation. The impact of reduced T1 SD using the HFA technique on the precision of MBF quantification will be investigated in future work.Conclusion
Dynamic T1 estimation for first-pass perfusion bSSFP imaging using a HFA reference image improves precision of T1 estimates used for MBF quantification compared to a LFA technique.Acknowledgements
This work was supported by the EPSRC grant (EP/R010935/1), the Wellcome EPSRC Centre for Medical Engineering at Kings College London (WT 203148/Z/16/Z), the National Institute for Health Research (NIHR) Biomedical Research Centre based at Guy’s and St Thomas’ NHS Foundation Trust and King’s College London, and Siemens Healthineers. The views expressed are those of the authors and not necessarily those of the NHS, the NIHR or the Department of Health.References
1. Utz W, Niendorf T, Wassmuth R, Messroghli D, Dietz R, Schulz-Menger J. Contrast–dose relation in first-pass myocardial MR perfusion imaging. Journal of Magnetic Resonance Imaging. 2007;25(6):1131-1135. doi:10.1002/jmri.20910
2. Kellman P, Hansen MS, Nielles-Vallespin S, et al. Myocardial perfusion cardiovascular magnetic resonance: optimized dual sequence and reconstruction for quantification. Journal of Cardiovascular Magnetic Resonance. 2017;19(1). doi:10.1186/s12968-017-0355-5
3. Cernicanu A, Axel L. Theory-Based Signal Calibration with Single-Point T1 Measurements for First-Pass Quantitative Perfusion MRI Studies. Academic Radiology. 2006;13(6):686-693. doi:10.1016/j.acra.2006.02.040
4. Wang Y, Moin K, Akinboboye O, Reichek N. Myocardial first pass perfusion: Steady-state free precession versus spoiled gradient echo and segmented echo planar imaging. Magnetic Resonance in Medicine. 2005;54(5):1123-1129. doi:10.1002/mrm.20700
5. Cerqueira MD, Weissman NJ, Dilsizian V et al. Standardized myocardial segmentation and nomenclature for tomographic imaging of the heart. A statement for healthcare professionals from the Cardiac Imaging Committee of the Council on Clinical Cardiology of the American Heart Association, Circulation. 2002;105:539-542
Figures