2092
The importance of myocardial SNR in myocardial blood flow quantification derived from first-pass cardiac perfusion CMR1Radiology, Northwestern University, Chicago, IL, United States, 2Translational and Molecular Imaging Institute and Department of Radiology, Icahn School of Medicine at Mount Sinai, New York, NY, United States, 3National Heart, Lung, and Blood Institute, National Institutes of Health, Bethesda, MD, United States, 4Division of Cardiology, Internal Medicine, Northwestern University, Chicago, IL, United States
Synopsis
We have recently developed a perfusion CMR pulse sequence using golden angle radial acquisitions and CS reconstruction. The radial k-space sampling allows retrospective manipulation of saturation-recovery time (TS) using k-space weighted image contrast (KWIC) filtering. This study was conducted to determine the importance of SNR in myocardial blood flow quantification derived from cardiac perfusion CMR. Our analysis shows that mean resting MBF values decreases with TS, where the result with the highest TS = 95 ms agrees best with literature value reported by cardiac PET studies.
Introduction
Myocardial blood flow (MBF) quantification provides a means to increase diagnostic accuracy in diffuse and/or microvascular coronary artery disease. There are several competing factors that determine accuracy in MBF, including arterial input function (AIF), signal-to-noise ratio (SNR), spatial resolution, and myocardial coverage. A recently developed cardiac perfusion cardiovascular magnetic resonance (CMR) pulse sequence using radial k-space sampling with tiny golden angles and compressed sensing (CS) demonstrated a good balance of the aforementioned factors.1 Another advantage of this approach is its capability to retrospectively manipulate the effective saturation-recovery time (TS) using k-space weighted image contrast (KWIC)2 filtering. In this study, we sought to investigate the importance of myocardial SNR in MBF quantification by retrospectively changing the TS on same cardiac perfusion k-space datasets using KWIC filtering.Materials and Methods
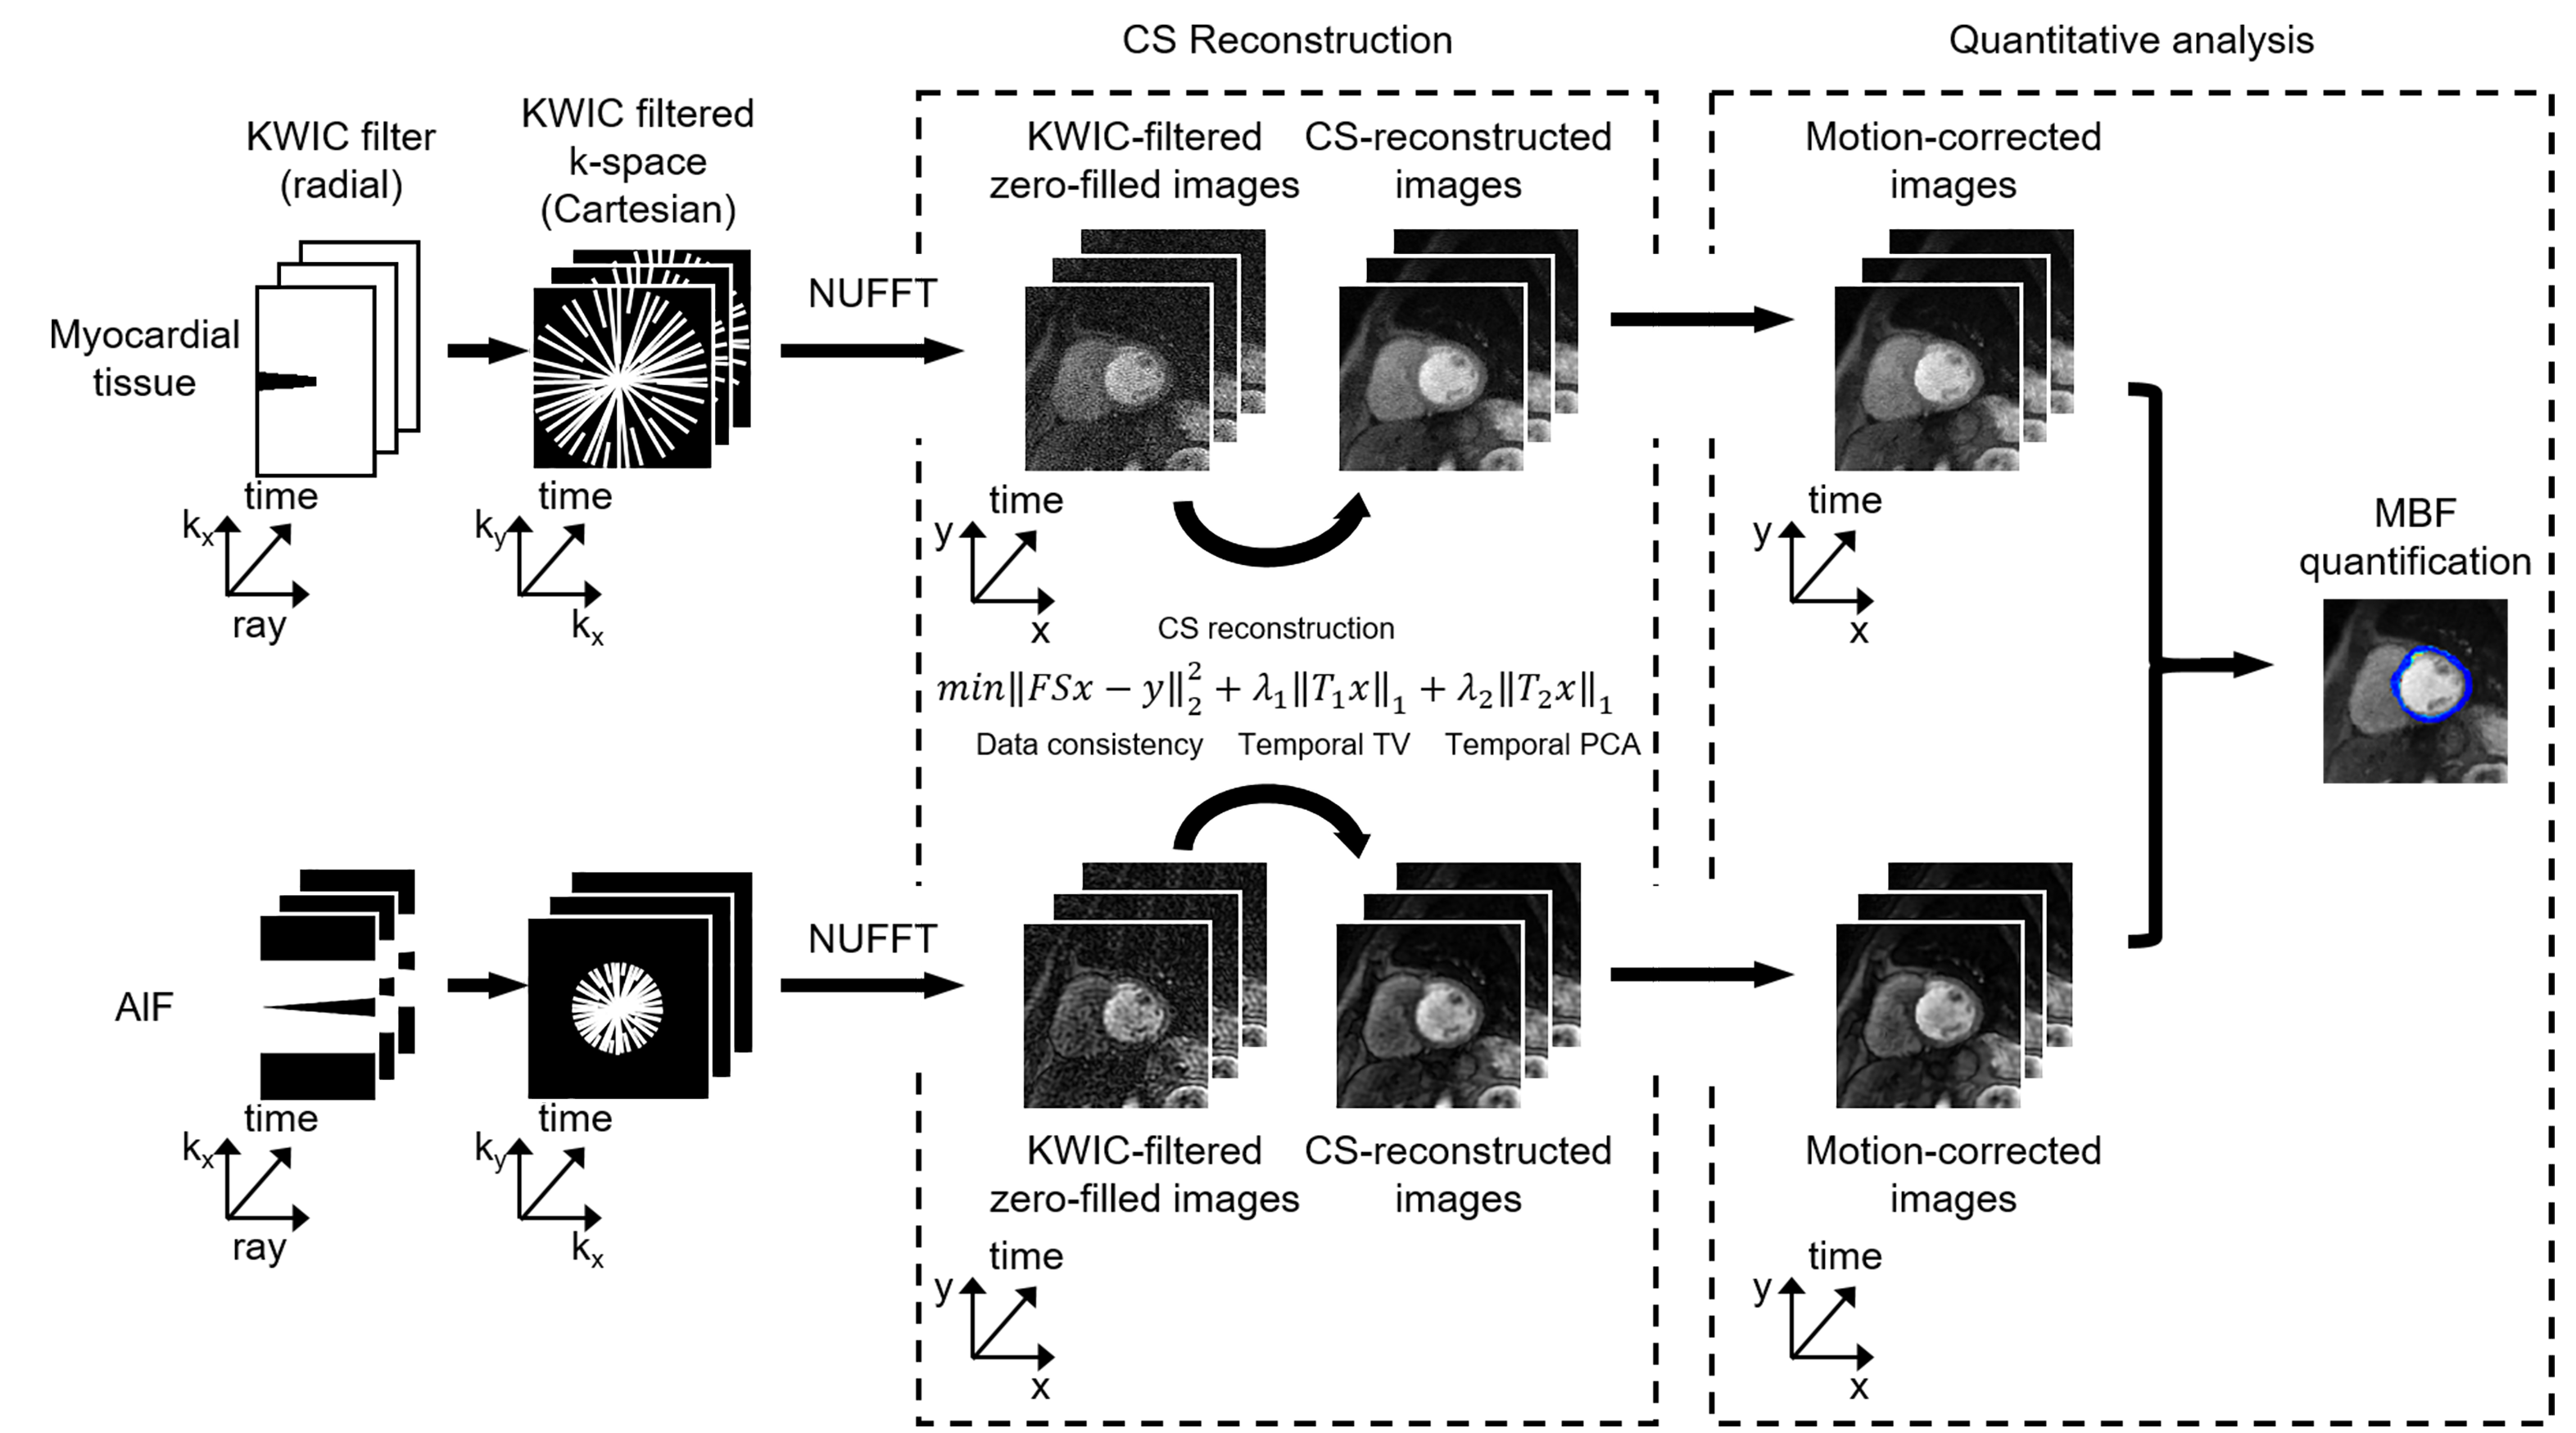
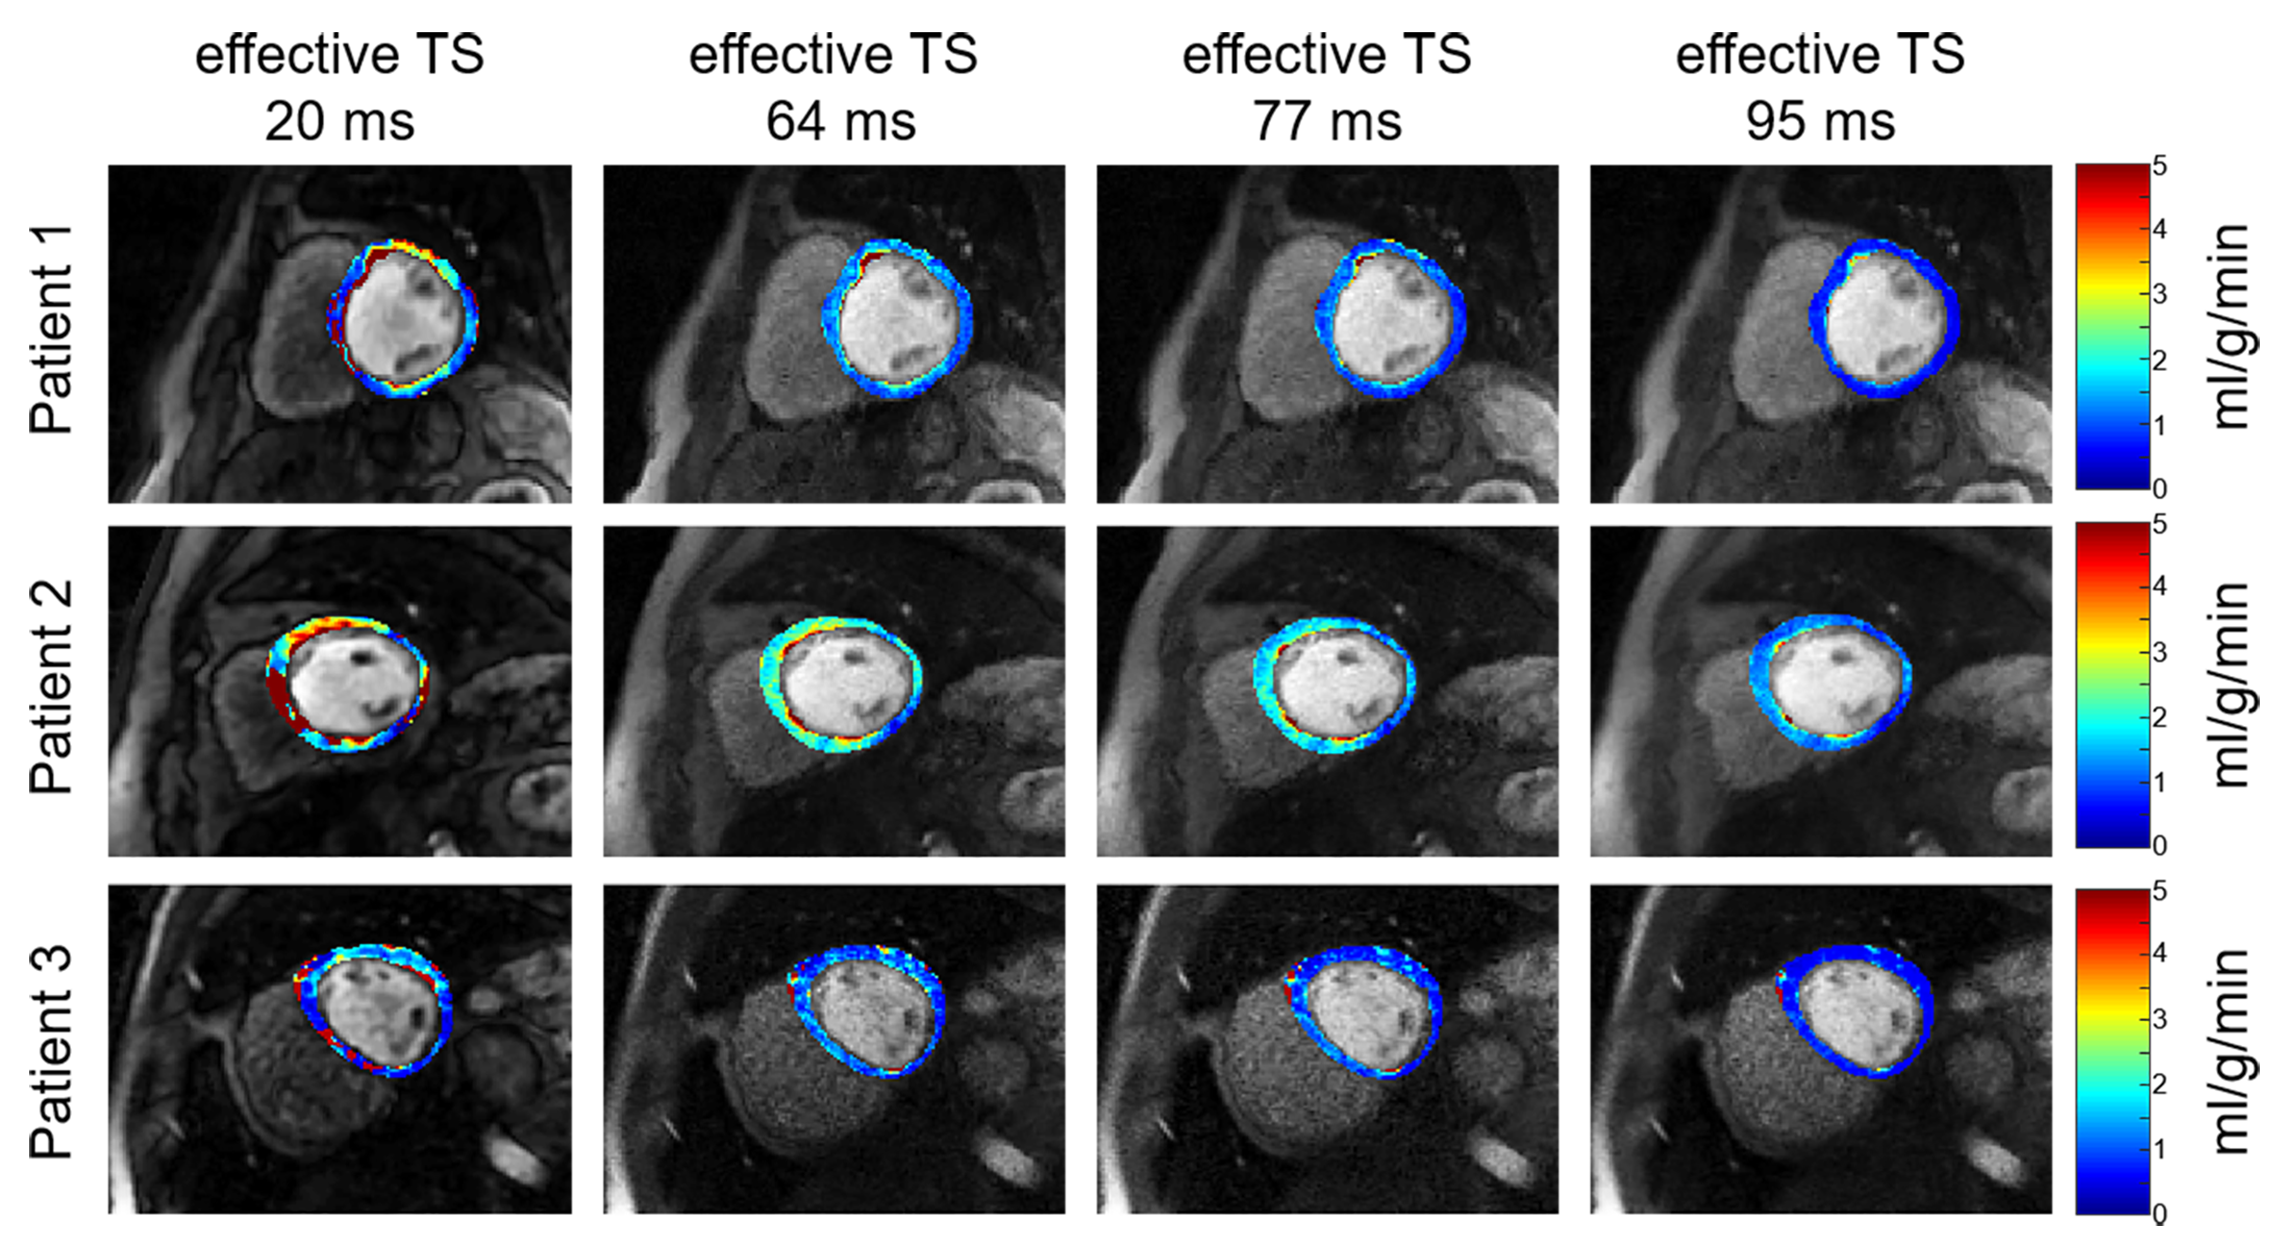
Patients 14 consecutive patients (age 51 ± 17 years; 11 males and 3 females) were recruited in this study. Resting cardiac perfusion CMR was conducted during free breathing with administration of 0.1 mmol/kg of gadobutrol at a rate of 5 ml/s, followed by a 20 ml saline flush at the same rate. Written informed consent was obtained from all patients prior to MRI scans. CMR experiment All studies were performed using a whole-body 1.5 T MRI scanner (Avanto, Siemens) using standard coil arrays (up to 15 coil elements). The relevant imaging parameters were: flip angle = 15º, FOV = 300 x 300 mm2, acquisition matrix = 192 x 192, nominal spatial resolution = 1.6 x 1.6 mm2, slice thickness = 8 mm, TR/TE = 2.6/1.8 ms, readout duration = 78 ms (30 rays), receiver bandwidth = 745 Hz/pixel, 75 repetitions and 3 to 4 short-axis slices per heartbeat. Proton density images were obtained during the first two heartbeats with the saturation pulse not played. For the last 2 heartbeats, we obtained k-space trajectory calibration scans composed of 30 rays per slice with a pair with opposite polarities per angle (12º angular steps). Image reconstruction Schematic flowchart of image reconstruction is shown in Figure 1. During preprocessing, we applied k-space trajectory correction using the previously described method.3 To accelerate the reconstruction, we applied software coil compression using PCA4 and used the gpuNUFFT library5. As shown in Figure 2, we considered 4 KWIC filters to achieve effective TS = 20, 64, 77, and 95 ms, where longer TS translates to higher myocardial SNR. For AIF quantification, only the basal slice was reconstructed with effective TS 20 = ms, and the same AIF was used for all myocardial wall reconstructions with different TS values. For assessing myocardial wall enhancement, images were reconstructed with KWIC filters retaining the last 25 (effective TS 64 ms), 15 (effective TS 77 ms) and 1 (effective TS 95 ms) rays of k-space center. The undersampled k-space datasets were reconstructed using GRASP6; temporal total variation (TTV) and temporal PCA (TPCA) were used as two orthogonal sparsifying transforms; normalized regularization weight 0.01 for TTV and 0.01 for TPCA; conjugate gradient with backtracking line search over 27 iterations. GRASP reconstructions were done in MATLAB (MathWorks, Natick, Massachusetts, USA) installed on a GPU workstation (NVIDIA Tesla V100, 16 GB RAM; Xeon E5-2620 2.10 GHz, 256 GB RAM). MBF quantification After performing an automatic nonrigid image registration7, signal was converted to [Gd] concentration using a Bloch equation-based signal modelling8, followed by MBF quantification assuming Fermi as the transfer function9. Data Analysis We used the same manually drawn endo- and epicardial contours for all four TS reconstructed images (since they are perfectly registered). SNR was calculated as mean signal intensity at peak blood enhancement divided by the standard deviation of noise. We calculated percentage of spurious pixels defined as MBF greater than 4 ml/g/min (peak value expected during vasodilation stress).Results
Figure 3 shows representative resting perfusion images and the corresponding MBF maps of three different patients reconstructed with different TS values. Visually, the homogeneity of resting MBF maps increases with TS. As summarized in Table 1, the myocardial SNR increases with TS, whereas the percentage of spurious pixels decreases with TS. Interestingly, mean MBF decreases with TS, where the result with the highest TS = 95 ms agrees best with literature value reported by cardiac PET studies.10Discussion
This study demonstrates the importance of myocardial SNR for quantification of MBF derived from first-pass cardiac perfusion CMR. Increasing the TS from 20 ms to 95 ms increases myocardial SNR and progressively homogenize MBF maps, while decreasing the mean MBF. Compared with resting MBF values reported in literature (example 1: 0.61-1.1 ml/g/min averaging 363 subjects overall from 23 cardiac PET studies10; example 2: 0.95-1.03 ml/g/min based on state-of-the-art quantitative perfusion CMR method11; example 3: 1.22ml/g/min based on another state-of-the-art quantitative perfusion CMR method12), resting MBF with highest TS = 95 ms agrees better with cardiac PET, which consistently reports slightly lower resting MBF than those reported by two leading CMR methods. It should be noted that increasing myocardial SNR by increasing TS needs to be counterbalanced by the need to sample multiple cardiac planes per heartbeat and avoid asymptotic part of the signal-to-gadolinium relationship (i.e. very high TS).Acknowledgements
Funding National Institutes of Health (R01HL116895, R01HL138578, R21EB024315, R21AG055954) and the American Heart Association (19IPLOI34760317).References
1. Naresh NK, Haji‐Valizadeh H, Aouad PJ, et al. Accelerated, first‐pass cardiac perfusion pulse sequence with radial k‐space sampling, compressed sensing, and k‐space weighted image contrast reconstruction tailored for visual analysis and quantification of myocardial blood flow. Magn Reson Med. 2019;81:2632–2643.
2. Song HK and Dougherty L. k-Space Weighted Image Contrast (KWIC) for Contrast Manipulation in Projection Reconstruction MRI. Magn Reson Med. 2000;44:825-832.
3. Block K, Uecker M. Simple Method for Adaptive Gradient-Delay Compensation in Radial MRI. In Proceedings of the 19th Annual Meeting of ISMRM, Montreal, Canada, 2011. Abstract 2816.
4. Huang F, Vijayakumar S, Li Y, Hertel S, Duensing GR. A software channel compression technique for faster reconstruction with many channels. Magn Reson Imaging. 2008;26:133-141.
5. Knoll F, Schwarzl A, Diwoky C, Sodickson DK. gpunufft - an opensource gpu library for 3d gridding with direct matlab interface. In Proceedings of the 22nd Annual Meeting of ISMRM, Milan, Italy, 2014. Abstract 4297.
6. Feng L, Grimm R, Block KT, et al. Golden-angle radial sparse parallel MRI: combination of compressed sensing, parallel imaging, and goldenangle radial sampling for fast and flexible dynamic volumetric MRI. Magn Reson Med. 2014;72:707–717.
7. Benovoy M, Jacobs M, Cheriet F, et al. Robust Universal Nonrigid Motion Correction Framework for First-PassCardiac MR Perfusion Imaging. J Magn Reson Imaging. 2017;46:1060–1072.
8. Cernicanu A, Axel L. Theory‐based signal calibration with single-point T1 measurements for first-pass quantitative perfusion MRI studies. Acad Radiol. 2006;13:686-693.
9. Christian TF, Rettmann DW, Aletras AH, et al. Absolute Myocardial Perfusion in Canines Measured by Using Dual-Bolus First-Pass MR Imaging. Radiology. 2004;232:677-684.
10. Murthy VL, Bateman TM, Beanlands RS, et al. Clinical Quantification of Myocardial Blood Flow Using PET: Joint Position Paper of the SNMMI Cardiovascular Council and the ASNC. J Nucl Med. 2018;59:273-293.
11. Kellman P, Hansen MS, Nielles-Vallespin S, et al. Myocardial perfusion cardiovascular magnetic resonance: optimized dual sequence and reconstruction for quantification. J Cardiovasc Magn Reson. 2017;19:43.
12. Hsu LY, Jacobs M, Benovoy M, et al. Diagnostic Performance of Fully Automated Pixel-Wise Quantitative Myocardial Perfusion Imaging by Cardiovascular Magnetic Resonance. JACC Cardiovasc Imaging. 2018;11:697-707.
Figures