2091
Myocardial perfusion quantification by cardiovascular magnetic resonance is significantly affected by the arterial input sampling location
Xenios Milidonis1, Russell Franks1, Kajol Verma1, Torben Schneider1,2, Javier Sánchez-González3, Sven Plein1, and Amedeo Chiribiri1
1King's College London, London, United Kingdom, 2Philips Healthcare, Guilford, United Kingdom, 3Philips Healthcare, Madrid, Spain
1King's College London, London, United Kingdom, 2Philips Healthcare, Guilford, United Kingdom, 3Philips Healthcare, Madrid, Spain
Synopsis
The arterial input function (AIF) describes the contrast agent input to the myocardium and is required for blood flow quantification. However, the impact of the AIF sampling location on quantification by cardiovascular magnetic resonance and the diagnosis of coronary artery disease (CAD) has yet to be determined. In this study, perfusion imaging was performed in patients with suspected CAD and blood flow was quantified for seven different locations. It was found that the sampling location has a significant impact on blood flow measurements, while the ascending aorta led to the most accurate prediction of inducible perfusion abnormalities.
Introduction
Myocardial blood flow (MBF) quantification by cardiovascular magnetic resonance (CMR) first-pass perfusion has a high diagnostic accuracy in the identification of coronary artery disease (CAD).1-3 Quantification requires accurate sampling of the arterial input function (AIF) describing the contrast agent input to the myocardium.4 The current clinical reference location is the basal left ventricular blood pool, however, there is no evidence to support its use over alternative locations. The aim of this study was to compare adenosine stress MBF between seven different AIF sampling locations and determine which location has the highest diagnostic accuracy for the classification of inducible perfusion abnormalities by visual assessment.Methods
Twenty-five patients with suspected or known CAD underwent adenosine stress perfusion imaging on a 3T Philips Achieva system equipped with a 32-channel cardiac phased-array coil (Philips Healthcare, Best, The Netherlands). All patients gave written consent and the study was approved by the regional ethics committee (15/NS/0030). An ECG-triggered saturation recovery spoiled gradient echo dual-sequence technique was used,5 after injection of a contrast bolus at 0.075 mmol/kg (Gadovist, Bayer AG, Leverkusen, Germany). Three high-resolution slices were acquired at the basal, mid and apical short axis level of the left ventricle (TR 2.2 ms, TE 1.0 ms, saturation delay 100 ms, flip angle 15°, resolution 2.6x2.6 mm2, slice thickness 10 mm). A low-resolution slice (sequence parameters as above except saturation delay 23.5 ms and resolution 2.6x5.3 mm2) was acquired in 3-chamber view to allow sampling of the AIF at seven different locations by an experienced cardiologist: right ventricle (RV), left atrium (LA), basal left ventricle (bLV), mid left ventricle (mLV), apical left ventricle (aLV), ascending aorta (aAo) and descending aorta (dAo). Signal intensity was converted to gadolinium concentration,6 and then pixel-wise MBF was estimated using Fermi function-constrained deconvolution.7 Mean stress MBF over all three myocardial slices was compared between AIF sampling locations using analysis of variance with post hoc pairwise comparisons with Bonferroni correction. Dynamic perfusion images were visually examined by two independent level-3 experts to classify myocardial segments into ischemic or non-ischemic, based on a 16-segment model according to the American Heart Association.8 For each location, the diagnostic performance of stress MBF against visual assessment was evaluated using receiver operating characteristic (ROC) curves. Optimal sensitivity and specificity values were estimated using the Youden index and the area under the ROC curves (AUC) was compared using the DeLong method. Statistical significance was set at p < 0.05.Results
The sampled AIF curves had measured peak gadolinium concentrations ranging from 3.23 ± 1.25 mmol/L for the mLV to 6.18 ± 2.77 mmol/L for the RV. Stress MBF ranged from 1.94 ± 0.61 mL/g/min for the RV to 2.94 ± 1.36 mL/g/min for the aLV and was significantly different across AIF sampling locations (p = 0.002; Figure 1a). Pairwise comparisons revealed that mean stress MBF for the clinical reference bLV (2.64 ± 0.56 mL/g/min) differed significantly with the RV (p = 0.001). ROC analysis indicated that segmental stress MBF based on the aAo led to a better prediction of inducible perfusion abnormalities than all other locations (AUC 0.90 [95% confidence interval (CI) 0.87-0.93], sensitivity 80%, specificity 85%, p < 0.001; AUC compared against all other locations p < 0.01; Figure 1b). Segmental stress MBF for the bLV had a high sensitivity and a moderate specificity (AUC 0.81 [95% CI 0.77-0.85], sensitivity 91%, specificity 63%, p < 0.001), while the worst performing stress MBF was for the mLV (AUC 0.71 [95% CI 0.66-0.75], sensitivity 79%, specificity 52%, p < 0.001; AUC compared against all other locations p < 0.01). Analysis was based on 400 myocardial segments across all 25 patients, of which 100 (25%) were visually classified as ischemic. Figure 2 shows representative AIF curves for all seven sampling locations for a normal subject and Figure 3 demonstrates the impact on corresponding pixel-wise stress perfusion maps for the clinical reference location bLV and the aAo.Discussion
This is the first study to reveal that the AIF sampling location significantly affects absolute stress MBF estimates by CMR perfusion. Lower peak gadolinium concentrations in the AIF typically lead to higher MBF. Global alterations in MBF can render existing thresholds of ischemia invalid and therefore affect the clinical interpretation of perfusion maps and decision-making in the clinic. Indeed, ROC curve analysis suggests that different AIF sampling locations lead to different estimates of diagnostic accuracy. Segmental stress MBF for the aAo is diagnostically superior to estimates for the current clinical reference bLV and all other locations, most likely due to its close proximity to the coronary arteries. Use of this location for AIF sampling and MBF quantification is supported by the indicator-dilution theory,4 and is made possible by contemporary dual-sequence techniques for CMR perfusion that allow decoupling of the AIF and myocardial sampling locations.Conclusion
This study demonstrates that sampling the AIF in the aAo for myocardial perfusion quantification by CMR offers superior diagnostic accuracy than the bLV. However, future studies are required for its validation against reference techniques for CAD detection, such as invasive fractional flow reserve or positron emission tomography perfusion.Acknowledgements
XM, RF and AC were funded by the European Metrology Programme for Innovation and Research (EMPIR) project 15HLT05 PerfusImaging, which is co-funded by the European Union's Horizon 2020 research and innovation programme and the EMPIR Participating States. XM, RF and SP were funded by the British Heart Foundation [TG/18/2/33768, PG/18/71/34009, CH/16/2/32089]. Further support was received by the Department of Health (DoH) through the National Institute for Health Research (NIHR) comprehensive Biomedical Research Centre and Cardiovascular MedTech Co-operative awarded to Guy’s and St Thomas’ NHS Foundation Trust in partnership with King’s College London, and the Wellcome/EPSRC Centre for Medical Engineering [WT 203148/Z/16/Z]. TS and JSG are employees of Koninklijke Philips N.V. The views expressed are those of the authors and not necessarily those of the DoH, the NIHR, the NHS, the Wellcome Trust, the EPSRC or Koninklijke Philips N.V.References
- Villa ADM, Corsinovi L, Ntalas I et al. Importance of operator training and rest perfusion on the diagnostic accuracy of stress perfusion cardiovascular magnetic resonance. J Cardiovasc Magn Reson. 2018;20(1):74.
- Mordini FE, Haddad T, Hsu LY et al. Diagnostic accuracy of stress perfusion CMR in comparison with quantitative coronary angiography: fully quantitative, semiquantitative, and qualitative assessment. JACC Cardiovasc Imaging. 2014;7(1):14-22.
- Patel AR, Antkowiak PF, Nandalur KR et al. Assessment of advanced coronary artery disease: advantages of quantitative cardiac magnetic resonance perfusion analysis. J Am Coll Cardiol. 2010;56(7):561-569.
- Zierler KL. Theoretical Basis of Indicator-Dilution Methods for Measuring Flow and Volume. Circulation Research. 1962;10(3):393-407.
- Sanchez-Gonzalez J, Fernandez-Jimenez R, Nothnagel ND et al. Optimization of dual-saturation single bolus acquisition for quantitative cardiac perfusion and myocardial blood flow maps. J Cardiovasc Magn Reson. 2015;17:21.
- Henderson E, Sykes J, Drost D et al. Simultaneous MRI measurement of blood flow, blood volume, and capillary permeability in mammary tumors using two different contrast agents. J Magn Reson Imaging. 2000;12(6):991-1003.
- Jerosch-Herold M, Wilke N, Stillman AE. Magnetic resonance quantification of the myocardial perfusion reserve with a Fermi function model for constrained deconvolution. Med Phys. 1998;25(1):73-84.
- Cerqueira MD, Weissman NJ, Dilsizian V et al. Standardized myocardial segmentation and nomenclature for tomographic imaging of the heart. A statement for healthcare professionals from the Cardiac Imaging Committee of the Council on Clinical Cardiology of the American Heart Association. Circulation. 2002;105(4):539-542.
Figures
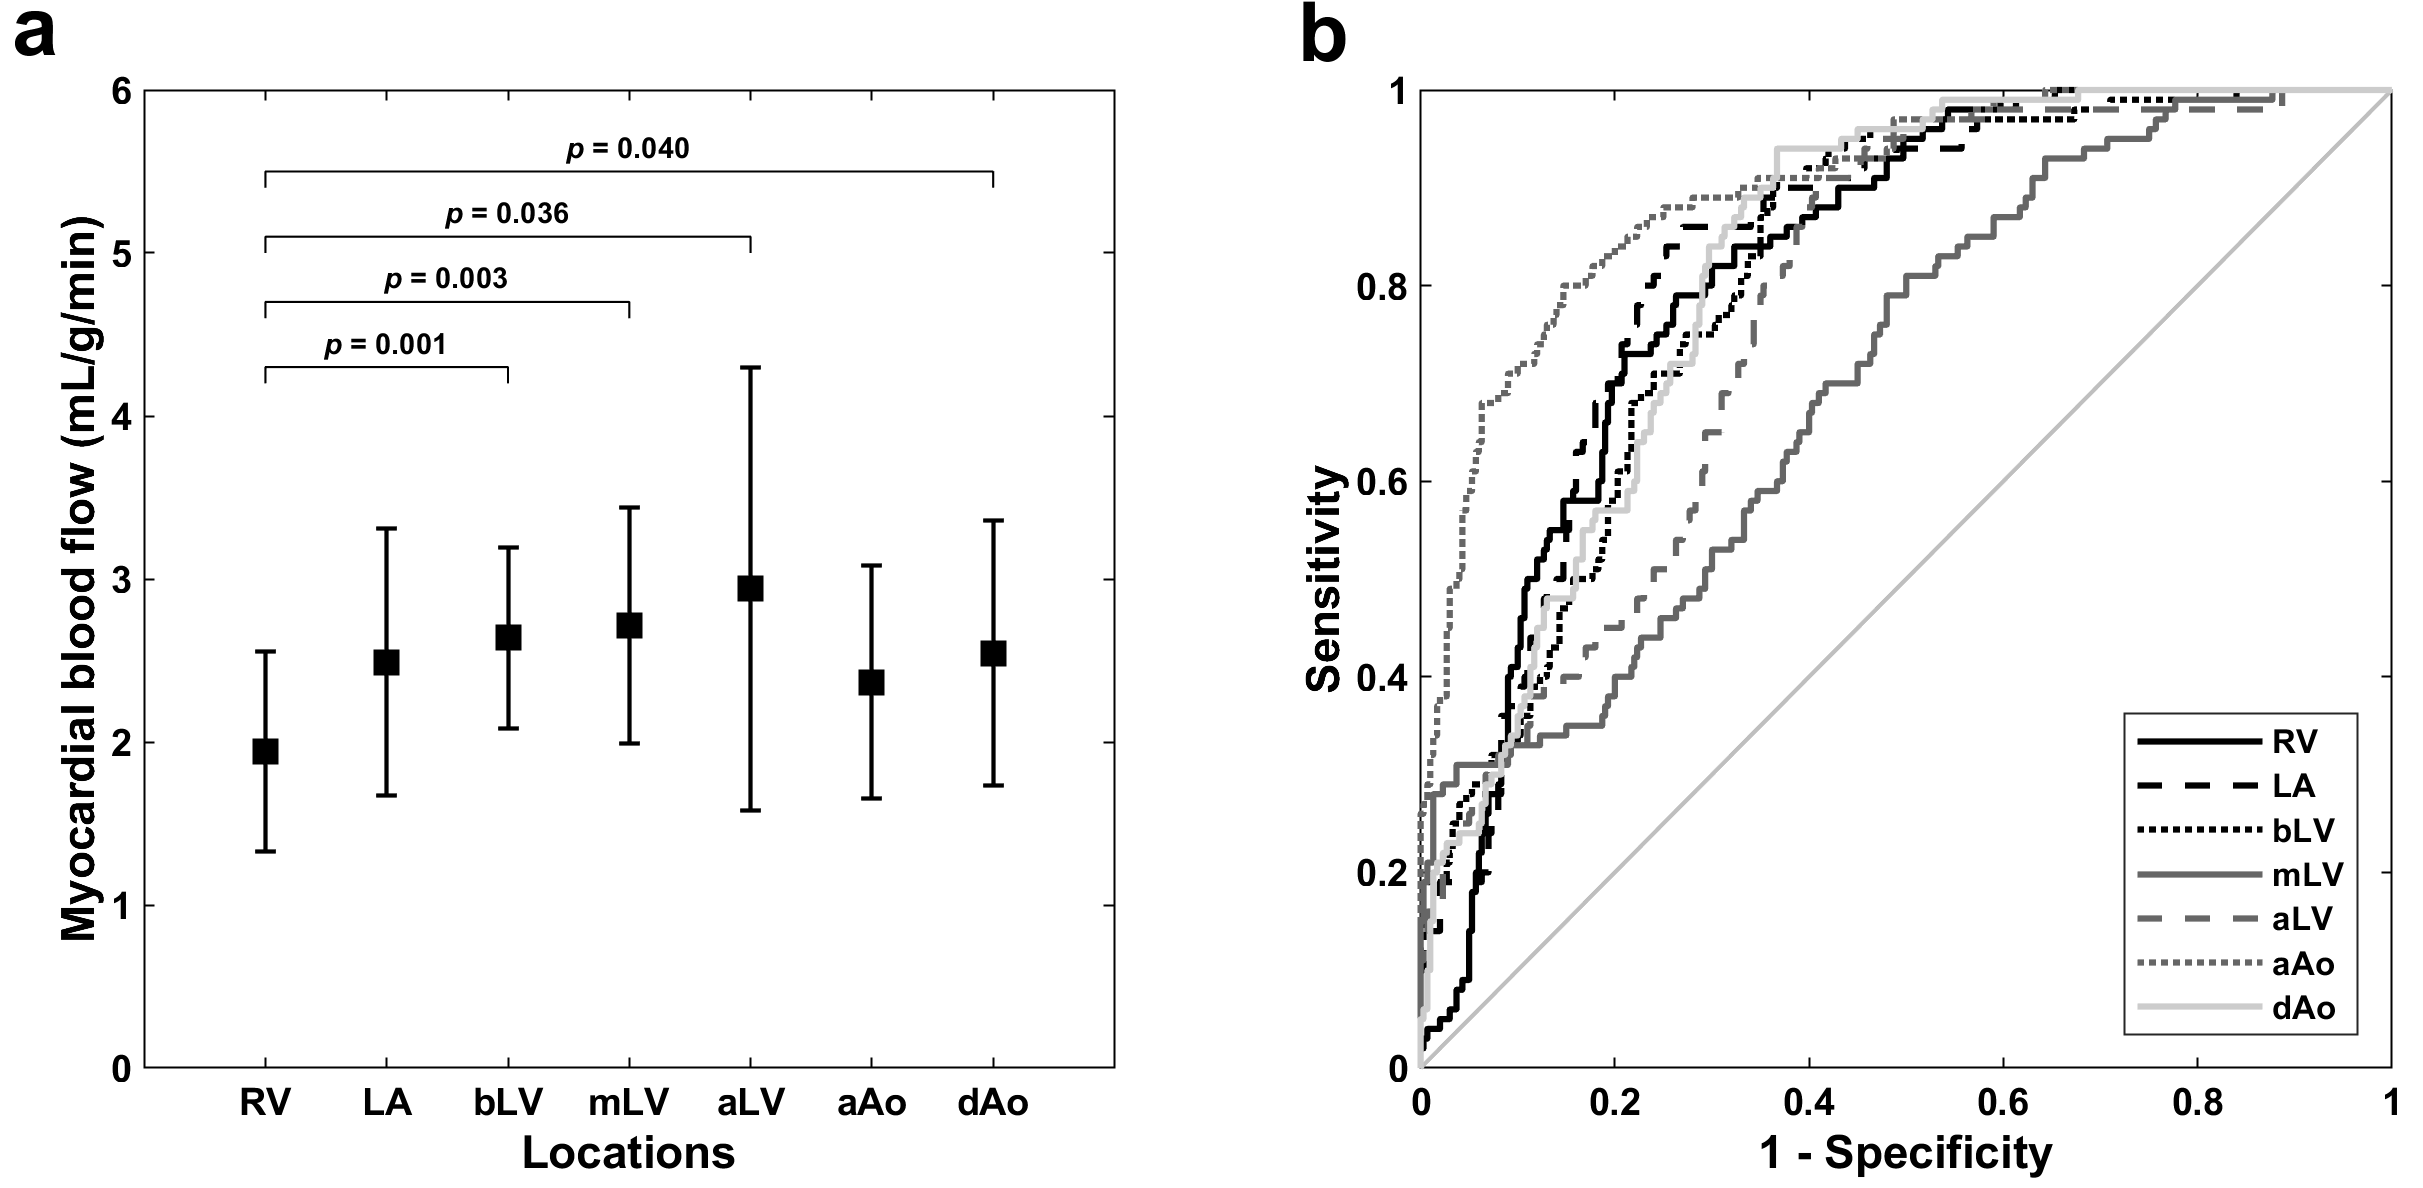
Figure 1. Mean stress myocardial blood flow (a) and receiver operating
characteristic curves for prediction of visually classified ischemic segments
(b) for seven different arterial input sampling locations.
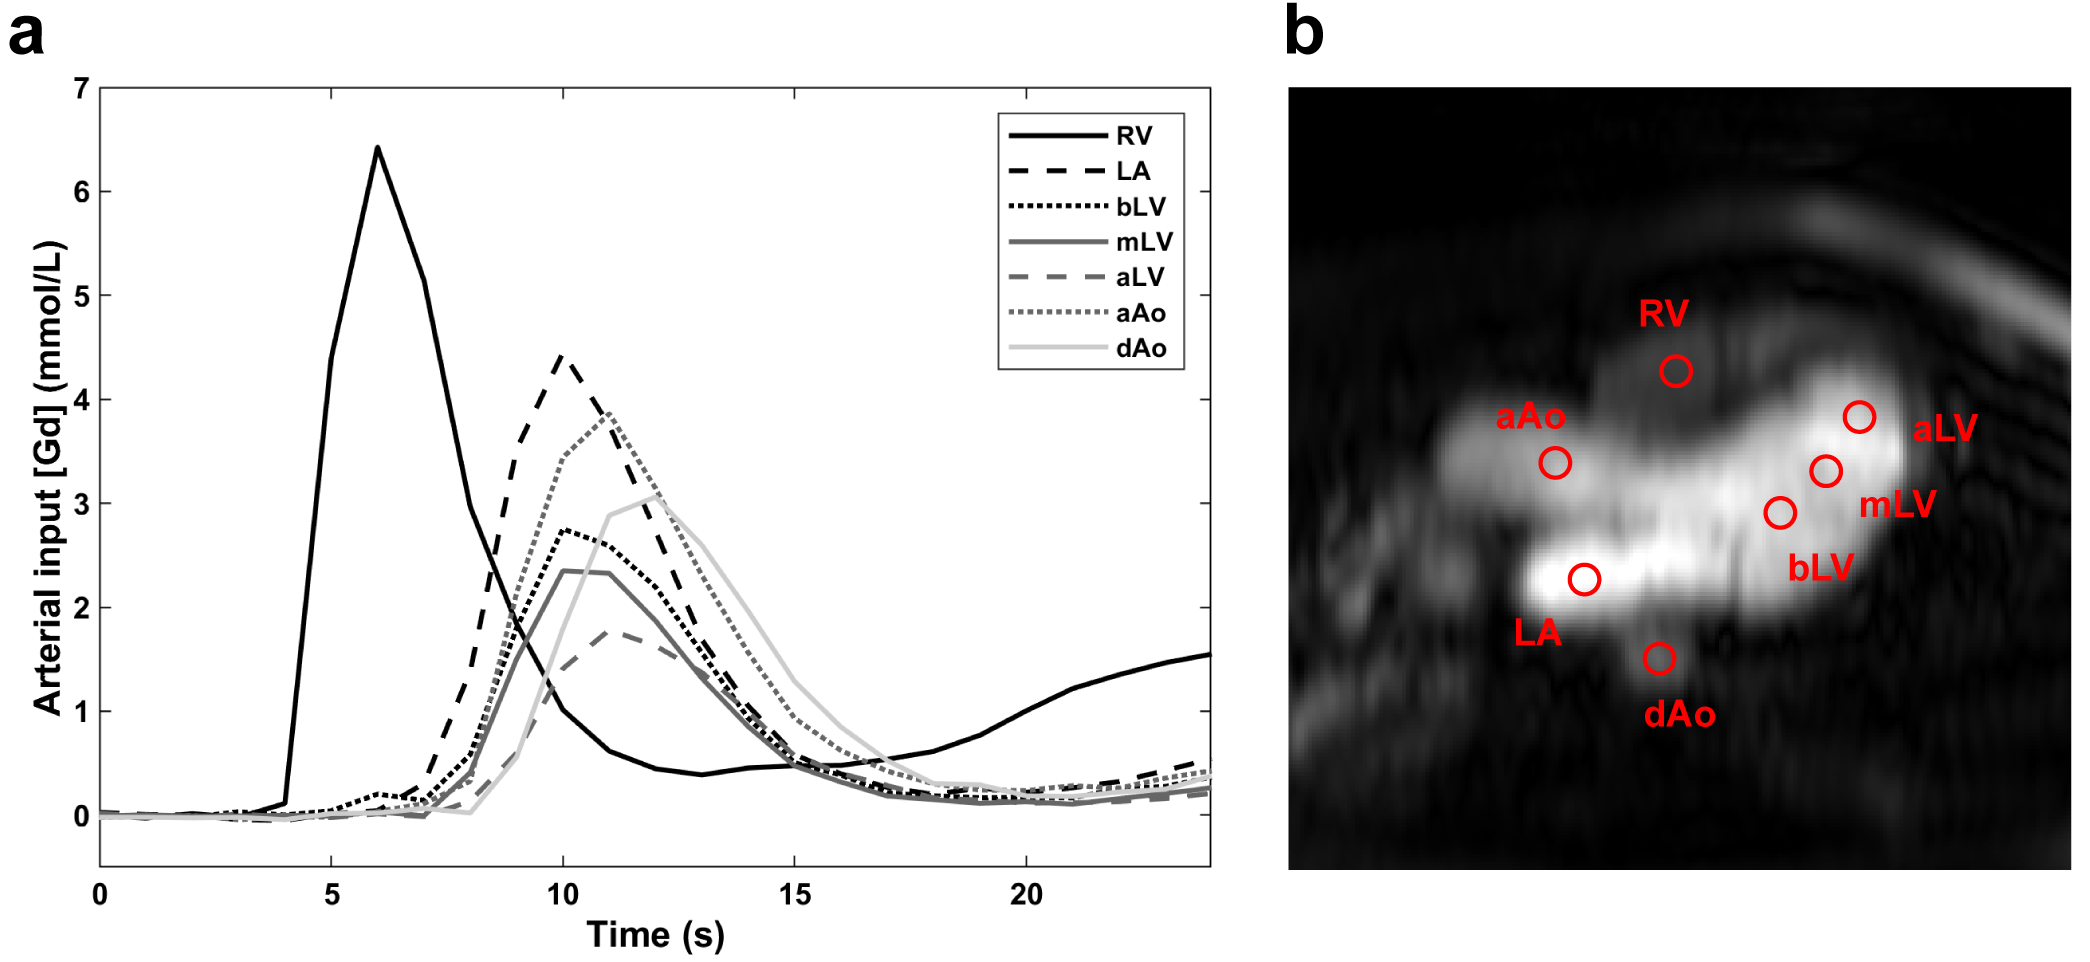
Figure 2. Arterial input functions (a) sampled in 3-chamber view (b) for
adenosine stress perfusion imaging in a normal subject. The circular regions of
interest (diameter 10 mm) were manually placed by an experienced cardiologist
and avoided the aortic valve in the ascending aorta, and the papillary muscles,
moderator band and trabeculation in the three left ventricular locations. Example
pixel-wise maps for this subject are shown in Figure 3.
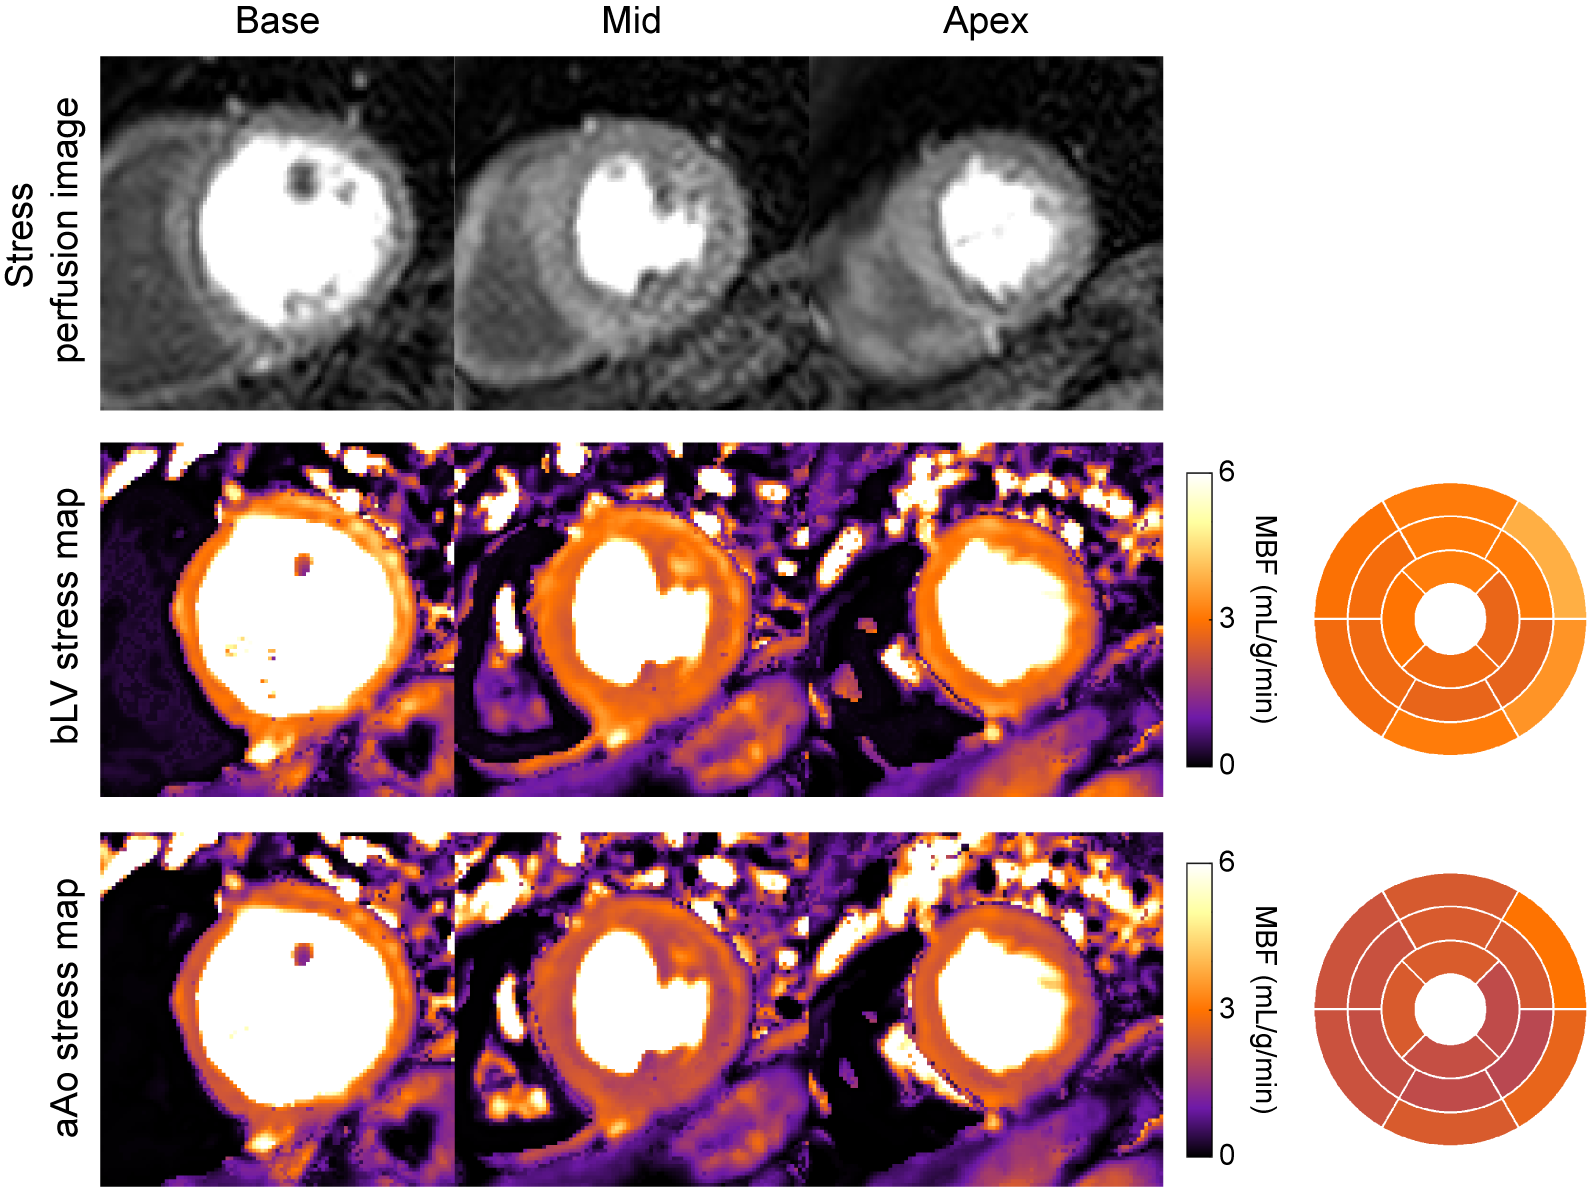
Figure 3. Example stress perfusion images (top), pixel-wise stress myocardial
blood flow (MBF) maps and 16-segment bullseye plots in a normal subject derived
using arterial input functions (AIF) from the clinical reference basal left
ventricle (bLV) and the ascending aorta (aAo). The mean stress MBF is 2.97
mL/g/min for the bLV and 2.32 mL/g/min for the aAo. Corresponding AIF
curves for this subject are shown in Figure 2.