2090
Dual-contrast and dual-phase first-pass myocardial perfusion using simultaneous multi-slice imaging1School of Biomedical Engineering and Imaging Sciences, King's College London, London, United Kingdom, 2MR Research Collaborations, Siemens Healthcare Limited, Frimley, United Kingdom, 3Cardiovascular MR predevelopment, Siemens Healthcare GmbH, Erlangen, Germany, 4MR Research Collaborations, Siemens Healthcare Limited, Melbourne, Australia
Synopsis
The clinical need of covering multiple slices in myocardial perfusion constrains the saturation delay time to be short. However, this may be suboptimal in terms of myocardial/defect tissue contrast and blood/myocardium signal ratios. Moreover, it is not possible to acquire the same slice twice, and all slices are at different cardiac phases.
In this study, we develop a perfusion sequence which provides dual phase and dual contrast data using simultaneous multi-slice at two different saturation delay times. Simulations and in-vivo data acquired in patients demonstrated a 150% increase of myocardial/defect contrast, and decreased blood/myocardium signal ratio by 60 to 80%.
Introduction
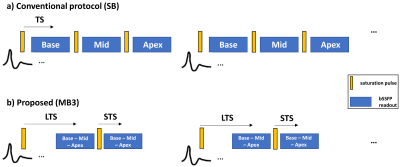
Conventional myocardial perfusion protocols employ short saturation delay times (TS; 100-120ms) for the acquisition of multiple slices covering base, mid and apex (Figure1a). However, the use of a longer TS may be beneficial to improve detection of perfusion defects by providing increased myocardial/defect (MD) contrast, and a reduced dark rim artefact due to lower blood/myocardium (BM) signal ratio. Simultaneous multi-slice1 (SMS) or multiband (MB) imaging with CAIPIRINHA encoding2 is an acceleration technique which enables simultaneous imaging of multiple slices. This technique has been successfully extended to bSSFP imaging3 using the GC-LOLA correction and a multiband factor of 24. It has also been successfully employed in cardiac perfusion to double spatial coverage5. In this study, we sought to develop a dual contrast/dual phase myocardial perfusion sequence by extending SMS-bSSFP GC-LOLA to multiband 3.Methods
Sequence descriptionThe proposed prototype sequence consists of two saturation recovery blocks acquired in each heartbeat with different saturation times (block1: long TS (LTS)=300ms; block2: short TS (STS)=130ms) (Figure1b). Three slices (base, mid, apex) are imaged using SMS-bSSFP with GC-LOLA correction and a multiband factor of 3 (see next section). T-GRAPPA acceleration (R=7)6 and phase oversampling (300%) are employed for an effective in-plane acceleration of 2.3. Images were reconstructed with an inline prototype non-linear iterative reconstruction algorithm with spatio/temporal L1 regularisation7. Note that in our framework slice separation is achieved along the phase encoding direction where the (shifted) slices are reconstructed on the oversampled field of view8.
SMS-bSSFP with MB3 GC LOLA
Three triple-band pulses with CAIPIRINHA RF phase increments of -120°, 0° and 120° for slices 1, 2 and 3 were generated as the complex summation of a native single band (SB) pulse. This achieves shifts in image space of -FOV/3, 0 and FOV/3 for slices 1, 2 and 3, which results in lower g-factor amplification at reconstruction2. However, because each band is subject to an independent phase cycling scheme, the frequency response of the bSSFP signal is also shifted. For slices 1, 2 and 3, these shifts equal to -1/3, 0 and 1/3 of the native bSSFP passband interval. The GC-LOLA framework addresses this undesirable effect by i) applying an additional slice unbalancing gradient within each TR interval to align the frequency response of each band and ii) adding an additional GC-LOLA phase cycling term to center the frequency response of the (now aligned) bands onto the water peak4.
Simulation
Numerical simulations were employed to study the relationship between TS, MD contrast and BM ratio (Figure2). The following sequence parameters were employed: flip angle α=45°, TR=2.56ms, start-up pulses=6, number of bSSFP readout pulses=70. For MD contrast (Figure2a), myocardial T1 (T1m) and T2 (T2m) times were set to 250ms and 44ms, respectively. A range of simulated myocardial defect T1/T2 times (T1d/T2d) were evaluated from 400/46ms to 1200/50ms. For the BM signal ratios (Figure2b), both peak blood (T1m/T2m=1200ms/50ms) and peak myocardium (T1m/T2m=250ms/44ms) conditions were simulated. Blood T1/T2 (T1b/T2b) simulated range was 28.5/26.5ms to 168.8/108.7ms.
In-vivo evaluation
The sequence was evaluated in 5 patients referred for contrast CMR at 1.5T (MAGNETOM Aera, Siemens Healthcare, Erlangen, Germany) using an 18-element body coil and a 32-channel spine coil. All data was acquired using the following parameters: FOV=360x360mm2, slice thickness=10mm, resolution=2.3x2.3mm2, TR=2.56ms, TE=1.09ms, flip angle α=45°, readout bandwidth=1008Hz/Px, start-up pulses=6, number of bSSFP readout pulses=70, readout duration=179ms, total acquisition time within a heartbeat=608ms. The slice gap was adjusted for each patient to cover base, mid and apical regions. Each patient underwent late gadolinium enhancement (LGE) imaging (one patient LGE positive). A contrast dose of 0.075 (4 cases)/0.150 (1 case) mmol/kg was injected. Patients performed an exhale breath-hold during first pass perfusion.
Data analysis
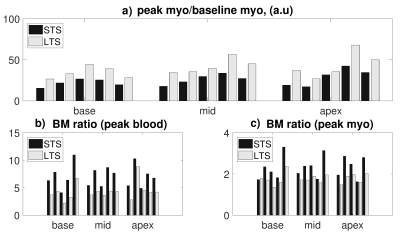
LTS and STS data were compared as follows: blood pool and left ventricular myocardium were segmented at baseline, peak blood, and peak myocardial enhancement. Contrast between peak and baseline myocardium (used as a surrogate for defect) is reported. BM ratios at peak blood and peak myocardium were calculated.
Results
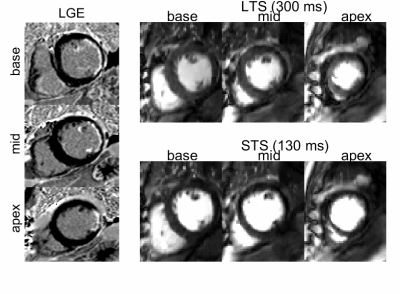
Simulations showed that MD contrast is maximized for a TS range of 300-500ms (Figure2a). Figure2b suggests that the BM ratio decreases with increasing TS. Across all patients (example in Figure3), LTS images led to higher peak vs baseline myocardium contrast (158±21%, p<0.01) as well as decreased BM ratio at peak blood (62±13%) and peak myocardium (79±12%) (Figure4a-c). In the LGE-positive patient (Figure5), myocardial/scar contrast increased by 158% at peak myocardial enhancement.Discussion
In this study, a dual contrast/phase myocardial perfusion sequence with extended spatial coverage and increased myocardial/defect contrast plus decreased blood/myocardium signal ratio was implemented. In the present framework, all slices are acquired twice at two different cardiac phases, with the potential of triggering the LTS acquisitions at systole which could ultimately facilitate the analysis of apical slices. Further studies in a larger patient population with coronary artery diseases are warranted to explore the benefits of the present technique. The robustness of the sequence to respiratory motion should also be explored.Conclusion
The proposed perfusion sequence enables dual phase imaging with two different saturation delay times, allowing a 150% increase of myocardial/defect contrast and decreased blood/myocardium signal ratio by 60 to 80% for the LTS images when compared to conventional STS images.Acknowledgements
This work was supported by the EPSRC grant (EP/R010935/1) the Wellcome EPSRC Centre for Medical Engineering at Kings College London (WT 203148/Z/16/Z) and by the National Institute for Health Research (NIHR) Biomedical Research Centre based at Guy’s and St Thomas’ NHS Foundation Trust and King’s College London. The views expressed are those of the authors and not necessarily those of the NHS, the NIHR or the Department of Health.References
[1] Larkman DJ, Hajnal JV, Herlihy AH, Coutts GA, Young IR, Ehnholm G. Use of multicoil arrays for separation of signal from multiple slices simultaneously excited. J Magn Reson Imaging. 2001;13:313 317.
[2] Breuer FA, Blaimer M, Heidemann RM, Mueller MF, Griswold MA, Jakob PM. Controlled aliasing in parallel imaging results in higher acceleration (CAIPIRINHA) for multi slice imaging. Magn Reson Med. 2005;53:684 691.
[3]. Stäb D, Ritter CO, Breuer FA, Weng AM, Hahn D, Köstler H. CAIPIRINHA accelerated SSFP imaging. Magn Reson Med.2011;65:157‐164.10.
[4] Stäb D, Speier P. Gradient-controlled local Larmor adjustment (GC-LOLA) for simultaneous multislice bSSFP imaging with improved banding behavior. Magn Reson Med. 2019 Jan;81(1):129 139.
[5] Nazir SB, Neji R, Speier P, Reid FDA, Staeb D, Schmidt M, Forman C, Razavi R, Plein S, Ismail TF, Chiribiri A, Roujol S. Simultaneous Multi Slice (SMS) SSFP first-pass myocardial perfusion MRI with iterative reconstruction at 1.5T. J Cardiovasc Magn Reson. 2018;20(84).
[6] Breuer FA, Kellman P, Griswold MA, Jakob PM. Dynamic autocalibrated parallel imaging using temporal GRAPPA (TGRAPPA). Magn Reson Med. 2005;53:981 985.
[7] Liu J, Rapin J, Chang T, Lefebvre A, Zenge M, Mueller E, Nadar MS. Dynamic cardiac MRI reconstruction with weighted redundant Haar wavelets. ISMRM. 2012; #4249.
[8] Stäb D, Speier P, Reiter T, Klink T, Neubauer H, Bley TA, Wech T, Weng AM, Kstler H. Restating MS-CAIPIRINHA as an In-plane Acceleration Problem: An Efficient Method for Integrating High Coverage Cardiac Perfusion MRI into Clinical Workflow. ISMRM. 2015; #2686.
[9] Weigel M. Extended phase graphs: Dephasing, RF pulses, and echoes - Pure and simple. J. Magn. Reson. Imaging 2015;41(2):266 295.
Figures


