2089
Flow Effects on MOLLI T1 Mapping1Department of Radiological Sciences, David Geffen School of Medicine, University of California, Los Angeles, Los Angeles, CA, United States, 2Physics and Biology in Medicine Inter-Departmental Graduate Program, University of California, Los Angeles, Los Angeles, CA, United States, 3Division of Cardiology, Department of Medicine, David Geffen School of Medicine, University of California, Los Angeles, Los Angeles, CA, United States
Synopsis
T1 relaxation time for myocardial tissue represents a biomarker for a variety of pathologies. High resolution and pixel-wise T1 mapping can be acquired with Modified Look-Locker Imaging1 (MOLLI). Besides, T1 measurements of blood can be used as a reference value to calculate function parameters like extracellular volume (ECV) fraction2,3 and myocardial blood volume4.5 (MBV). Blood flow may affect blood T1 measurements and cause further deviation in calculating function parameters 6. In our work, we proposed a MOLLI-based flow model to simulate flow effect. Substantial T1 deviation may happen when the spin replacement rate is between 0.65 and 0.70.
Introduction
T1 mapping techniques, such as Modified Look-Locker Imaging (MOLLI), are valuable tools for myocardial tissue characterization. T1 values of the myocardium and the blood are used for calculating the extracellular volume (ECV). However, it is unknown how much impact blood flow has on T1 mapping accuracy for the blood. Due to the blood flow, especially through-plane blood flow, the apparent measured T1 may deviate from the true T1 due to inflow effects and partial saturation effects. We sought to investigate the blood effects on MOLLI T1 mapping.Methods
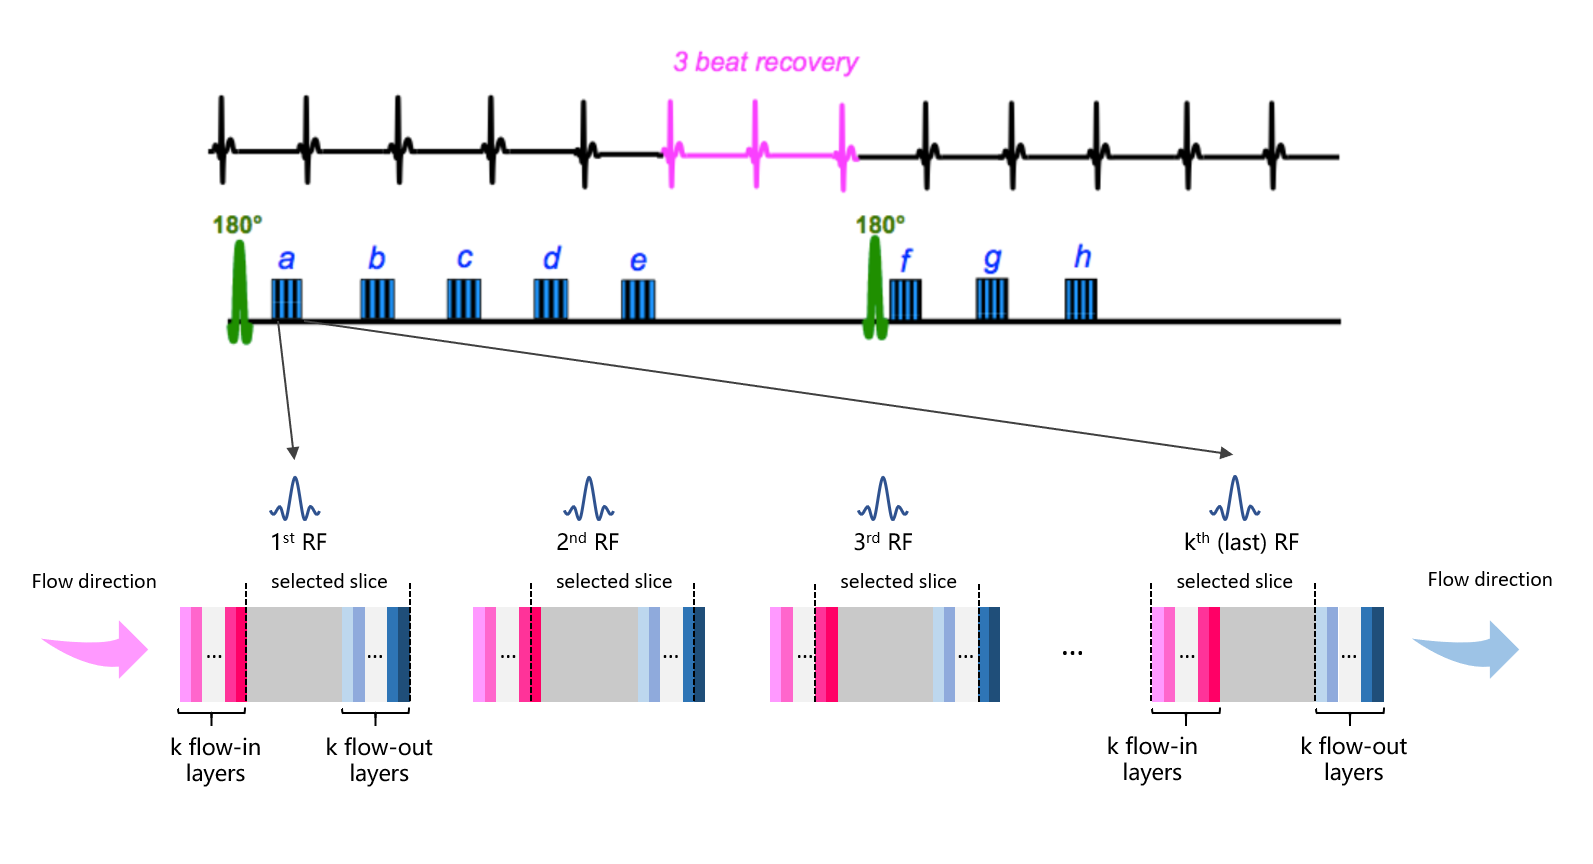
We built a Bloch simulation model to simulate the MR signal that would be acquired using MOLLI as the blood flow through a typical 2D imaging slice under various flow rates, as shown in Figure 1.We assume k RF pulses are played during the single-shot acquisition within a heartbeat. During the acquisition, certain spins will flow into the selected slice and certain spins will flow out. They will experience a different number of RF pulses, resulting in different apparent signal intensities compared to static spins. Based on the total number of RF pulses the spins experience, we group them into k in-flowing layers and k out-flowing layers. Specifically, the jth in-flowing layer flows into the excitation slice after the first jth RF pulses. These spins have no contribution to the MRI signal before the jth RF pulse. The jth out-flowing layer will experience the first jth RF pulses, and will subsequently flow out of the excitation slice; however, its signal will still be captured by the receiver coil. Using Bloch simulation, we calculated the signal evolution of every layer of spins. The complex sum of all the spins was calculated as the total MRI signal. Based on this total MRI signal, the Final T1 values were calculated using a three-parameter exponential fitting commonly used in MOLLI.
In our simulation, the following sequence parameters were used: TR/TE = 2.7/1.1 ms, flip angle = 35 degree, slice thickness = 6/7/8 mm, reference T1 = 2000ms and T2 = 200ms. Flow rate ranged from 10cm/s to 160 cm/s.
Results and Discussion
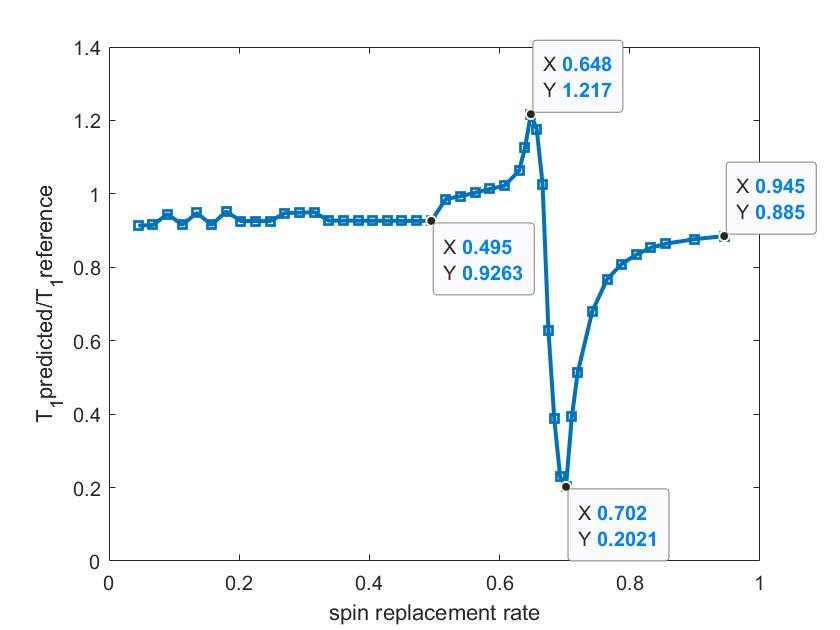
In this problem, the spins replacement rate, defined as the percentage of the spins in the intended 2D slice that is replaced by in-flowing spins within a single TR, i.e. (spin replacement rate = $$$\frac{v*TR}{slice\,thickness}$$$, is the central parameter that independently determines the MOLLI signal behavior. Figure 2 shows our simulated T1 measurement, normalized to the T1 reference, as a function of the spin replacement rate.Based on our model, when spin replacement rate is less than 0.5, the apparent T1 is within 10% deviation from the ground truth. However, when the spin replacement rate falls within the range of 0.50 to 0.65, the T1 ratio increases from 0.93 to 1.22. Then its ratio drops substantially to the lowest point of 0.20 when the spin replacement rate= 0.70. When the spin replacement rate increases further, the T1 ratio recovers back to approximately 0.9.
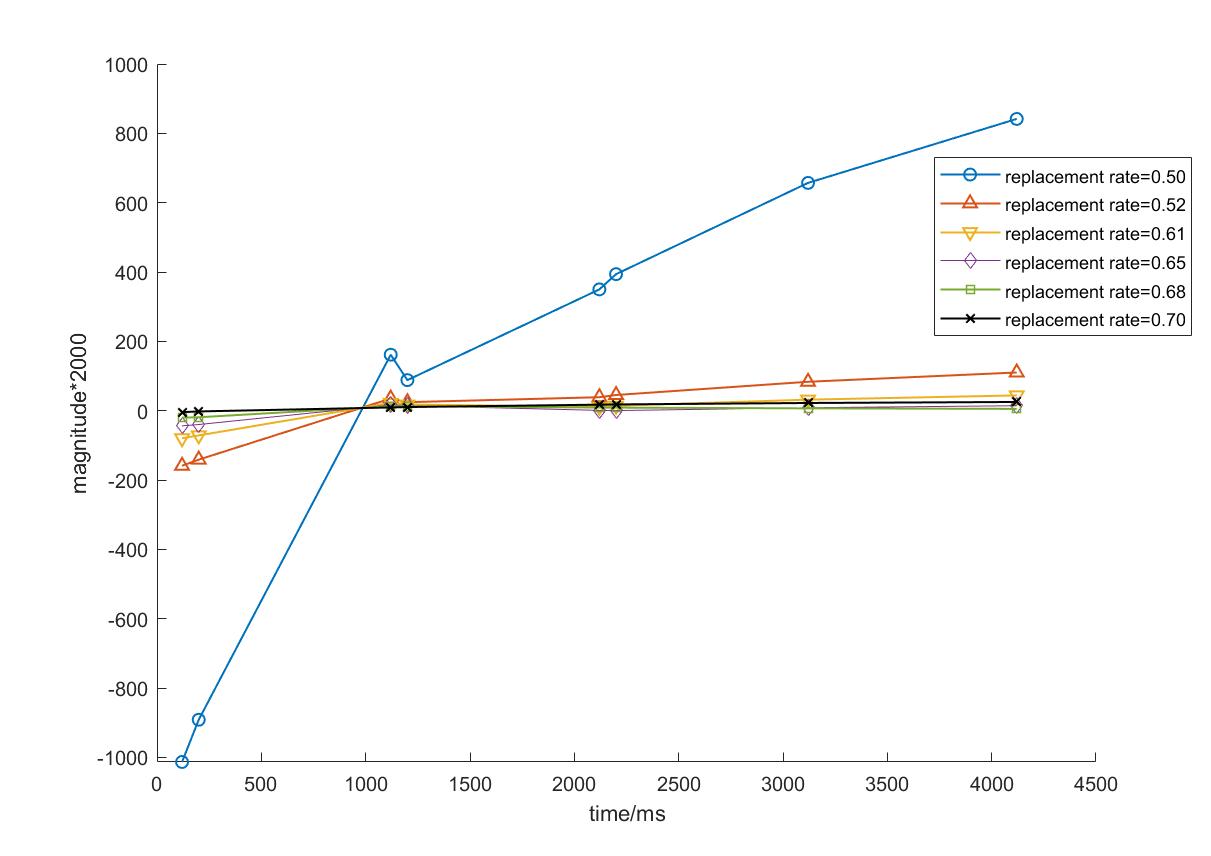
When the spin replacement rate ranges from 0.50 to 0.70, the shapes of the MOLLI image signal intensity curve become abnormal as shown in Figure 3. They become flattened, resulting in erroneous and much reduced apparent T1 values.
Conclusions
We investigated the effects of through-plane blood flow on the T1 measurement accuracy of MOLLI cardiac T1 mapping using detailed Bloch simulation. Substantial deviation of T1 value is expected when the spin replacement rate falls between 0.50 to 0.70. This range of spin replacement rate is possible in clinical scanning. The implications of this effect on in-vivo MOLLI scanning remains to be investigated.Acknowledgements
No acknowledgement found.References
1. Messroghli, Daniel R., et al. "Modified Look‐Locker inversion recovery (MOLLI) for high‐resolution T1 mapping of the heart." Magnetic Resonance in Medicine: An Official Journal of the International Society for Magnetic Resonance in Medicine 52.1 (2004): 141-146.
2. Riesenkampff, Eugénie, et al. "Myocardial T1 mapping in pediatric and congenital heart disease." Circulation: Cardiovascular Imaging 8.2 (2015): e002504.
3. Haaf, Philip, et al. "Cardiac T1 mapping and extracellular volume (ECV) in clinical practice: a comprehensive review." Journal of Cardiovascular Magnetic Resonance 18.1 (2017): 89.
4. McCommis, Kyle S., et al. "Myocardial blood volume is associated with myocardial oxygen consumption: an experimental study with cardiac magnetic resonance in a canine model." JACC: Cardiovascular Imaging 2.11 (2009): 1313-1320.
5. Liu, Alexander, et al. "Adenosine stress and rest T1 mapping can differentiate between ischemic, infarcted, remote, and normal myocardium without the need for gadolinium contrast agents." JACC: Cardiovascular Imaging 9.1 (2016): 27-36.
6. Kellman, Peter, and Michael S. Hansen. "T1-mapping in the heart: accuracy and precision." Journal of cardiovascular magnetic resonance 16.1 (2014): 2.
Figures