2087
Radiomics Analysis for the Differential Diagnosis of Cardiac Hypertrophy with MR T1-mapping1Department of Radiology, Tongji Hospital, Tongji Medical College, Huazhong University of Science and Technology, Wuhan, China, 2Huiying Medical Technology Co., Ltd, Beijing, China
Synopsis
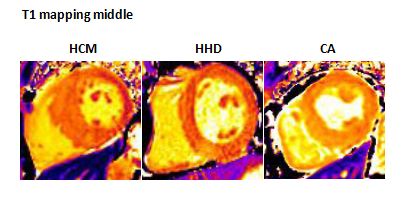
In clinical setting, there are three distinguishable entities presented mainly with left ventricular cardiac hypertrophy, including HCM, HHP and CA. Imaging differential diagnosis relies on LGE-CMR, and recently proposed native T1 mapping, which has high diagnostic accuracy and is potentially more sensitive for detecting disease than LGE imaging. However, both modalities are insufficient robustness for the differential diagnosis of three diseases. In this study, radiomics analysis was adopted into the differential diagnosis of cardiac hypertrophy with MR T1-mapping. And diagnostic accuracy of 0.95/0.96 can be achieved with test dataset, which is significantly improved as compared with conventional native T1 mapping.
Purpose
To investigate the diagnostic potential of radiomics analysis applied to T1 mapping obtained with cardiac MRI for the diagnosis of cardiac hypertrophy.Method
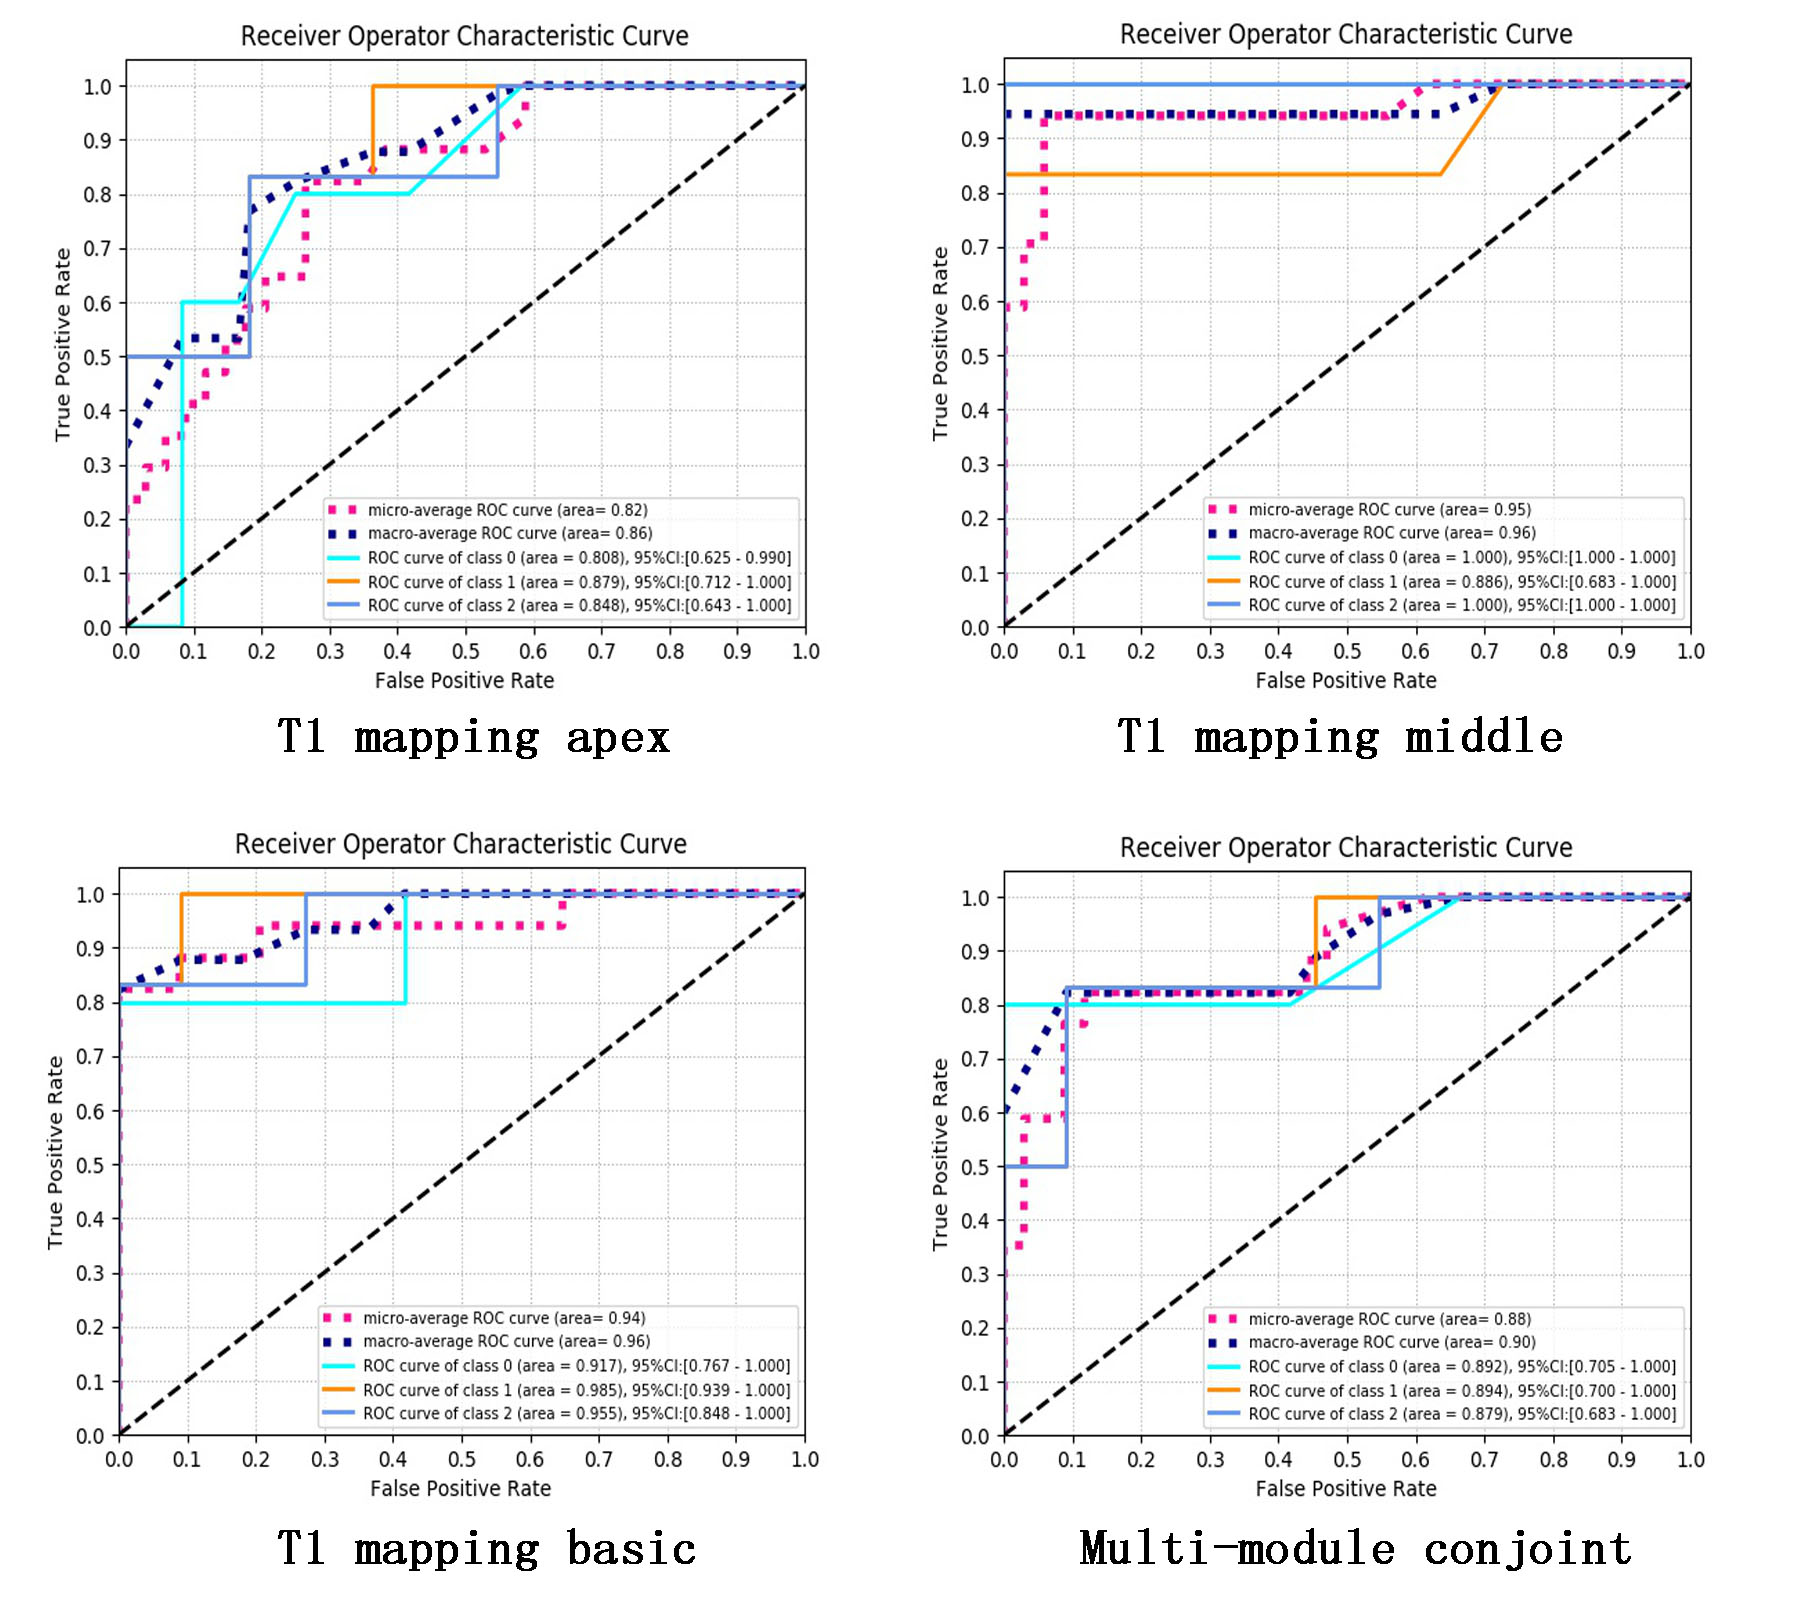
77 patients including cardiac amyloidosis (CA, N = 27), hypertrophic cardiomyopathy (HCM, N = 28) and hypertensive heart disease (HHD, N = 22) were enrolled. All subjects underwent 3.0 T CMR examination, mainly including native T1 mapping (basal, mid-ventricular and apical sections). Radiomics analysis were applied in T1 mapping. Segmented ROIs of the left ventricular myocardium were manually delineated on native T1 mapping images, using ITK-SNAP software. Due to inconsistent pixel spacing between participants, the image and contours were subsequently isotropically resampled. Then the set of radiomics features used in this study contained 1033 two-dimensional descriptors automatically extracted from each ROI. And dataset was divided into 80% and 20% with random seed, with 80% assigned to training set (21 CA, 22 HCM, 17 HHD), and 20% to the validation set. To reduce features redundancy and dimensionality, Select K Best and the Least Absolute Shrinkage and Selection Operator (LASSO) algorithm methods were applied to select the most useful predictive features from the radiomics features set in Radcloud platform (Huiying Medical Technology Co., Ltd). Relevant features were selected based on the best α and the coefficients were calculated for each feature. The predictive performance of the model was assessed in the validation dataset with the same thresholds as in the training dataset. Random Forest (RF) model was applied to establish a radiomics-based diagnostic model for each T1 mapping images (T1 mapping basic, T1 mapping middle, T1 mapping apex), as well as multi-module conjoint, based on corresponding set of radiomics features to predict the cause of heart disease. And then calculated predictive evaluation of classification models.Results and Discussion
The maximum diagnostic accuracy of test dataset in the study is 0.95/0.96 (F1-Score_micro 0.88, and F1-Score_macro 0.88) by using middle T1 mapping. This result is similar to previous studies, and significantly improve diagnosis accuracy of T1 mapping. The maximum diagnostic accuracy is 0.82/0.86 (F1-Score_micro 0.71, and F1-Score_macro 0.70) by using apex T1 mapping. The results may because i) there be no significant segment-to-segment differences were found in mid-ventricular, comparing to apical and basal, so the T1 value in mid-ventricular is more reliable; ii) there be significant segment-to-segment differences were found in apical, so the T1 value in apical is more unreliable; iii) Basal slice and apical slice are susceptible to respiratory movement and diaphragmatic movement, respectively, there may be some artifact. However, the result of multi-module conjoint analysis is not inferior to that of single-module analysis, the underlying reason may be that the sample size is smaller for a large amount of data.Conclusion
Radiomic analysis based on native T1 mapping can accurately distinguish among hypertrophic cardiomyopathy, hypertensive heart disease and cardiomyopathy amyloid, and maybe is an useful alternative imaging modality for the differential diagnosis of cardiac hypertrophy.Acknowledgements
No acknowledgement found.References
Hinojar R, Varma N, Child N, et al. T1 mapping in discrimination of hypertrophic phenotypes: hypertensive heart disease and hypertrophic cardiomyopathy: findings from the International T1 Multicenter Cardiovascular Magnetic ResonanceStudy. Circ Cardiovasc Imaging 2015;8:e003285
Ulf Neisius, Hossam El-Rewaidy, Shiro Nakamori, et al. Radiomic Analysis of Myocardial Native T1 Imaging Discriminates Between Hypertensive Heart Disease and Hypertrophic Cardiomyopathy. JACC Cardiovasc Imaging. 2019 Jan 16
Andrea Baggiano, Michele Boldrini, Ana Martinea-Naharro et al. Noncontrast Magnetic Resonance for the Diagnosis of Cardiac Amyloidosis. JACC Cardiovasc Imaging 2019 Jun 7
Baessler B, Luecke C, Lurz J et al. Cardiac MRI Texture Analysis of T1 and T2 Maps in Patients with Infarctlike Acute Myocarditis.Radiology. 2018 Nov;289(2):357-365
Figures
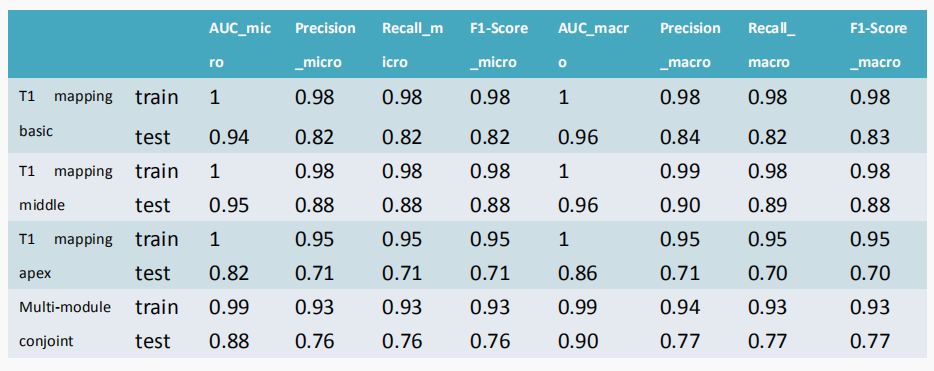
Relative parameters of classification models prediction evaluation.