2086
Evaluation of Inhomogeneous Magnetization Transfer ihMT at 9.4T for the visualization of the Purkinje Network in the heart
Kylian Haliot1,2,3, Andreea Hertanu4, Olivier Girard4, Lucas Soustelle4, Guillaume Duhamel4, Julie Magat1,2,3, and Bruno Quesson1,2,3
1IHU Liryc, Fondation Bordeaux Université, Pessac, France, 2U1045 CRCTB, Université de Bordeaux, Bordeaux, France, 3INSERM, CRCTB, U1045, Bordeaux, France, 4Aix-Marseille Univ, CNRS, CRMBM, Marseille, France
1IHU Liryc, Fondation Bordeaux Université, Pessac, France, 2U1045 CRCTB, Université de Bordeaux, Bordeaux, France, 3INSERM, CRCTB, U1045, Bordeaux, France, 4Aix-Marseille Univ, CNRS, CRMBM, Marseille, France
Synopsis
The Purkinje network (PN) of the heart plays a major role in cardiac electrical diseases such as in sudden cardiac death. Imaging of this fine network is of central interest to better characterize the links between electrical disorders and structural modifications of the heart. PN is composed of fibers containing cardiomyocytes surrounded by a collagen sheath (PF). In this study, we implemented inhomogeneous magnetization transfer (ihMT) sequence at 9.4T and evaluate this technique on ex vivo samples of pig heart fixed into formalin. We show that ihMT is a suitable candidate to increase the contrast between PF and cardiac muscle.
Introduction
The Purkinje conduction network (composed of Purkinje Fibers (PF)) plays a crucial role in normal cardiac function but it has also been implicated in arrhythmogenesis and sudden cardiac death1. PF have the particularity of being composed of cardiomyocytes surrounded by a collagen sheath2,3. Thus, magnetization transfer (MT) techniques are good candidates to increase contrast between cardiac tissue and PF4. Beside conventional MT, inhomogeneous MT (ihMT) was developed to explore a different source of contrasts related to dipolar relaxation times T1D of tissues. Recently Varma et al.5 demonstrated successful applications of ihMT on ex vivo tissues with short T1D (1 ms) components outside the brain, such as in the rat heart. Here, we hypothesize that ihMT can provide images with improved contrast between cardiac muscle and PF based on their different T1D values. Thus, a rapid sequence incorporating ihMT module was implemented at 9.4T and evaluated on an ex vivo cardiac sample from pig.Materials & Methods
SampleA pig’s heart (~40 kg) was surgically collected after a sternal thoracotomy followed by pentobarbital euthanasia in accordance with institutional animal care. The heart was rapidly rinsed with saline solution. A sample (3.5×4×5.5 cm3) was selected and then cut in the longitudinal direction of the heart in the right ventricle including the moderator band (Fig.1), which is a well-known conductive fiber. The sample was fixed and agitated in formalin at 10% for 48 hours. Prior to MRI acquisitions, the sample was removed from formalin and immersed into a perfluoropolyether (3M™ Fluorinert™ FC-770) with a temperature probe (SA Instruments, Stony Brook, NY) positioned in contact with the sample. Hot water was circulated in a tubing system to warm the sample and maintain its temperature at 37°C during MRI acquisition.
Acquisition
MRI acquisitions were performed at 9.4T/30 cm (Bruker BioSpin MRI, Ettlingen Germany) using a Tx/Rx volume antenna (87mm inner diameter). Images were acquired with an in-plane resolution of (250 μm)2 and a slice thickness of 2 mm. 2D ihMT-RARE sensitivity-boosted7 sequences were implemented (Fig.2) with TR/TE/flip angle/RARE factor/Matrix= 56 ms/6 ms/90°/56/160×100. Frequency alternated pulses (ALT) and four configurations of frequency offsets Δf (7/10/14/20 kHz) from the water peak were tested. For each frequency configuration, the M0 image was accumulated 4 times and each of the MT+, MT+-, MT- and MT-+ images were produced after 60 accumulations. IhMT images with two different T1D filtering strengths8 obtained by tuning the repetition time of saturation pulses to 1.1-ms and 3-ms were evaluated. The saturation period (total duration t=1600 ms) was composed of 12 bursts of Np=12 pulses repeated every BTR=130ms, and deposited a root-mean squared saturation power B1rms=9 μT.
Post-processing
The ihMT datasets were composed of 5 different images: M0 image (without any MT preparation), MT+ image (with a MT preparation pulse at +Δf), MT- image at -Δf and MT+- and MT-+ with dual-frequency MT preparations. The images were post-processed with a homemade program using Matlab (MATLAB 9.5, The Mathworks, Inc). A binary mask was computed based on M0 image to remove background. The ihMT ratio maps were calculated as $$$\small ihMTR = \left[\left(MT^{+}+MT^{-}\right)-\left(MT^{+-}+MT^{-+}\right)\right]/M_{0}\times100$$$ and conventional MT ratio maps were derived from the same dataset as $$$\small MTR=\left(1-MT^{+}/M_{0}\right)\times100$$$ . Two regions of interest were selected in the cardiac muscle (ROImu) and in the moderator band (ROIfib) on both ihMTR and MTR maps to plot the respective ratio as a function of the frequency offset. Finally, the relative contrast RC defined as $$$\small ROI_{fib}/ROI_{mu}$$$ was calculated.
Results
Cardiac sample exhibits different ihMTR contrast for different frequencies (see ihMTR maps on Fig.3A). The ihMTR graph for fiber and muscle (Fig.3A) shows a maximum signal for frequencies above 15 kHz. With relatively weak filtering of the short T1D signal (Fig.3B black curve), the ihMTR is 8% for fiber and 11.8% for the tissue with a maximized RC of 0.68. For stronger T1D filtering (Fig.3B red curve), ihMTR is 3.5% for fiber and 4.5% for the tissue and the RC is 0.78. The MTR graph (Fig.3C) shows an extremum for frequencies below 7 kHz. The MT relative contrast between the tissue and the fiber diminishes to 0.85 with increasing frequency offset at 20 kHz for the 1.1-ms filtering and 0.95 for the 3-ms filtering. For frequencies above 15 kHz, we observe an ihMT relative contrast between the collagen of the PF and the myocardium up to 40% higher compared to the MT relative contrast.Conclusion
IhMT technique was successfully implemented and tested at 9.4T on heart samples from pig containing conductive fibers. The observed contrast demonstrates that cardiac muscle and PF have different T1D. Our results show that ihMT provides better contrast between PF and myocardium than conventional MTAcknowledgements
This work received financial support from the French National Investments for the Future Programs: ANR-10-IAHU-04 (IHU Liryc) and from the Nouvelle-Aquitaine council.References
[1] Samanta R, Pouliopoulos J et al. Heart Rhythm 2016;13(1). [2] Eliska O, Cas Lek Cesk, 2006;145(4). [3] Morita T, Shimada T et al. Arch Histol Cytol, 1991;54(5). [4] Magat J, Fouillet A et al. ISMRM 2016 [5] Varma G, De Souza PC et al. ISMRM 2018 [6] Varma G, Duhamel G, de Bazelaire C et al. Magn Reson Med. 2015;73(2). [7] Mchinda S, Varma G, Prevost VH et al. Magn Reson Med. 2018;79(5). [8] Prevost VH, Girard O et al. NMR Biomed. 2017;30(6).Figures
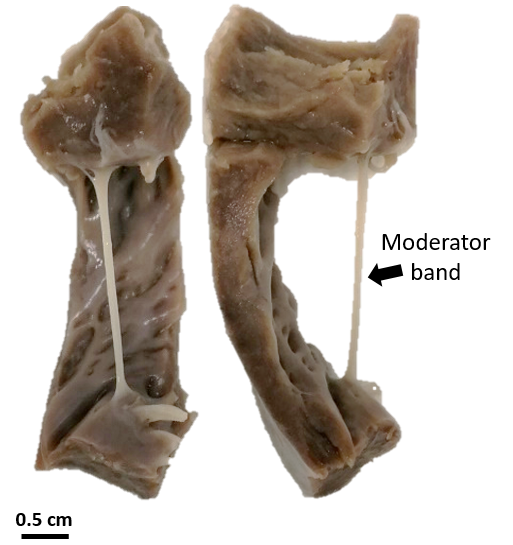
Figure 1 - Photograph
on the right ventricle sample including the moderator band (black arrow).
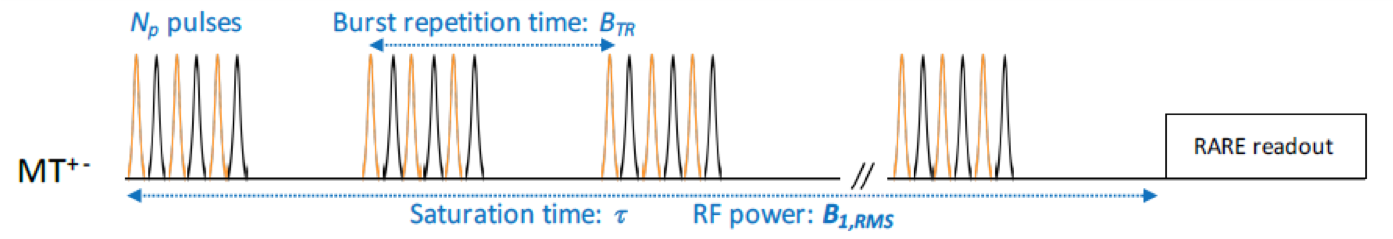
Figure 2 - Chronogram
of the ihMT-RARE sensitivity-boosted sequence with dual-frequency alternated
pulses.
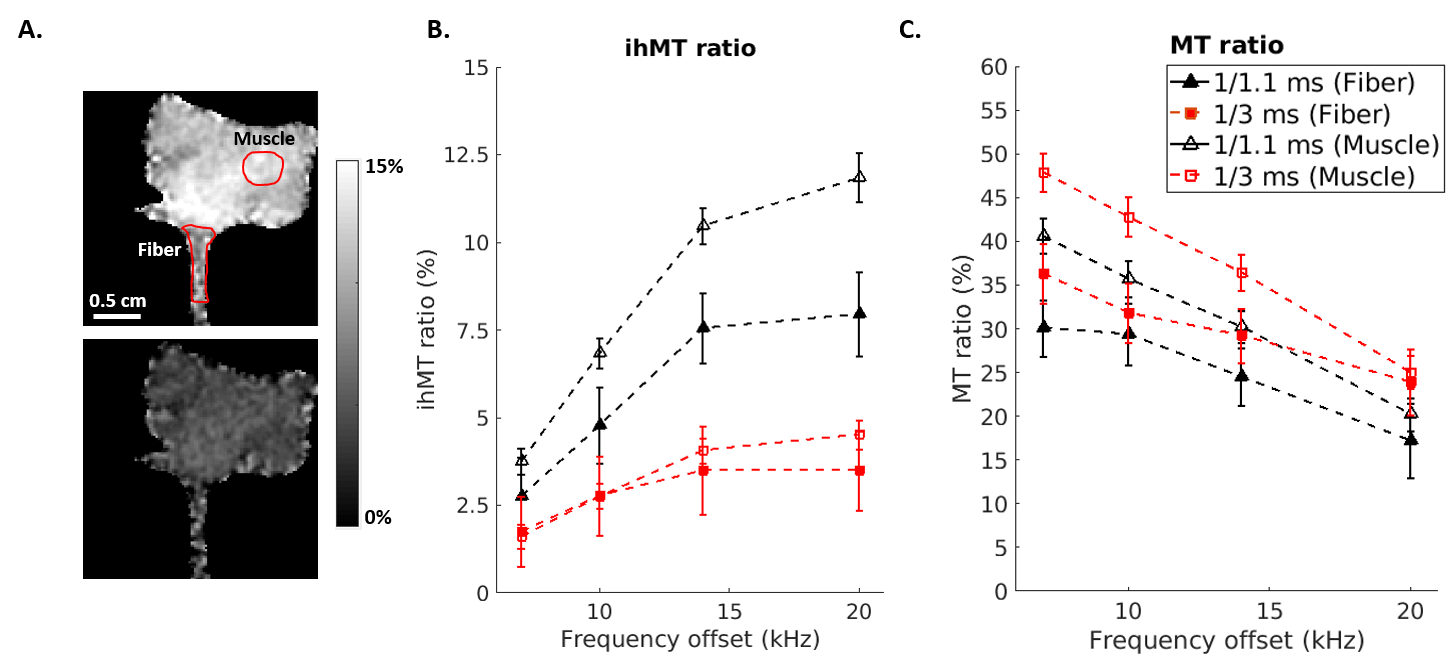
Figure 3 - Influence of frequency
offset and T1D filtering on ihMTR and MTR. ihMTR maps at 1/1.1 ms
(top) and 1/3 ms (bottom) with a 20 kHz offset are shown (A). Experimental
values measured in cardiac muscle and fiber (A) regions for ihMTR (B) and MTR
(C) are displayed.