2085
Detection of myocardial change in primary aldosteronism and essential hypertension with T1 mapping1Department of Radiology, West China Hospital, Chengdu, China, 2Department of Endocrinology and Metabolism, Adrenal Center, West China Hospital, Chengdu, China, 3MR Collaboration, Siemens Healthineers Ltd, Shanghai, China, 4Department of Cardiology, West China Hospital, Chengdu, China
Synopsis
Primary aldosteronism (PA) increases cardiovascular morbidity. In order to elucidate the early features of heart damage of PA, we used the cardiac MRI and T1 mapping technique to evaluate and compare cardiac function and myocardium changes in PA and essential hypertension (EH) patients. Our results found that the PA patients had higher native T1 than the EH group, while other functional parameters had no significant differences between two groups. The change of myocardium was earlier in PA patients than in EH patients, suggesting that it is mainly due to myocardial fibrosis induced by inappropriate secretion of aldosterone.
Introduction
Primary aldosteronism (PA) is associated with cardiovascular disease and has increased cardiovascular morbidity. Several studies had demonstrated that PA shows more serious myocardial fibrosis compared with essential hypertension (EH) using late Gadolinium-enhanced (LGE) imaging in cardiac MRI[1, 2]. However, the early myocardial change may not be detected by LGE. Recently, cardiac MRI T1 mapping emerged to be a sensitive technique in detecting early changes of myocardium quantitatively. Our study aimed to demonstrate the early myocardial change in PA patients by applying the T1-mapping technique.Method
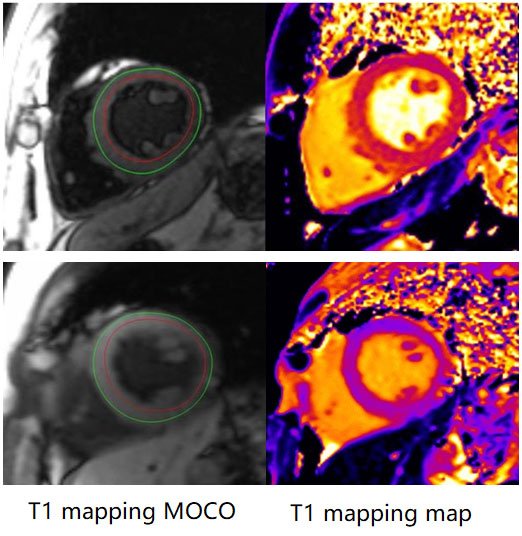
81 (male: 25; age: 48±12 yrs) PA[3] patients and 44 (male: 21; age: 47±14 yrs) EH patients diagnosed by the Department of Endocrinology and metabolism according to the 2016 TES guidelines for PA were recruited from September 2018 to May 2019. All the subjects underwent cardiac MRI examinations on a 3T MRI scanner (MAGNETOM Trio a Tim System, Siemens Healthcare, Erlangen, Germany), including steady-state free-precession (SSFP) cine imaging and modified Look–Locker inversion recovery (MOLLI) imaging for T1 mapping. Left ventricular functional parameters (left ventricular end-diastolic volume index (LVEDVI); left ventricular end-systolic volume index (LVESVI); left ventricular ejection fraction (LVEF); left ventricular mass index (LVmassi)) were obtained from cine images by the Argus software (Siemens Healthcare, Erlangen, Germany). As shown in Figure 1, the mid-ventricular native T1 value was acquired using the QMass software (Medis, Leiden, The Netherlands). Native T1 value and cardiac function parameters were analyzed between the two groups. Continuous variables were described as mean±SD or medium and quartiles. Differences of continuous variables were analyzed by Student’s t-test or Mann–Whitney U-test, and the relationships between native T1 value and physiological variables were analyzed by multiple linear regression method.Results
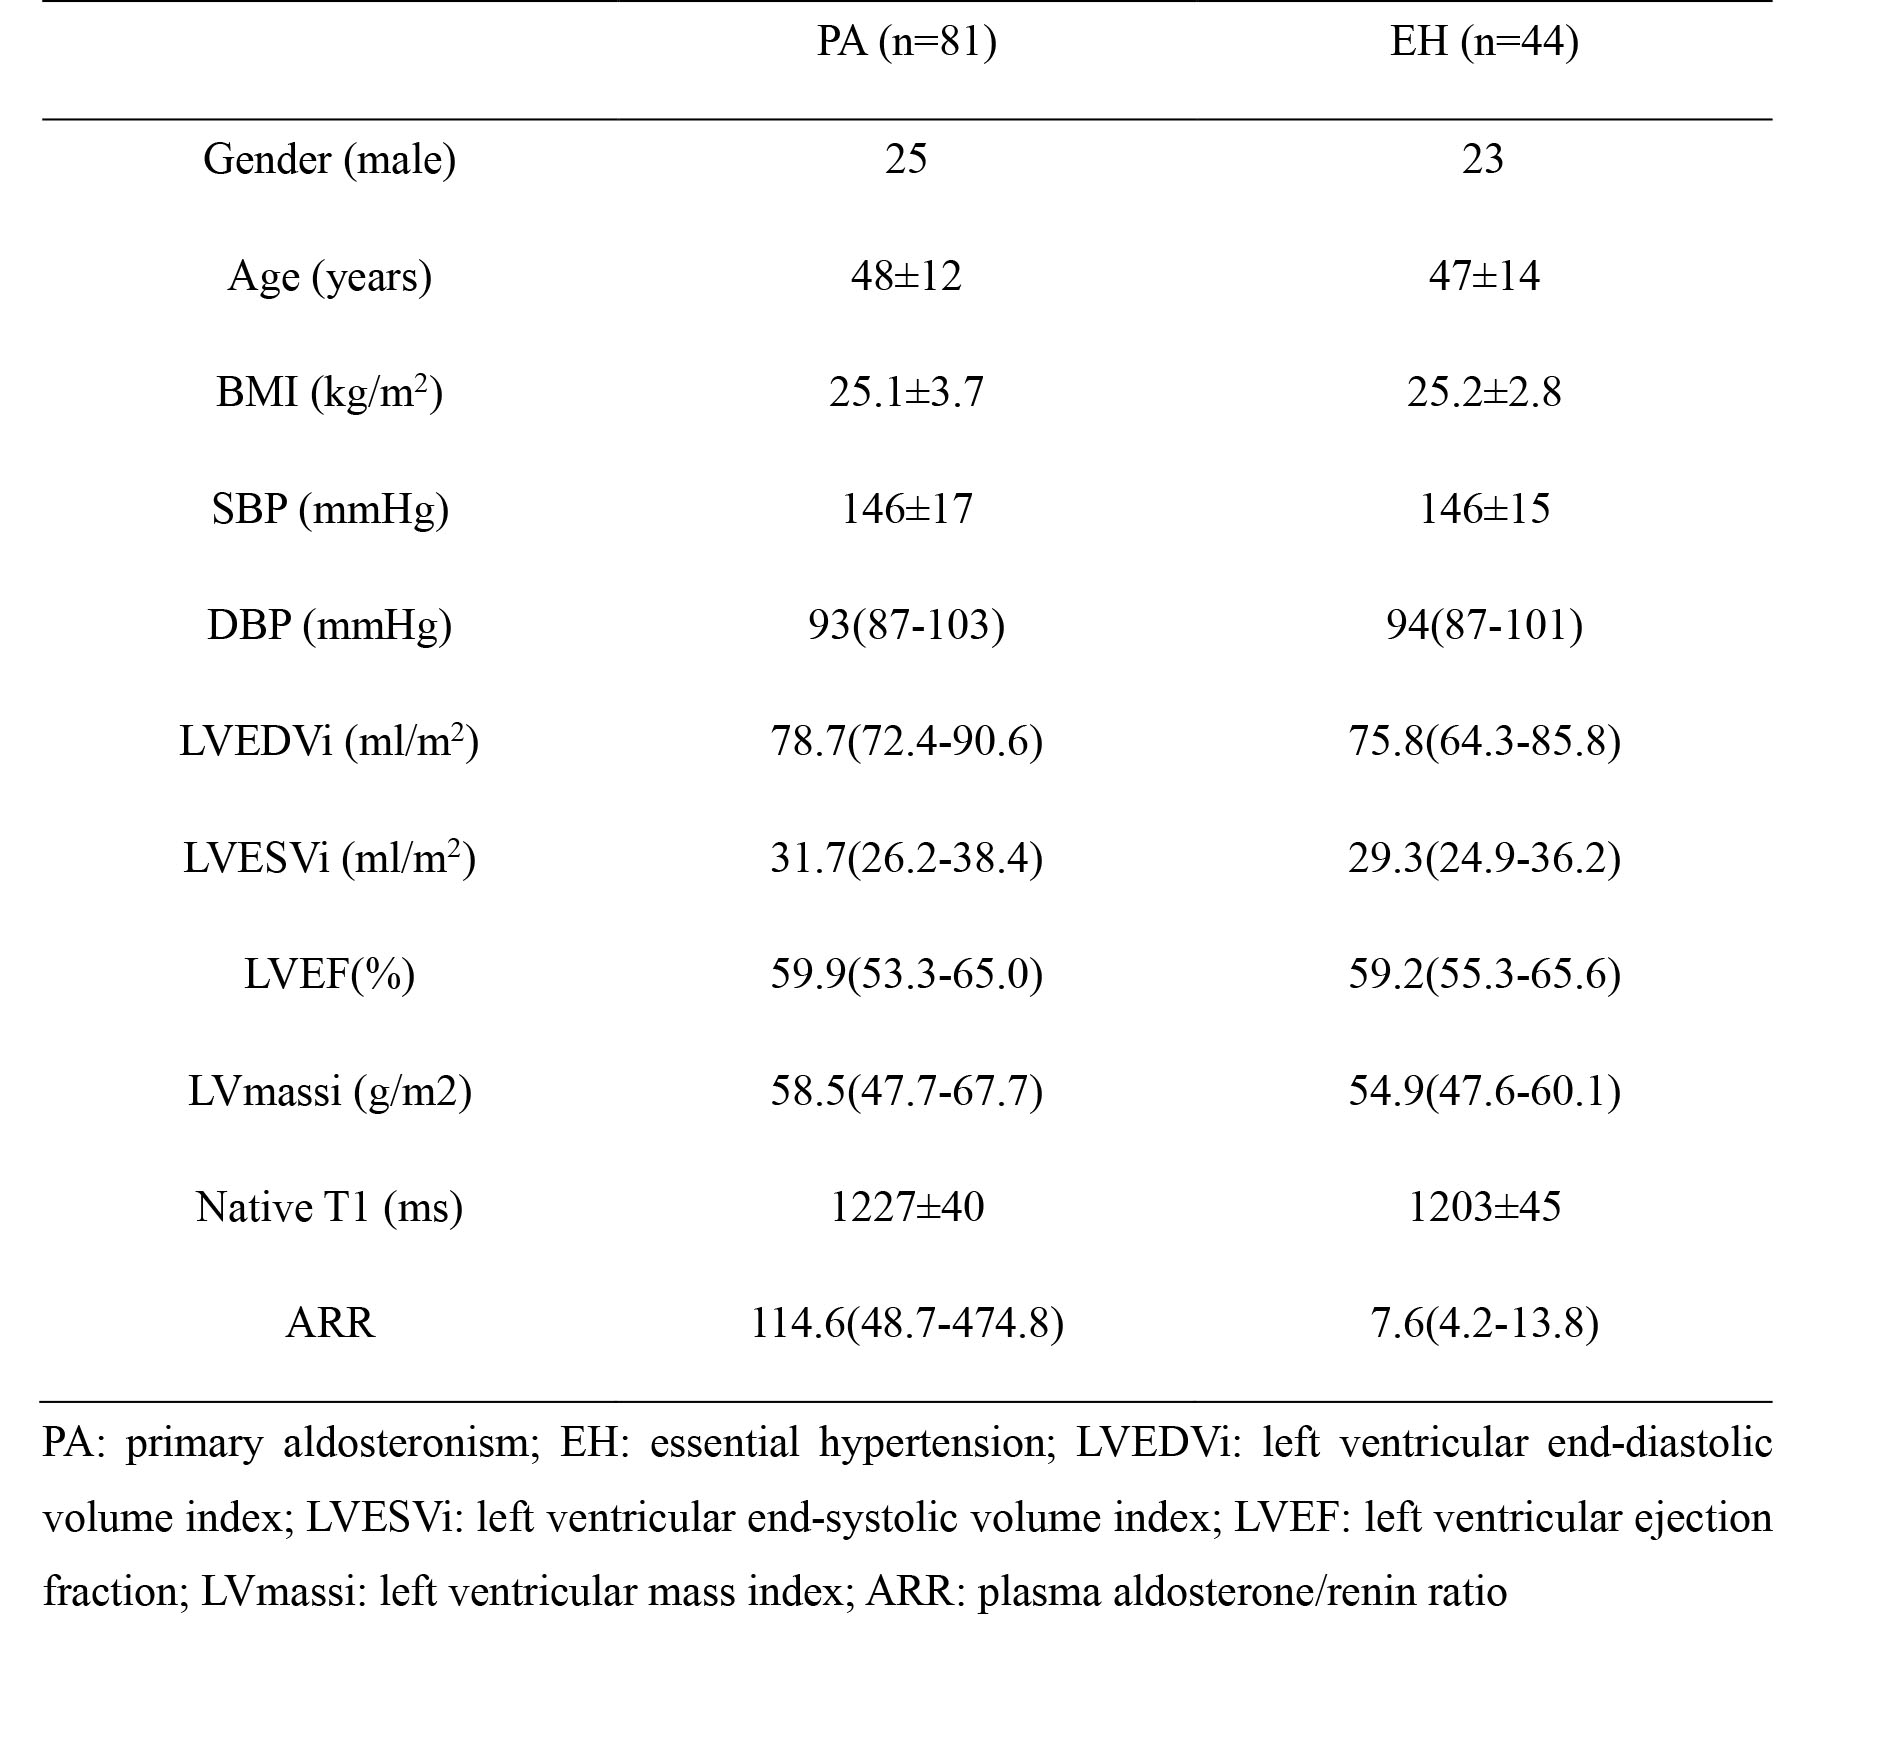
As Table 1 shows, the age (PA: 48±12 years vs EH: 47±14 years; p=0.720) and BMI (PA: 25.06±3.73 vs EH: 25.17±2.83; P=0.874) between the two groups had no significant differences. The PA group had a significant higher plasma aldosterone/renin ratio (ARR) than those in the EH group (114.6 (48.7-474.8)ng/dl:ng/ml.h vs 7.6 (4.2-13.8)ng/dl:ng/ml.h; p<0.001). All functional parameters including LVEDVI (PA: 78.7 (72.4-90.6)ml/m2 vs EH: 75.8 (64.3-85.8)ml/m2; p=0.054); LVESVI (PA: 31.7 (26.2-38.4)ml/m2 vs EH: 29.3 (24.9-36.2)ml/m2; p=0.152); LVEF (PA: 59.9 (53.3-65.0)% VS EH: 59.2(55.3-65.6)%; p=0.679); LVmassi (PA: 58.5(47.7-67.7)g/m2 vs EH: 54.9 (47.6-60.1)g/m2; p=0.463) had no difference between the two groups. However, native T1 value was higher in PA group than in EH group (1227±40 ms vs 1203±45 ms). The multiple linear regression analysis showed that gender (Beta=-27.678, p<0.001) and PA (Beta=-17.287, p=0.031) were independently related to the native T1 value.Discussion
Native T1 value is related to the myocardial fibrosis[4, 5]. Our study found that the PA patients had a higher native T1 value than those of EH patients, suggesting that PA patients developed more apparent and earlier myocardial fibrosis. Our results was in accordance with the study of Freel et al[1] which demonstrated that PA had more serious myocardial fibrosis than EH. However, some PA patients may also suffer from renal damage, which would lead to their intolerance to gadolinium injection. Therefore, T1 mapping, as an alternative and quantitative technique, can be used to detect the early myocardial fibrosis of PA patients without gadolinium contrast agent.Conclusion
PA patients represent more severe and earlier myocardium damage and this might be related to cardiovascular morbidity. The T1-mapping technique in cardiac MRI is more sensitive to evaluate the left ventricular function and to detect the myocardial fibrosis in PA patients.Acknowledgements
Funding: 1.3.5 project for disciplines of excellence, West China Hospital, Sichuan University (Grant number:ZYGD18022) & Sichuan Provincial Science and Technology Foundation (Grant number:2019YJ0040)
Tao Wu and Yan Ren contributed equally to this abstract
References
[1] Freel EM, Mark PB, Weir RA ,et al. Demonstration of blood pressure-independent noninfarct myocardial fibrosis in primary aldosteronism: a cardiac magnetic resonance imaging study. Circulation Cardiovascular imaging, 2012, 5(6):740-747.
[2] Weber KT, Janicki JS, Pick R ,et al. Myocardial fibrosis and pathologic hypertrophy in the rat with renovascular hypertension. The American journal of cardiology, 1990, 65(14):1g-7g.
[3] Funder JW, Carey RM, Mantero F ,et al. The Management of Primary Aldosteronism: Case Detection, Diagnosis, and Treatment: An Endocrine Society Clinical Practice Guideline. The Journal of clinical endocrinology and metabolism, 2016, 101(5):1889-1916.
[4] Salerno M, Kramer CM. Advances in parametric mapping with CMR imaging. JACC Cardiovascular imaging, 2013, 6(7):806-822.
[5] van Oorschot JW, Gho JM, van Hout GP ,et al. Endogenous contrast MRI of cardiac fibrosis: beyond late gadolinium enhancement. Journal of magnetic resonance imaging : JMRI, 2015, 41(5):1181-1189.
Figures