2083
T1 mapping in chronic myocarditis, dilated cardiomyopathy and hypertensive heart disease using two Modified Look-Locker schemes1Radiology Department, Cambridge University Hospitals NHS Foundation Trust, Cambridge, United Kingdom, 2Department of Diagnostic and Interventional Radiology, University Leipzig – Heart Center Leipzig, Leipzig, Germany, 3Department of Cardiology, University Leipzig – Heart Center Leipzig, Leipzig, Germany
Synopsis
.The purpose of our study was to evaluate T1-mapping for the comparison of chronic myocarditis, nonischemic dilated cardiomyopathy (DCM) and hypertensive heart disease using two MOLLI schemes in a clinical setting. We prospectively enrolled 81 patients investigated for suspected myocarditis that underwent a cardiac magnetic resonance protocol including consecutively acquired 3(3)3(3)5MOLLI and 5(3)3 MOLLI T1-mapping. We performed an overall and segmental analysis on a single mid ventricular short-axis slice. The results from the two MOLLI schemes are very similar. A segmental evaluation of 5(3)3MOLLI data could enable refining diagnosis in clinical practice, particularly when DCM is within the differential diagnoses.
Introduction
Cardiac pathologies frequently present with diffuse fibrosis at later stages [1]. Its assessment with late gadolinium enhancement (LGE), the most widely used imaging biomarker for myocardial fibrosis, may be challenging due to confounding “normal” appearing nearly isointense signal intensity and resulting globally “nulled” myocardium [2]. In hypertrophic and nonischemic dilated cardiomyopathy (DCM), LGE-negative myocardium has been reported to exhibit significantly higher native T1-relaxation time than normal controls [3]. Modified Look-Locker Inversion Recovery (MOLLI) is the most widespread technique for the measurement of myocardial T1-relaxation time due to excellent precision and high reproducibility [2]. T1-values were found abnormal in a variety of cardiomyopathies and allow for differentiation of normal and abnormal myocardium. In patients with chronic symptoms, global T1-values cannot differentiate between myocarditis evolving from inflammatory response to diffuse fibrosis and noninflammatory DCM [1]. Particularly in the setting of prolonged subacute cardiomyopathic forms of myocarditis, endomyocardial biopsy (EMB) may be necessary.The purpose of our study was to evaluate T1-mapping for the comparison of chronic myocarditis (CM), DCM and hypertensive heart disease (HHD) using two MOLLI schemes in a clinical setting.
Methods
In this single-institution study, we prospectively included 81 patients that presented >14 days after initial symptoms and underwent cardiac magnetic resonance (CMR) as part of a complete diagnostic workup for clinically suspected myocarditis in accordance to current guidelines [4]. 21 patients additionally underwent EMB. Our control group consisted of participants in which a detailed diagnostic workup was unremarkable. The study protocol was approved by the institutional ethics committee and written informed consent was obtained from all participants.The CMR protocol at 1.5T included native T1-mapping, acquired in mid-ventricular short-axis plane obtained in end-diastole using two consecutive acquisitions of ECG-gated, SSFP-based MOLLI schemes: the original 17 heartbeats 3(3)3(3)5MOLLI [5] and the modified 11 heartbeats 5(3)3MOLLI [6]. One experienced CMR reader analyzed the overall and segmental myocardial T1-relaxation using a dedicated CMR-software evaluation package. The left ventricular myocardium was delineated by manually contouring the endocardial and epicardial border; a 1-pixel erosion was applied to the manually-drawn contours to minimise partial volume effects. The contours were copied and adapted to fit in all acquired images and the generated T1-map. Each T1-map was subdivided into 6 equal segments according to the American Heart Association using the anterior right ventricular-left ventricular insertion point as reference. The quality of the T1-maps was verified by assessing each raw image regarding off-resonance artefacts and motion, and by evaluating the coefficient of determination (R2) of the exponential curve fit of the parametric maps (good fitting was defined if R2>0.97).
Results are shown as median and interquartile range. We compared results from the two schemes with paired student´s t-test and Pearson correlation coefficient r. Wilcoxon rank-sum test was used to assess differences between the patient groups. P-values < 0.05 were considered significant.
Results
General demographics and overall T1-mapping findings are presented in Table 1. 26 patients were diagnosed with CM and DCM, respectively. 19 individuals were diagnosed with HHD, while 10 participants were included in the control group. All images were of good quality and allowed further analysis. On total T1 myocardial analysis, we found significant difference between DCM and HHD for 5(3)3MOLLI (p<0.05), but not for 3(3)3(3)5MOLLI. All three pathological groups showed significantly higher overall T1-values compared to the control group. Further segmental analysis is presented in Table2. Representative cases are presented in Figure 1.Discussion
This study was performed in a clinical setting by including patients suspected of myocarditis. Our control group consisted of individuals with unremarkable investigations because healthy volunteers inherently introduce bias as they are not representative of symptomatic, but myocarditis-negative individuals referred for diagnostic testing. As previously reported [7,8,9], we found significantly higher T1-values in the septal compared to the lateral segments, particularly in DCM. These differences have been attributed to confounding factors such as magnetic susceptibility artefacts, measurement errors and the signal gradient due to greater distance from the receiver coil of the lateral segments [9]. However, these effects appear less evident in myocarditis likely due to the inflammatory process primarily affecting the lateral wall [10]. In line with previous results, on overall myocardial T1, we found significant difference between normal and disease, but no significant difference between different pathological processes [1,11].Myocardial T1 analysis is subject to partial volume effects, which may be significant for thin-walled myocardium such as in DCM [2,12]. Although both MOLLI schemes show excellent precision, in the original 3(3)3(3)5MOLLI protocol the accuracy degrades for long T1 values, particularly at higher heart rates, while 5(3)3MOLLI scheme may be used without heart rate-related bias. Additionally, the reduced flip angle in 5(3)3MOLLI reduces the off-resonance related error[2].
Limitations: The sequence order was not randomized and fatigue effects could have affected the study, but we estimate a minimal effect since no significant heart rate difference was found between the two acquisitions. Despite specific care taken when delineating the myocardium in all images, motion-induced artefacts could have led to some bias in T1-values.
Conclusion
Although the results from the two MOLLI schemes are overall very similar, a segmental evaluation of 5(3)3MOLLI data could enable refining diagnosis in clinical practice, particularly when DCM is within the differential diagnoses.Acknowledgements
No acknowledgement found.References
1. Lurz P, Luecke C, Eitel I, et al. Comprehensive Cardiac Magnetic Resonance Imaging in Patients With Suspected Myocarditis: The MyoRacer-Trial. JACC. 2016;67(15):1800-11.
2. Kellman P, Hansen MS. T1-mapping in the heart: accuracy and precision. JCMR. 2014;16:2.
3. Dass S, Suttie JJ, Piechnik SK, et al. Myocardial tissue characterization using magnetic resonance noncontrast t1 mapping in hypertrophic and dilated cardiomyopathy. Circ Cardiovasc Imaging. 2012;5:726-733.
4. Caforio AL, Pankuweit S, Arbustini E, et al; European Society of Cardiology Working Group on Myocardial and Pericardial Diseases. Current state of knowledge on aetiology, diagnosis, management, and therapy of myocarditis: a position statement of the European Society of Cardiology Working Group on Myocardial and Pericardial Diseases. Eur Heart J. 2013;34:2636–2648.
5. Messroghli DR, Radjenovic A, Kozerke S, et al. Modified Look-Locker inversion recovery (MOLLI) for highresolution T1 mapping of the heart. MRM. 2004;52:141–146.
6. Kellman P, Arai AE, Xue H. T1 and extracellular volume mapping in the heart: estimation of error maps and the influence of noise on precision. JCMR. 2013;15:56.
7. Dabir D, Child N, Kalra A, et al. Reference values for healthy human myocardium using a T1 mapping methodology: results from the International T1 Multicenter cardiovascular magnetic resonance study. JCMR. 2014;16:69.
8. Teixeira T, Hafyane T, Stikov N, et al. Comparison of different cardiovascular magnetic resonance sequences for native myocardial T1 mapping at 3T. J Cardiovasc Magn Reson. 2016;18(1):65.
9. Rogers T, Dabir D, Mahmoud I, et al. Standardization of T1 measurements with MOLLI in differentiation between health and disease--the ConSept study. J Cardiovasc Magn Reson. 2013;15:78.
10. Ferreira VM, Piechnik SK, Dall’Armellina E, et al. T(1) mapping for the diagnosis of acute myocarditis using CMR: comparison to T2-weighted and late gadolinium enhanced imaging. JACC Cardiovasc Imaging 2013;6:1048-1058.
11. Bohnen S, Radunski UK, Lund GK, et al. Performance of T1 and T2 mapping cardiovascular magnetic resonance to detect active myocarditis in patients with recent-onset heart failure. Circ Cardiovasc Imaging. 2015;8(6).
12. Piechnik SK, Ferreira VM, Lewandowski AJ, et al. Normal variation of magnetic resonance T1 relaxation times in the human population at 1.5 T using ShMOLLI. J Cardiovasc Magn Reson. 2013;15:13.
Figures

Table 1. No significant difference in HR or measured area between the two MOLLI schemes for any of the four groups. No significant difference in total T1-values between the two MOLLI schemes, Paired t-test p>0.05, Spearman r=0.81. Significant differences in R2 and STD between the two MOLLI schemes for all groups, particularly for DCM, p<0.0001. No significant difference in total T1-value between disease groups.
BSA—body-surface area; DCM—dilated cardiomyopathy; HHD—hypertensive heart disease; HR—heart rate; R2—coefficient of determination; STD—standard deviation
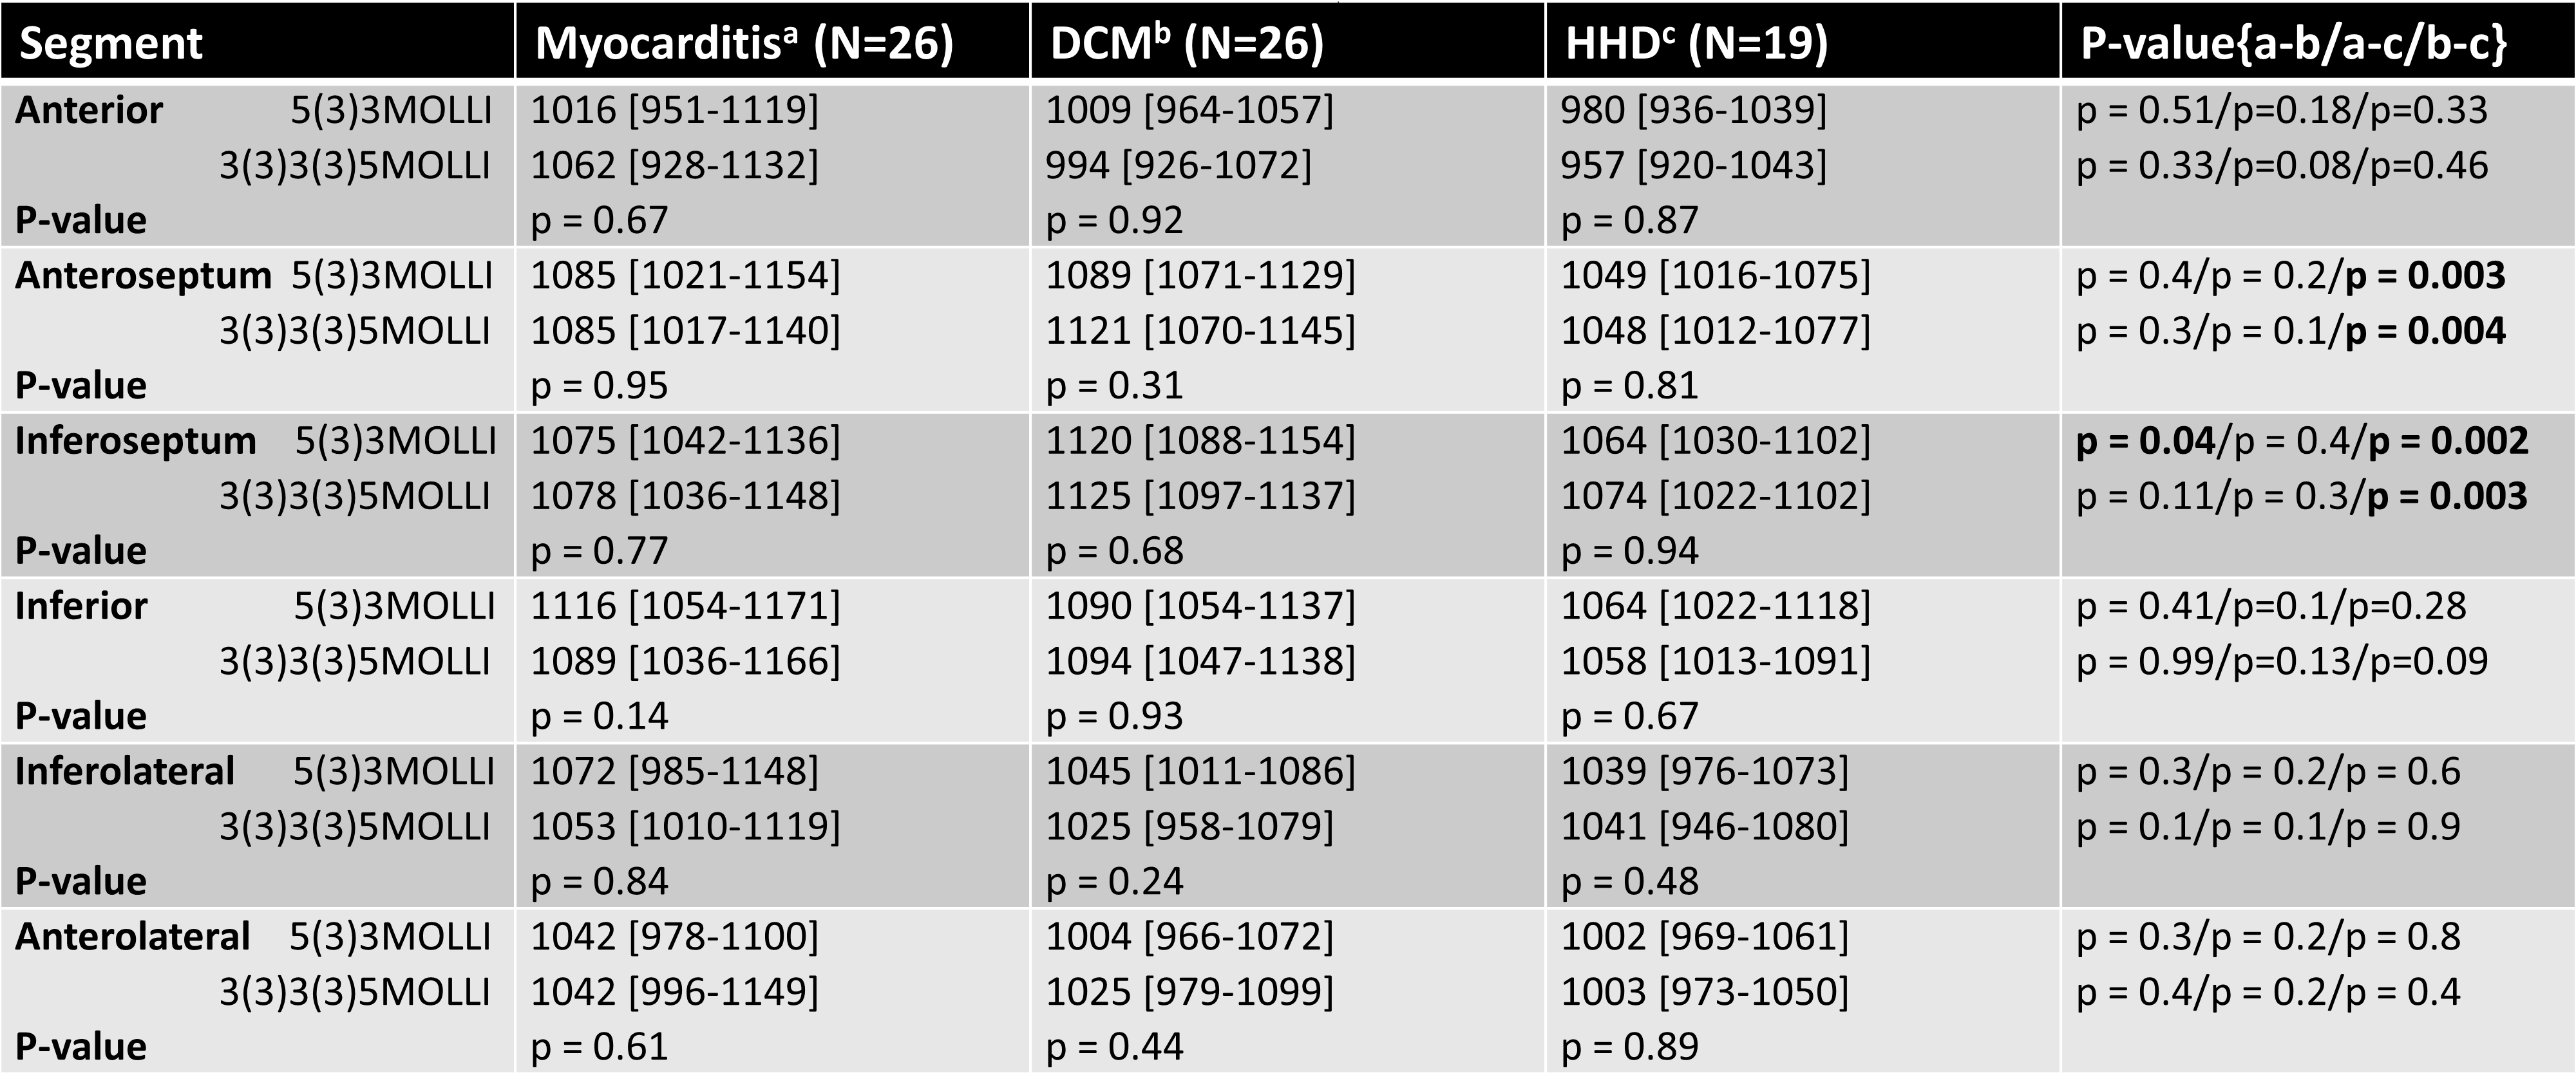
Table 2. In CM, no significant difference between septal and lateral segments, but septal segments showed significantly higher T1-values compared to lateral segments in DCM (p<0.001) for both MOLLI schemes. Significantly higher inferoseptal values in DCM compared to CM for 5(3)3MOLLI, p=0.04, but not for 3(3)3(3)5MOLLI. DCM showed significantly higher T1-values in the septal segments compared to HHD for both MOLLI (p<0.01).
DCM—dilated cardiomyopathy; HHD—hypertensive heart disease

Figure 1. Representative cases of chronic myocarditis – CM (A,B) and nonischemic dilated cardiomyopathy – DCM, (C,D). Note the significant difference between septal T1-values (yellow) and lateral T1-values (white) in DCM; no significant difference is seen between septal and lateral segments in CM. Interestingly, case A is a DCM with biopsy-proven infective myocarditis with no significant difference between septal and lateral segments, as demonstrated in CM.
Image analysis of 5(3)3 MOLLI using CMR software cvi42 version 5.1.0, Circle Cardiovascular Imaging, Calgary, Canada