2081
3D cardiac T1 and T2 mapping in a single breath-hold via compressed SENSE at 3T1Philips Healthcare Iberia, Madrid, Spain, 2Centro Nacional de Investigaciones Cardiovasculares Carlos III, Madrid, Spain, 3Department of Cardiology, IIS-Fundación Jiménez Díaz Hospital, Madrid, Spain
Synopsis
We propose a new 3D simultaneous T1 and T2 mapping technique to acquire accurate co-registered 3D T1 and T2 maps of the entire left ventricle in a single breath-hold. The technique combines T2-prep and saturation pulses with compressed SENSE.
The proposed sequence successfully acquired co-registered 3D T1 and T2 maps in a single breath-hold of 17 s (HR=60 bpm). Phantom estimated T1 and T2 values were in agreement with gold-standard values obtained from IR-SE and GraSE, respectively. Accuracy and precision results were similar to previously published values for saturation recovery at 3T.
Introduction
Cardiac parametric mapping (T1 and T2 mapping) has shown sensitivity to various cardiac diseases and has the potential to enhance the differentiation between normal and abnormal myocardium1,2. Acquiring simultaneous, co-registered T1 and T2 3D maps increases imaging efficiency by providing complete coverage of the left ventricle and sensitivity to cardiac pathologies within a single acquisition3,4.Saturation recovery sequences achieve better accuracy than inversion recovery sequences5,6. However, a key drawback of 3D T1 sequences is the long acquisition time, which can reduce their clinical applicability. To solve this problem, new techniques have recently been developed to speed up acquisition time. One such method, compressed SENSE, is built on compressed sensing and incorporates elements of SENSE, significantly reducing the acquisition time of 3D sequences7-9.
We propose a new 3D saturation recovery simultaneous T1 and T2 mapping technique to acquire accurate co-registered 3D T1 and T2 maps of the entire left ventricle in a single breath-hold. The technique combines saturation pulses shared between different readouts, T2 preparation pulses and compressed SENSE to allow 3D multiparametric estimation in one breath-hold.
Methods
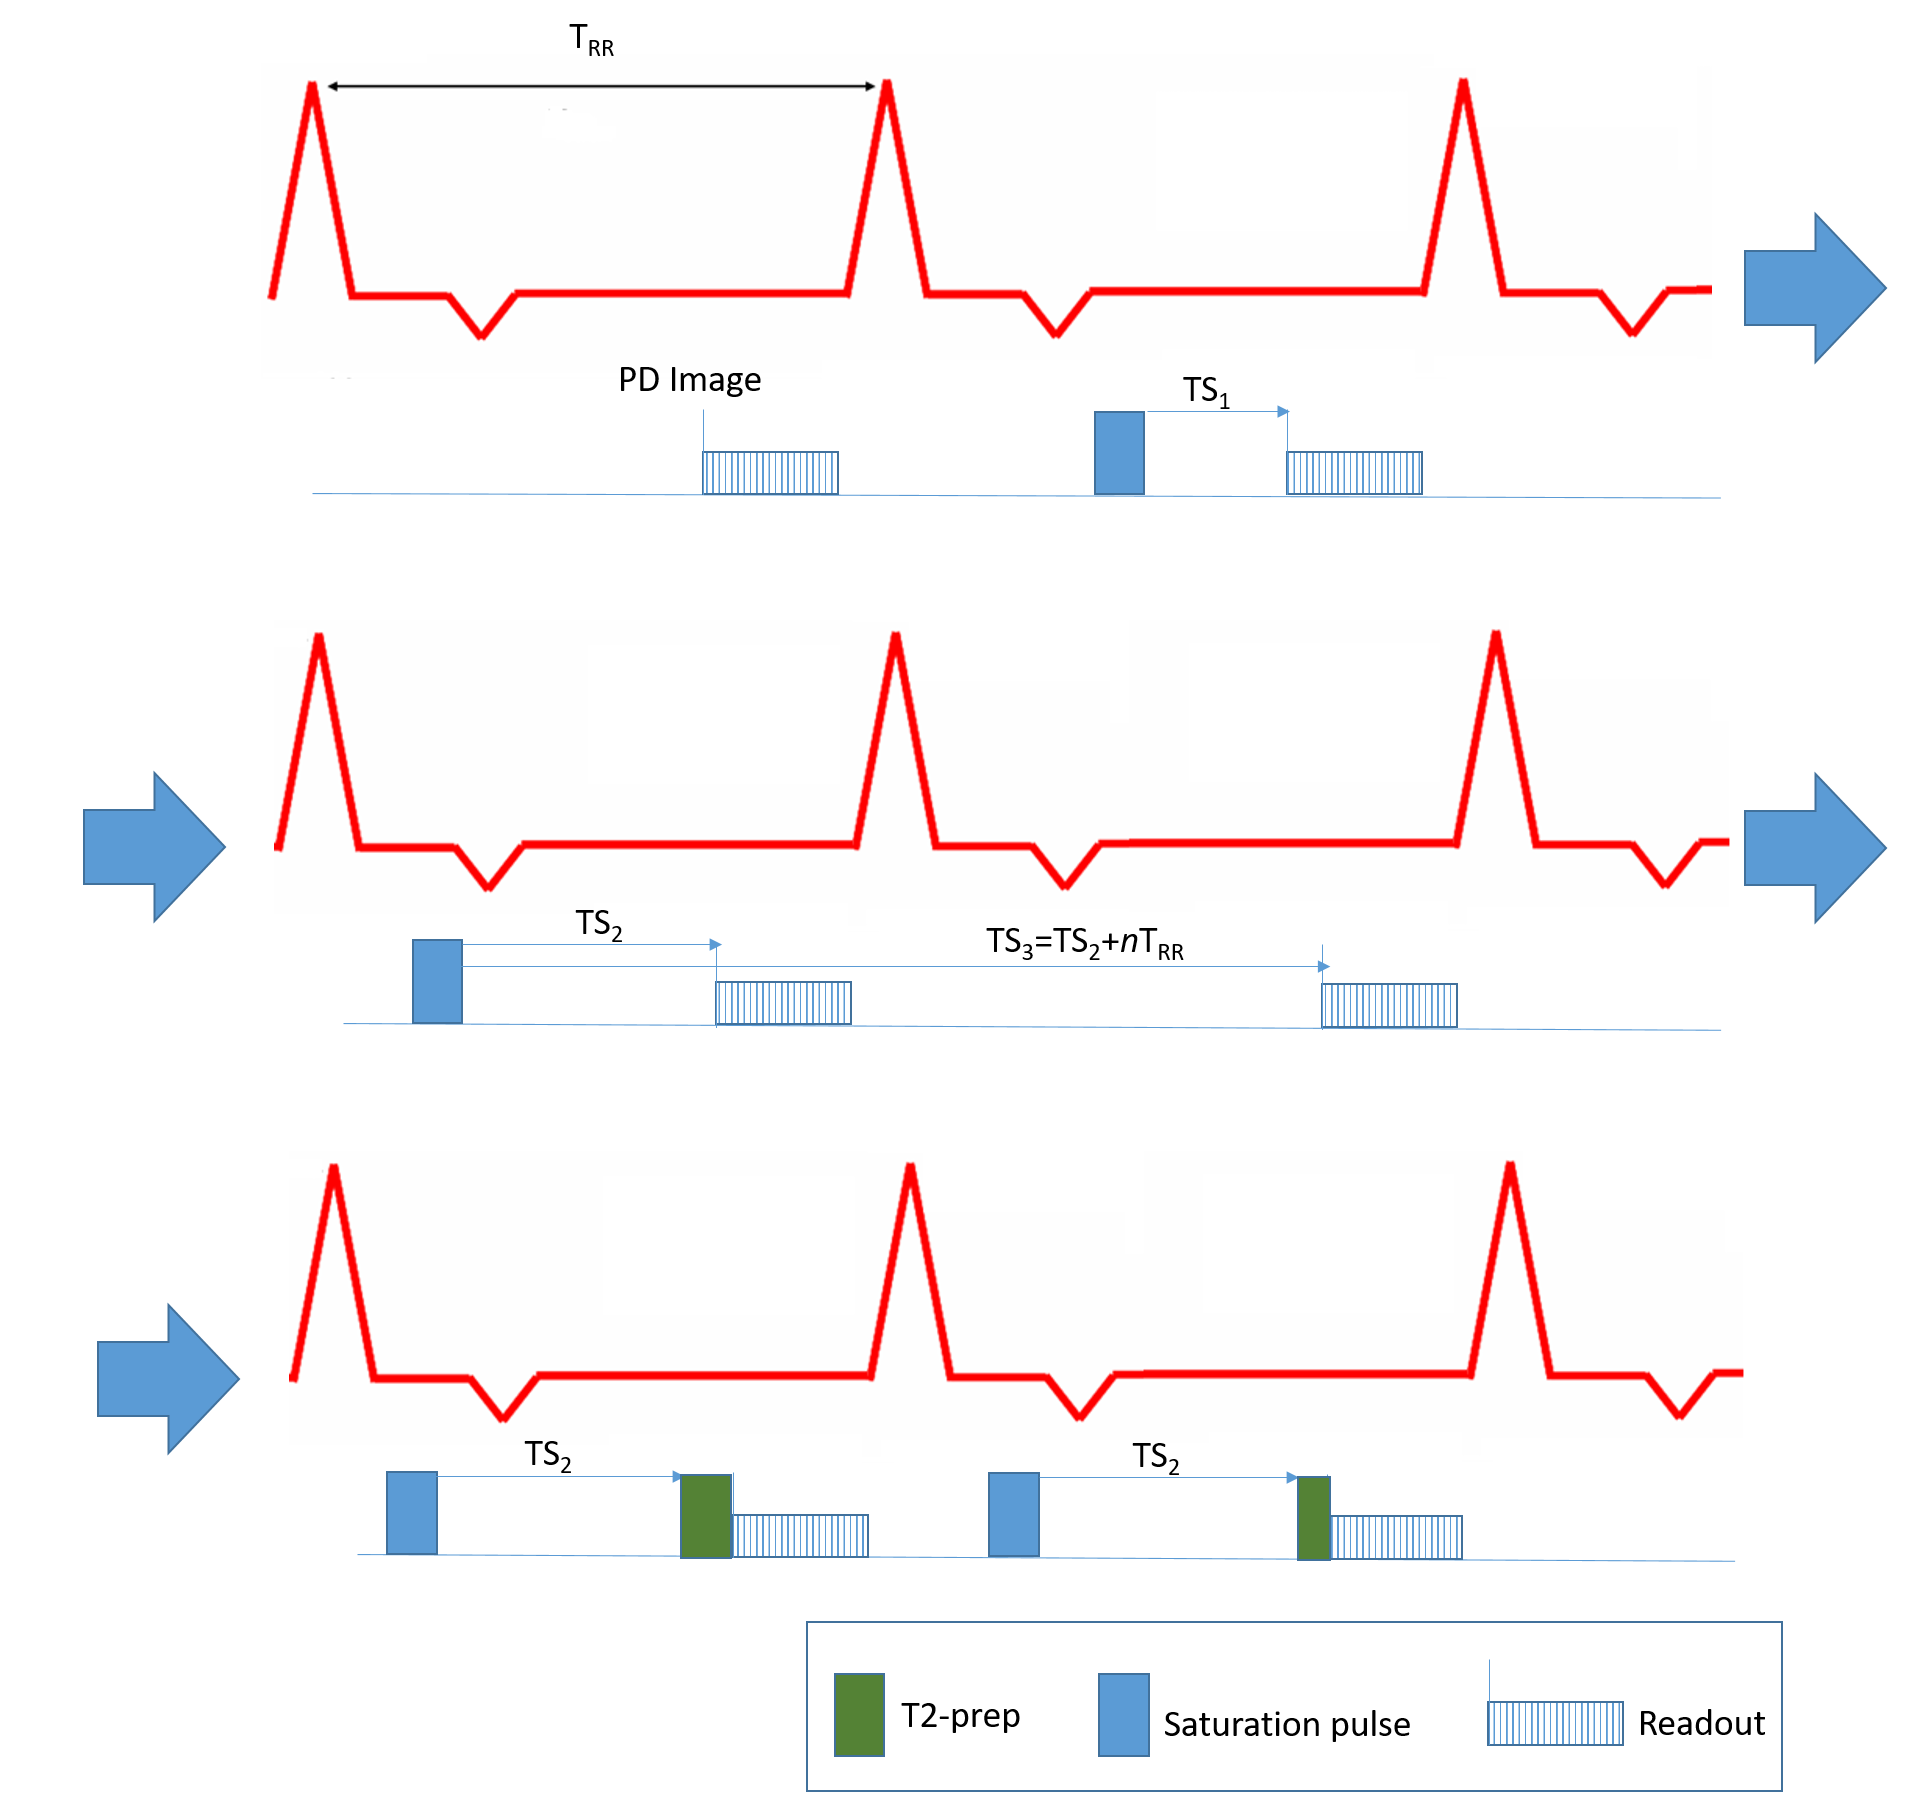
The proposed sequence is divided into three blocks (Fig1). In the first block, proton density (PD) images were acquired with 6 s intervals between readouts to avoid T1 effects. The second block consists of the acquisition of images at different saturation times (TS1=250ms, TS2, and TS3=TS2+nRRintervals). TS2 was the longest saturation time allowed by the heart rate. This time point was shared for T1 and T2 estimation, representing TE= 0 ms for T2 fitting. TS3 was adjusted to be acquired always as close as possible to the native cardiac T1 (1500 ms at 3T), changing the amount of recovering beats n according to the heart rate. The third block focuses on the T2 mapping part of the acquisition, acquiring two T2-prep images at TE of 23 and 50 ms.All acquisitions were performed on a Philips Ingenia Elition 3.0T X using a 28 channel cardiac coil.
The proposed sequence is a spoiled saturation recovery T1-TFE sequence (TR/TE/FA = 2.9ms/1.4ms/5°) with an echo train length of 74. The sequence covered 300x300x60 mm with a slice thickness of 10 mm reconstructed to 5 mm (12 slices) and in-plane resolution of 2.0x2.0 mm. A spatial domain compressed SENSE of 4.5 was applied in order to acquire the 3D volume in 2 independent TFE shots. The acquisition time was 17 RR intervals (for HR=60 bpm) and the acquired images were reconstructed in real time on the scanner.
A phantom of seven tubes was built to validate the proposed sequence. The phantom consisted of four tubes for T1 values between 700 and 2000 ms and three tubes for T2 values between 20 and 130 ms. The phantom was scanned with the proposed sequence with simulated heart rate of 60 bpm. Under the same conditions, reference T1 and T2 values were estimated using an inversion-recovery spin-echo (IR-SE) sequence (TR=10000 ms, 12 inversion times ranging 100-3000 ms) and gradient and spin-echo (GraSE) sequence (TR/TE/FA = 1000ms/61ms/90°). Proposed and reference T1 and T2 values were estimated through non-linear least square fitting following Bloch equations modelling.
Mean and standard deviation were measured from the T1 and T2 parametric maps with manually drawn regions of interest. The proposed sequence was compared against the reference techniques with linear regression analysis. The coefficient of variation (CV) and relative error were calculated for assessing precision and accuracy.
Results
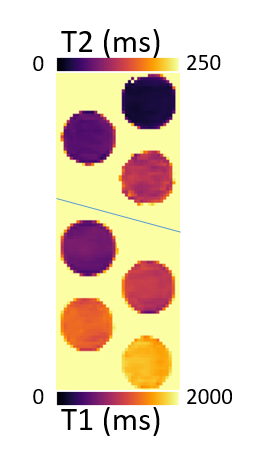
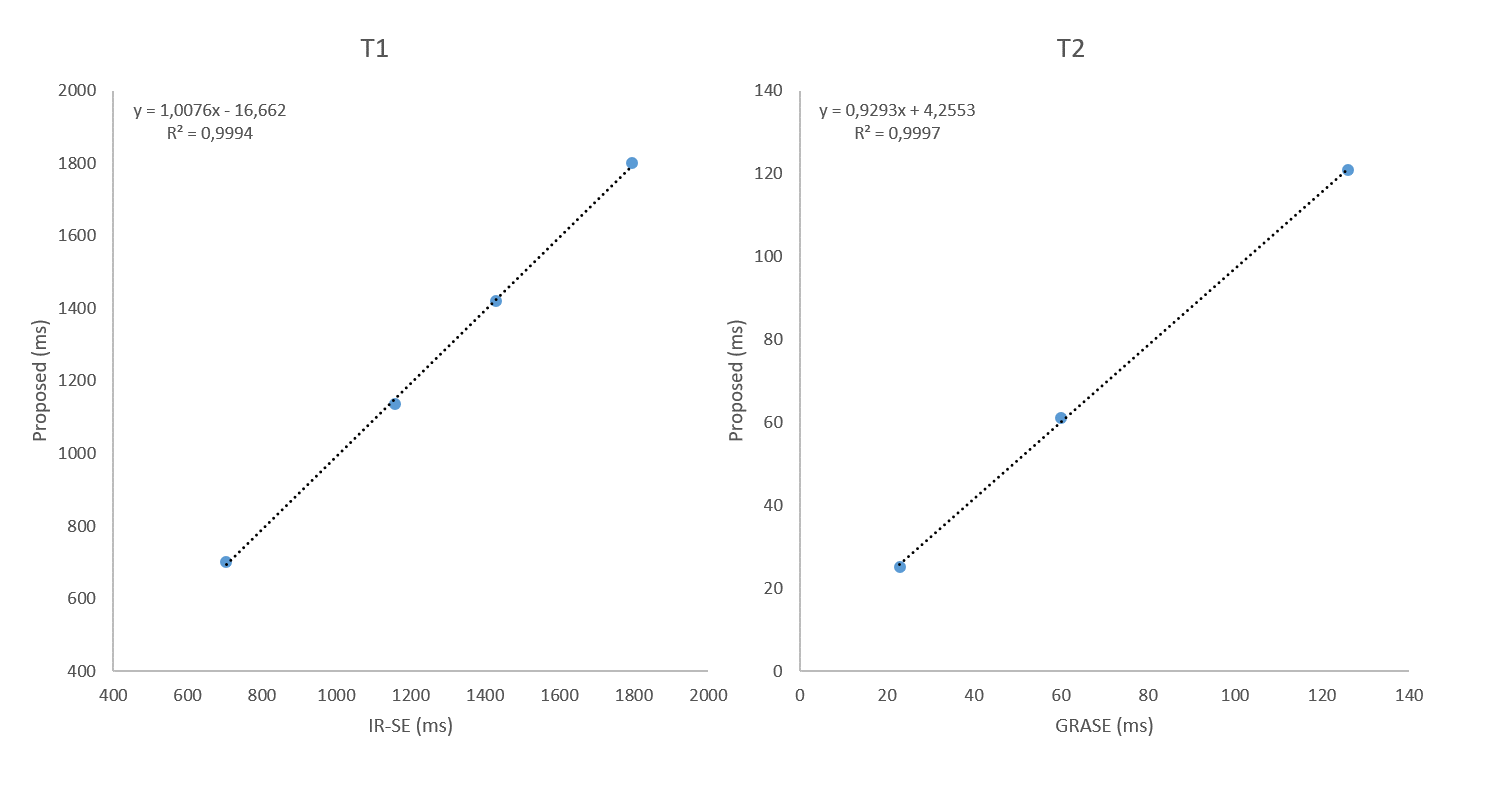
The 3D T1 and T2 maps acquired by the proposed sequence showed good homogeneity and image quality. The middle slice is shown in Fig2.The linear regression analysis showed good agreement between the relaxation parameters estimated by the proposed sequence and the ones estimated by IR-SE and GraSE (Fig3).
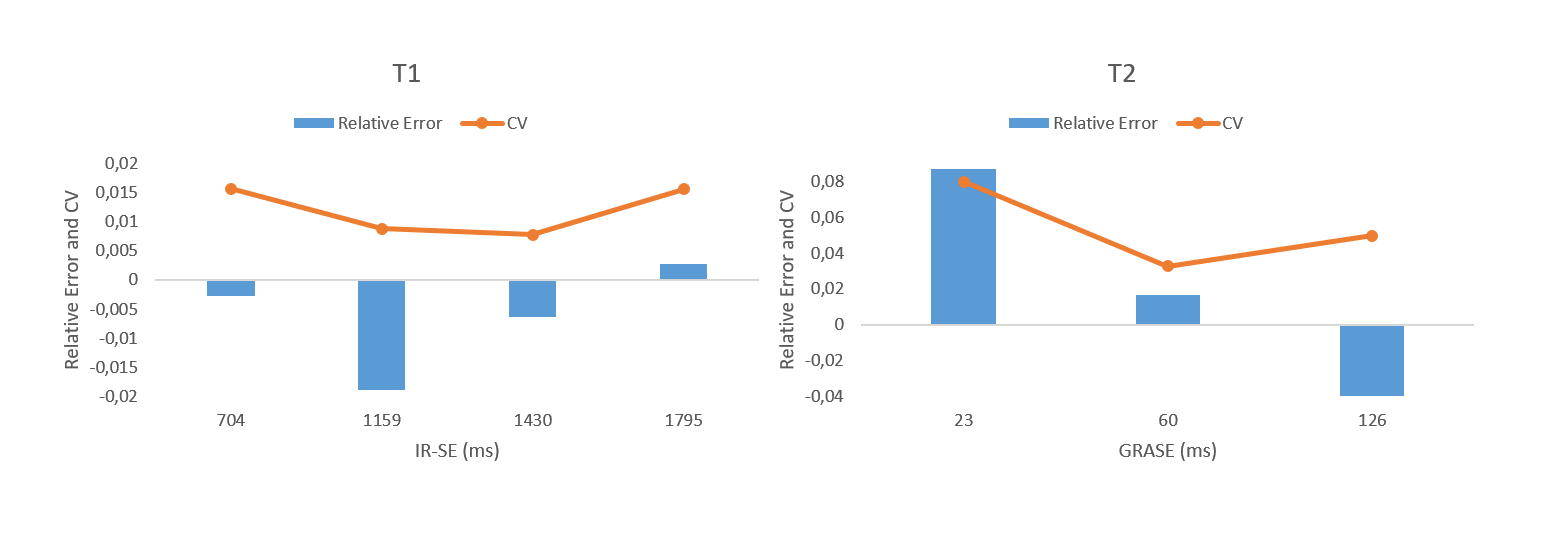
The coefficient of variation and relative error are plotted in Fig4 for both T1 and T2. The plots show that the proposed sequence achieved good accuracy and precision. The lowest accuracy and precision was found for very low T2 values (23 ms).
Discussion
The proposed sequence successfully acquired co-registered 3D T1 and T2 maps in a single breath-hold of 17 s (HR=60 bpm). The proposed sequence provides T1 and T2 values in agreement with reference values, and an accuracy and precision similar to that reported by a 3D T1 and T2 saturation recovery navigator triggered acquisition sequence at 3T4. This demonstrates the plausability of the proposed sequence design, acquisition parameters selection and parametric maps generation. Further in-vivo experiments will be performed to test the feasibility and the performance of the proposed sequence.Conclusion
A new 3D saturation recovery sequence for co-registered acquisition of T1 and T2 maps in a single-breath-hold was introduced and validated in phantoms.Acknowledgements
This project has received funding from the European Union’s Horizon 2020 research and innovation programme under the Marie Sklodowska-Curie grant agreement N722427.
This study forms part of a MRA between CNIC and Philips Healthcare.
References
1. Messroghli DR, Moon JC, Ferreira VM, Grosse-Wortmann L, He T, Kellman P, et al. Clinical recommendations for cardiovascular magnetic resonance mapping of T1, T2, T2* and extracellular volume: A consensus statement by the Society for Cardiovascular Magnetic Resonance (SCMR) endorsed by the European Association for Cardiovascular Imaging (EACVI). J Cardiovasc Magn Reson. 2017;19(1):75.2.
2. Galán-Arriola C, Lobo M, Vílchez-Tschischke JP, López GJ, de Molina-Iracheta A, Pérez-Martínez C, et al. Serial Magnetic Resonance Imaging to Identify Early Stages of Anthracycline-Induced Cardiotoxicity. J Am Coll Cardiol. 2019 Feb 26;73(7):779–91.
3. Kvernby S, Warntjes MJB, Haraldsson H, Carlhäll C-J, Engvall J, Ebbers T. Simultaneous three-dimensional myocardial T1 and T2 mapping in one breath hold with 3D-QALAS. J Cardiovasc Magn Reson. 2014 Dec;16(1):102.
4. Guo R, Chen Z, Herzka DA, Luo J, Ding H. A three‐dimensional free‐breathing sequence for simultaneous myocardial T 1 and T 2 mapping. Magn Reson Med. 2019 Feb;81(2):1031–43.
5. Messroghli DR, Radjenovic A, Kozerke S, Higgins DM, Sivananthan MU, Ridgway JP. Modified Look-Locker inversion recovery (MOLLI) for high-resolution T1 mapping of the heart. Magn Reson Med. 2004 Jul 1;52(1):141–6.
6. Chow K, Flewitt JA, Green JD, Pagano JJ, Friedrich MG, Thompson RB. Saturation recovery single-shot acquisition (SASHA) for myocardial T1 mapping. Magn Reson Med. 2014;71(6):2082–95.
7. Lustig M, Donoho D, Pauly JM. Sparse MRI: The application of compressed sensing for rapid MR imaging. Magn Reson Med. 2007;58(6):1182–95.
8. Pruessmann KP, Weiger M, Scheidegger MB, Boesiger P. SENSE: Sensitivity encoding for fast MRI. Magn Reson Med. 1999;42(5):952–62.
9. Vranic JE, Cross NM, Wang Y, Hippe DS, Weerdt E de, Mossa-Basha M. Compressed Sensing–Sensitivity Encoding (CS-SENSE) Accelerated Brain Imaging: Reduced Scan Time without Reduced Image Quality. Am J Neuroradiol. 2019 Jan 1;40(1):92–8.
Figures