2079
Extra-cellular volume (ECV) mapping using fast single-breathhold 2D multi-slice myocardial T1 mapping (FAST1) at 1.5T
Li Huang1, Radhouene Neji1,2, Filippo Bosio1, Amedeo Chiribiri1, Reza Razavi1, and Sébastien Roujol1
1School of Biomedical Engineering and Imaging Sciences, Faculty of Life Sciences and Medicine, King's College London, London, United Kingdom, 2MR Research Collaborations, Siemens Healthcare Limited, Frimley, United Kingdom
1School of Biomedical Engineering and Imaging Sciences, Faculty of Life Sciences and Medicine, King's College London, London, United Kingdom, 2MR Research Collaborations, Siemens Healthcare Limited, Frimley, United Kingdom
Synopsis
Extra-cellular volume (ECV) mapping using combined native and post-contrast myocardial T1 maps shows promise in assessing cardiomyopathies. However, its feasibility for full left ventricular (LV) coverage is limited using conventional myocardial T1 mapping techniques such as modified Look-Locker inversion recovery (MOLLI) with single-slice acquisition per breathhold. The previously proposed fast single-breathhold 2D multi-slice myocardial T1 mapping (FAST1) technique can provide time-efficient full LV coverage. In this work, its capability for ECV mapping with full LV coverage at 1.5T is evaluated. Compared to MOLLI, FAST1 yields 4-fold increased spatial coverage, limited penalty of ECV spatial variability and highly correlated ECV values.
Introduction
Extra-cellular volume (ECV) mapping shows promise for the diagnosis and prognosis of cardiomyopathies1. This technique is based on combined native and post-contrast myocardial T1 maps which can be acquired using standard T1 mapping techniques such as modified Look-Locker inversion recovery (MOLLI)2-3. MOLLI is commonly used for its high precision and reproducibility4-6. However, this technique acquires one slice per breathhold, thus limiting the feasibility of ECV mapping with full left ventricular (LV) coverage. Alternatively, the previously-proposed fast single-breathhold 2D multi-slice myocardial T1 mapping (FAST1)7 technique can achieve full LV coverage in three breathholds at 1.5T. In this work, we sought to validate the capability of FAST1 in time-efficient full LV coverage for ECV mapping at 1.5T.Methods
(1) Sequence: FAST17 and conventional 5-(3)-3 MOLLI sequences were performed on a 1.5T scanner (MAGNETOM Aera, Siemens Healthcare, Erlangen, Germany). Both sequences used the same 2D bSSFP parameters: TR/TE/α=2.70ms/1.12ms/35°, FOV=360×306mm2, pixel size=1.4×2.1mm2, slice thickness=8mm, short-axis slice orientation, GRAPPA factor=2, partial Fourier factor=7/8, bandwidth=1085Hz/px, first TI=100ms. FAST1 was used to acquire 5 slices in one ~12s breathhold using slice-selective inversion pulses and 2 images per slice7.(2) Cohort: 13 consecutive patients (8 male, 51±17yrs) referred for cardiac MRI examination in our center were recruited. An injection of 0.1mmol/kg of gadobutrol (Gadovist, Bayer Vital, Leverkusen, Germany) was applied for each patient. FAST1 and MOLLI were both performed three times within three consecutive breathholds at different slice positions to acquire 15 contiguous and 3 separated slices of the LV, respectively. Note the 3 slices in the MOLLI sequence were at the same positions as the 3 central slices in the first FAST1 sequence. This protocol was performed twice per subject for native and post-contrast t1 mapping, respectively.
(3) Reconstruction: Native and post-contrast T1-weighted images were at first co-registered8-9 using the longest-TI images of each dataset as reference. T1 map reconstruction of FAST1 was performed using signal dictionary matching7,10 while standard 3-parameter model based reconstruction was used for MOLLI2-3. Since FAST1 cannot quantify blood T1 times due to the presence of in-flow effects when slice-selective inversion is applied, blood T1 times in MOLLI datasets were used instead. Synthetic hematocrit was computed based on blood T1 times11.
(4) Analyses: ECV measurements and ECV spatial variability obtained using FAST1 and MOLLI were quantified in each myocardial segment using the 16-segment model12 on the three common slices in both datasets. 21 of 208 segments (10%) in any of both datasets showed visually substantial artifacts due to unsuccessful co-registration, and thus were discarded from both datasets for statistical analyses.
Results
Example ECV maps are shown in Fig. 1. Compared to MOLLI, FAST1 yielded slightly decreased ECV measurements (0.29±0.04 vs. 0.30±0.04, p<0.01) and higher spatial variability by a factor of ~1.3 (0.05±0.01 vs. 0.04±0.01, p<0.001) (Fig. 2). Segmental standard deviation of ECV measurements and spatial variability using both techniques across all patients were 0.03±0.00 vs. 0.03±0.01 (p=0.01) and 0.01±0.00 vs. 0.01±0.00 (p=0.12), respectively (Fig. 3). Pearson correlation and Bland-Altman analyses showed a high linear correlation coefficient of 0.92 (p<0.0001) and good agreement (bias=-0.02±0.02, 95% limit of agreement=0.03, p<0.01) between the two techniques (Fig. 4).Discussion
For clinical applications, a single-slice MOLLI scan following FAST1 could be appended to obtain native and post-contrast blood T1 time as well as synthetic hematocrit. A larger study in a patient cohort with regional ECV variations is warranted in the future.Conclusion
FAST1 yields a 4-fold increase of spatial coverage, limited penalty of ECV spatial variability and highly correlated ECV values in comparison with MOLLI at 1.5T.Acknowledgements
This work was supported by the Engineering and Physical Sciences Research Council (EPSRC) grant (EP/R010935/1), the Wellcome EPSRC Centre for Medical Engineering at King’s College London (WT 203148/Z/16/Z), the National Institute for Health Research (NIHR) Biomedical Research Centre based at Guy’s and St Thomas’ National Health Service (NHS) Foundation Trust and King’s College London, and Siemens Healthcare. The views expressed are those of the authors and not necessarily those of the NHS, the NIHR or the Department of Health.References
- Moon JC, Messroghli DR, Kellman P, Piechnik SK, Robson MD, Ugander M, Gatehouse PD, Arai AE, Friedrich MG, Neubauer S, Schulz-Menger J, Schelbert EB. Myocardial T1 mapping and extracellular volume quantification: a Society for Cardiovascular Magnetic Resonance (SCMR) and CMR Working Group of the European Society of Cardiology consensus statement. J Cardiovasc Magn Reson. 2013;15(1):92.
- Messroghli DR, Radjenovic A, Kozerke S, Higgins DM, Sivananthan MU, Ridgway JP. Modified Look-Locker inversion recovery (MOLLI) for high-resolution T1 mapping of the heart. Magn Reson Med. 2004;52(1):141-146.
- Messroghli DR, Niendorf T, Schulz-Menger J, Dietz R, Friedrich MG. T1 mapping in patients with acute myocardial infarction. J Cardiovasc Magn Reson. 2003;5(2):353-359.
- Roujol S, Weingärtner S, Foppa M, Chow K, Kawaji K, Ngo LH, Kellman P, Manning WJ, Thompson RB, Nezafat R. Accuracy, precision, and reproducibility of four T1 mapping sequences: a head-to-head comparison of MOLLI, ShMOLLI, SASHA, and SAPPHIRE. Radiology. 2014;272(3):683-689.
- Kellman P, Hansen MS. T1-mapping in the heart: accuracy and precision. J Cardiovasc Magn Reson. 2014;16(1):2.
- Weingärtner S, Meßner NM, Budjan J, Loßnitzer D, Mattler U, Papavassiliu T, Zöllner FG, Schad LR. Myocardial T 1-mapping at 3T using saturation-recovery: reference values, precision and comparison with MOLLI. J Cardiovasc Magn Reson. 2017;18(1):84.
- Huang L, Neji R, Nazir MS, Whitaker J, Duong P, Reid F, Bosio F, Chiribiri A, Razavi R, Roujol S. FASt single-breathhold 2D multi-slice myocardial T1 mapping (FAST1) at 1.5T for full left ventricular coverage in three breathholds. J Magn Reson Imag. 2019;epub.
- Xue H, Shah S, Greiser A, Guetter C, Littmann A, Jolly MP, Arai AE, Zuehlsdorff S, Guehring J, Kellman P. Motion correction for myocardial T1 mapping using image registration with synthetic image estimation. Magn Reson Med. 2012;67:1644-1655.
- Roujol S, Foppa M, Weingärtner S, Manning WJ, Nezafat R. Adaptive registration of varying contrast-weighted images for improved tissue characterization (ARCTIC): Application to T1 mapping. Magn Reson Med. 2015;73:1469-1482.
- Huang L, Neji R, Nazir MS, Whitaker J, Reid F, Bosio F, Chiribiri A, Razavi R, Roujol S. Fast myocardial T1 mapping using shortened inversion recovery based schemes. J Magn Reson Imag. 2019;50(2):641-654.
- Treibel TA, Fontana M, Maestrini V, Castelletti S, Rosmini S, Simpson J, Nasis A, Bhuva AN, Bulluck H, Abdel-Gadir A, White SK, Manisty C, Spottiswoode BS, Wong TC, Piechnik SK, Kellman P, Robson MD, Schelbert EB, Moon JC. Automatic measurements of the myocardial interstitium: Synthetic extracellular volume quantification without hematocrit sampling. JACC Cardiovasc Imag. 2016;9(1):54-63.
- Cerqueira MD, Weissman NJ, Dilsizian V, Jacobs AK, Kaul S, Laskey WK, Pennell DJ, Rumberger JA, Ryan T, Verani MS. Standardized myocardial segmentation and nomenclature for tomographic imaging of the heart. A statement for healthcare professionals from the Cardiac Imaging Committee of the Council on Clinical Cardiology of the American Heart Association. Circulation. 2002;105(4):539-542.
Figures
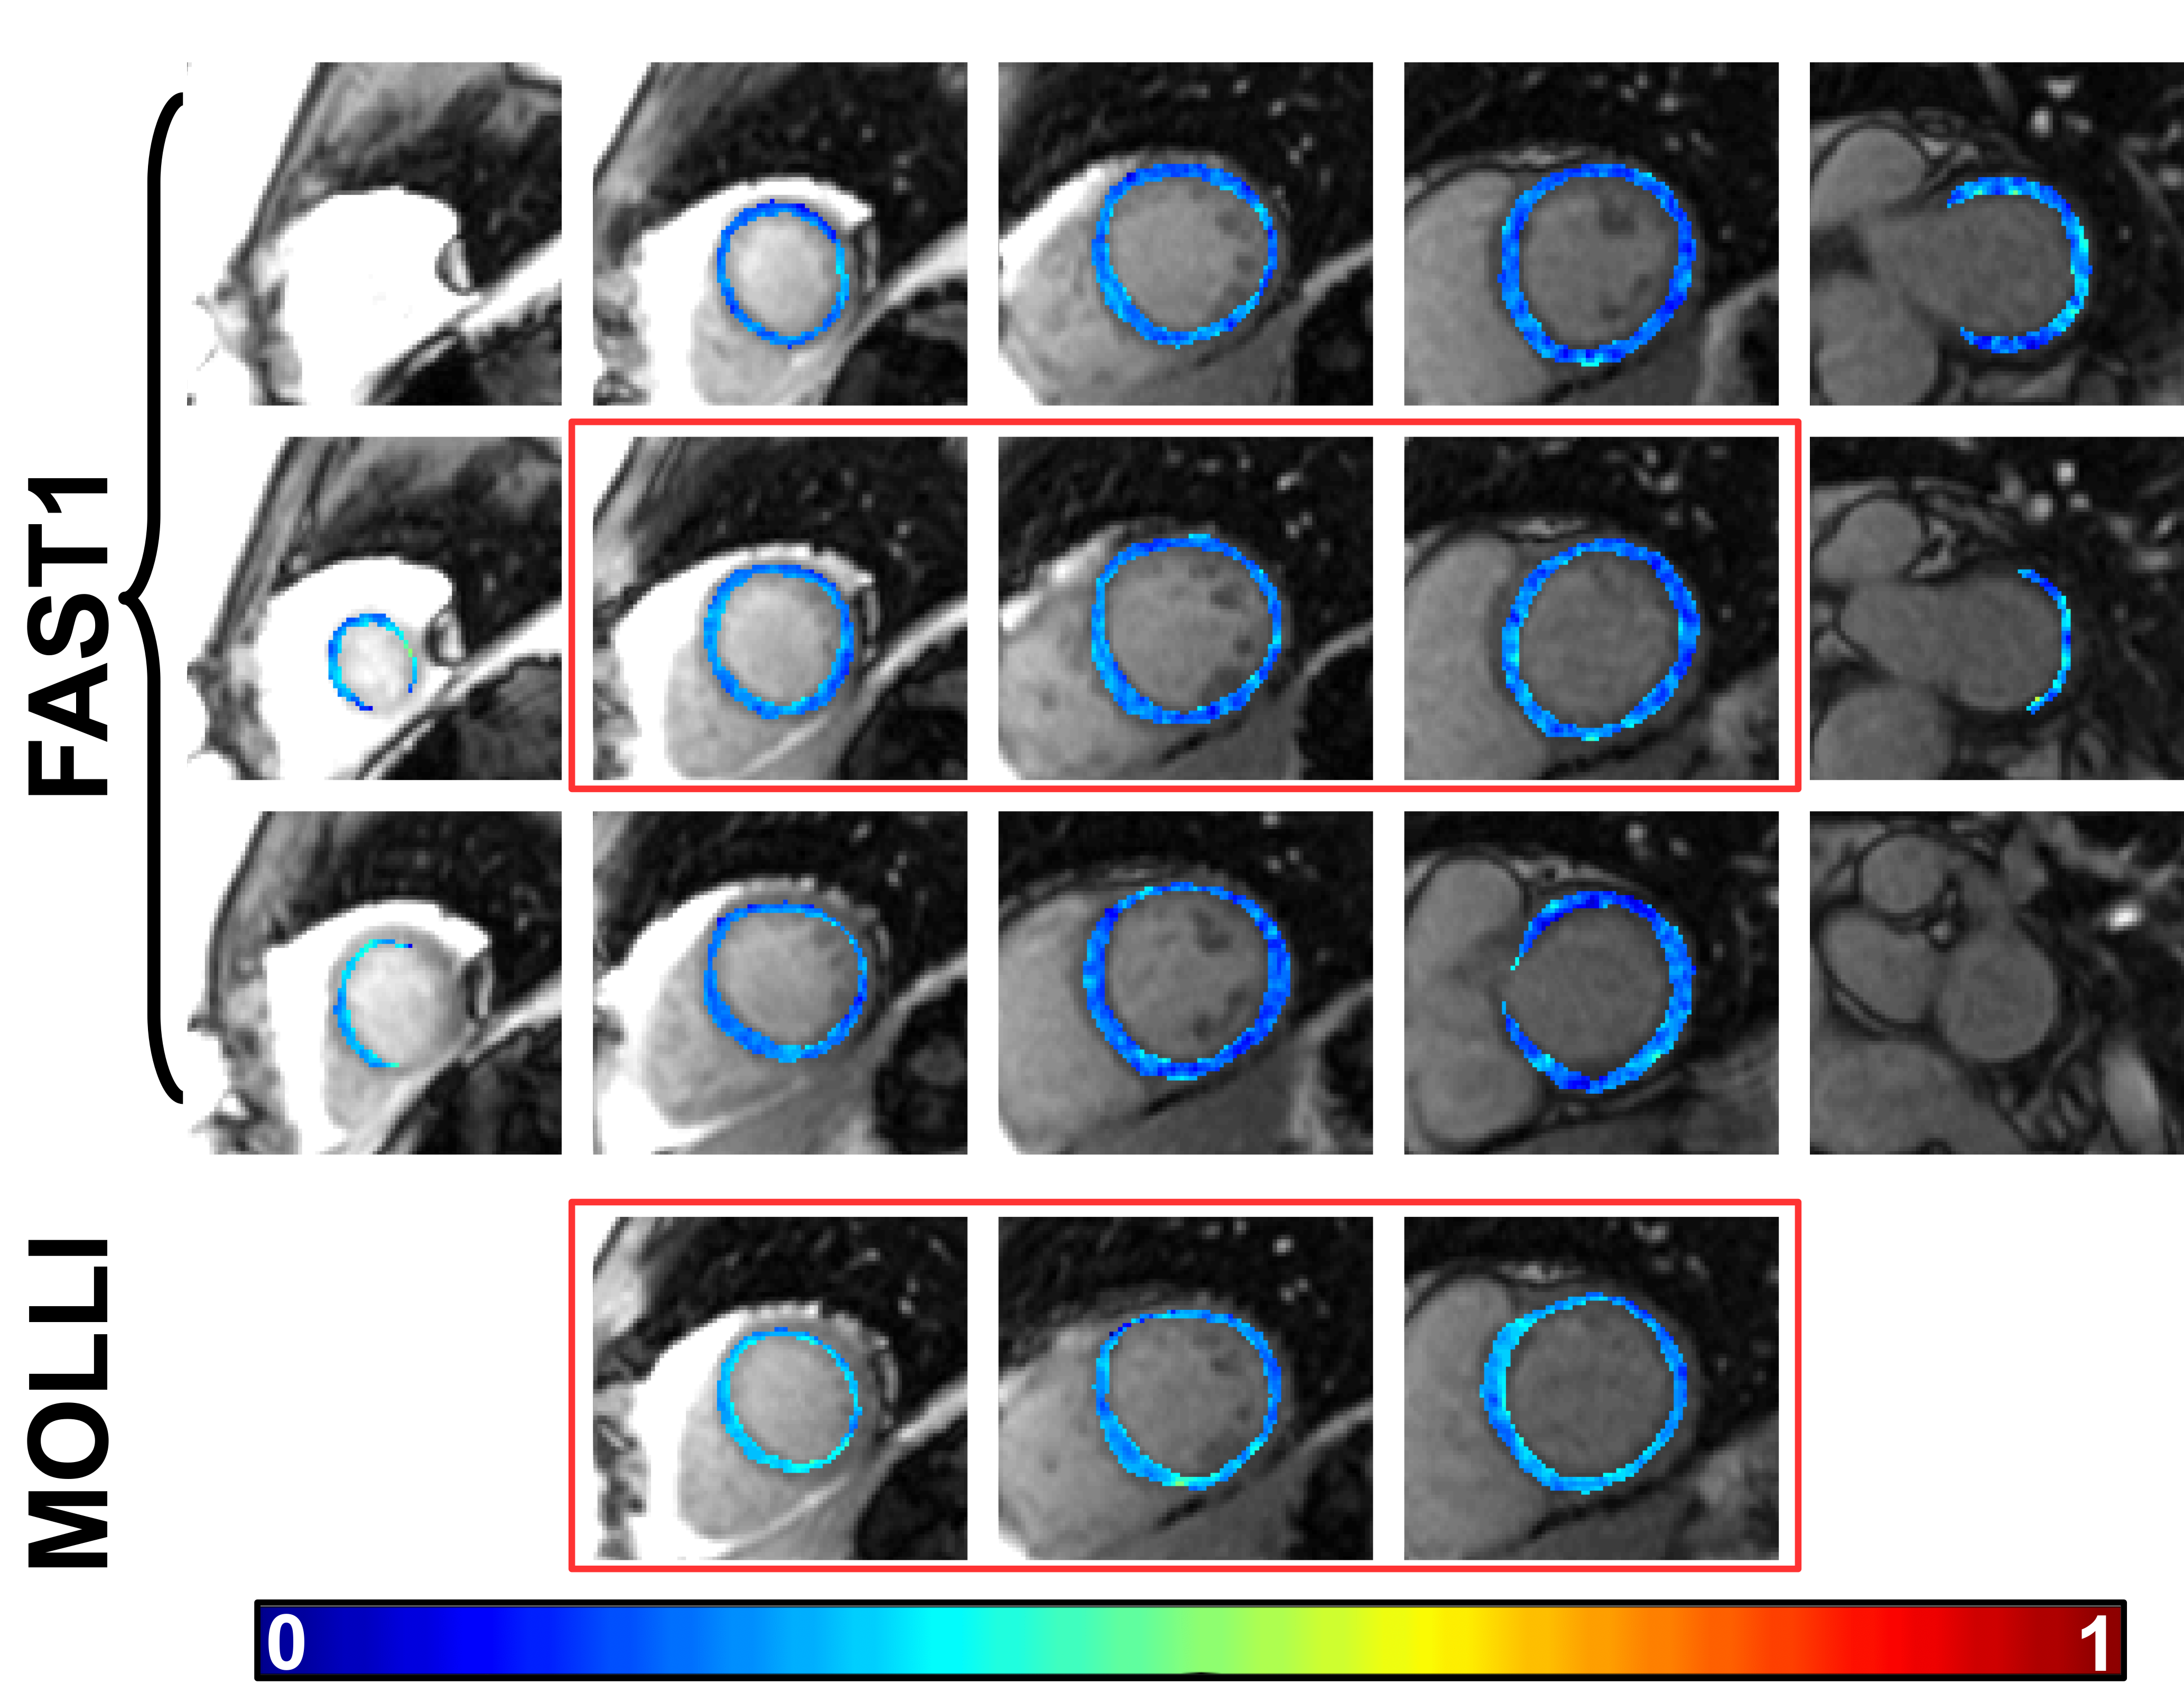
Fig. 1. Representative example ECV maps of a
patient admitted for suspected myocarditis using FAST1 and MOLLI. Note that each row
of FAST1 T1 maps and each MOLLI T1 map represent a sequence run within one
breathhold, respectively. The red rectangles indicate the three common slice positions in
both datasets.
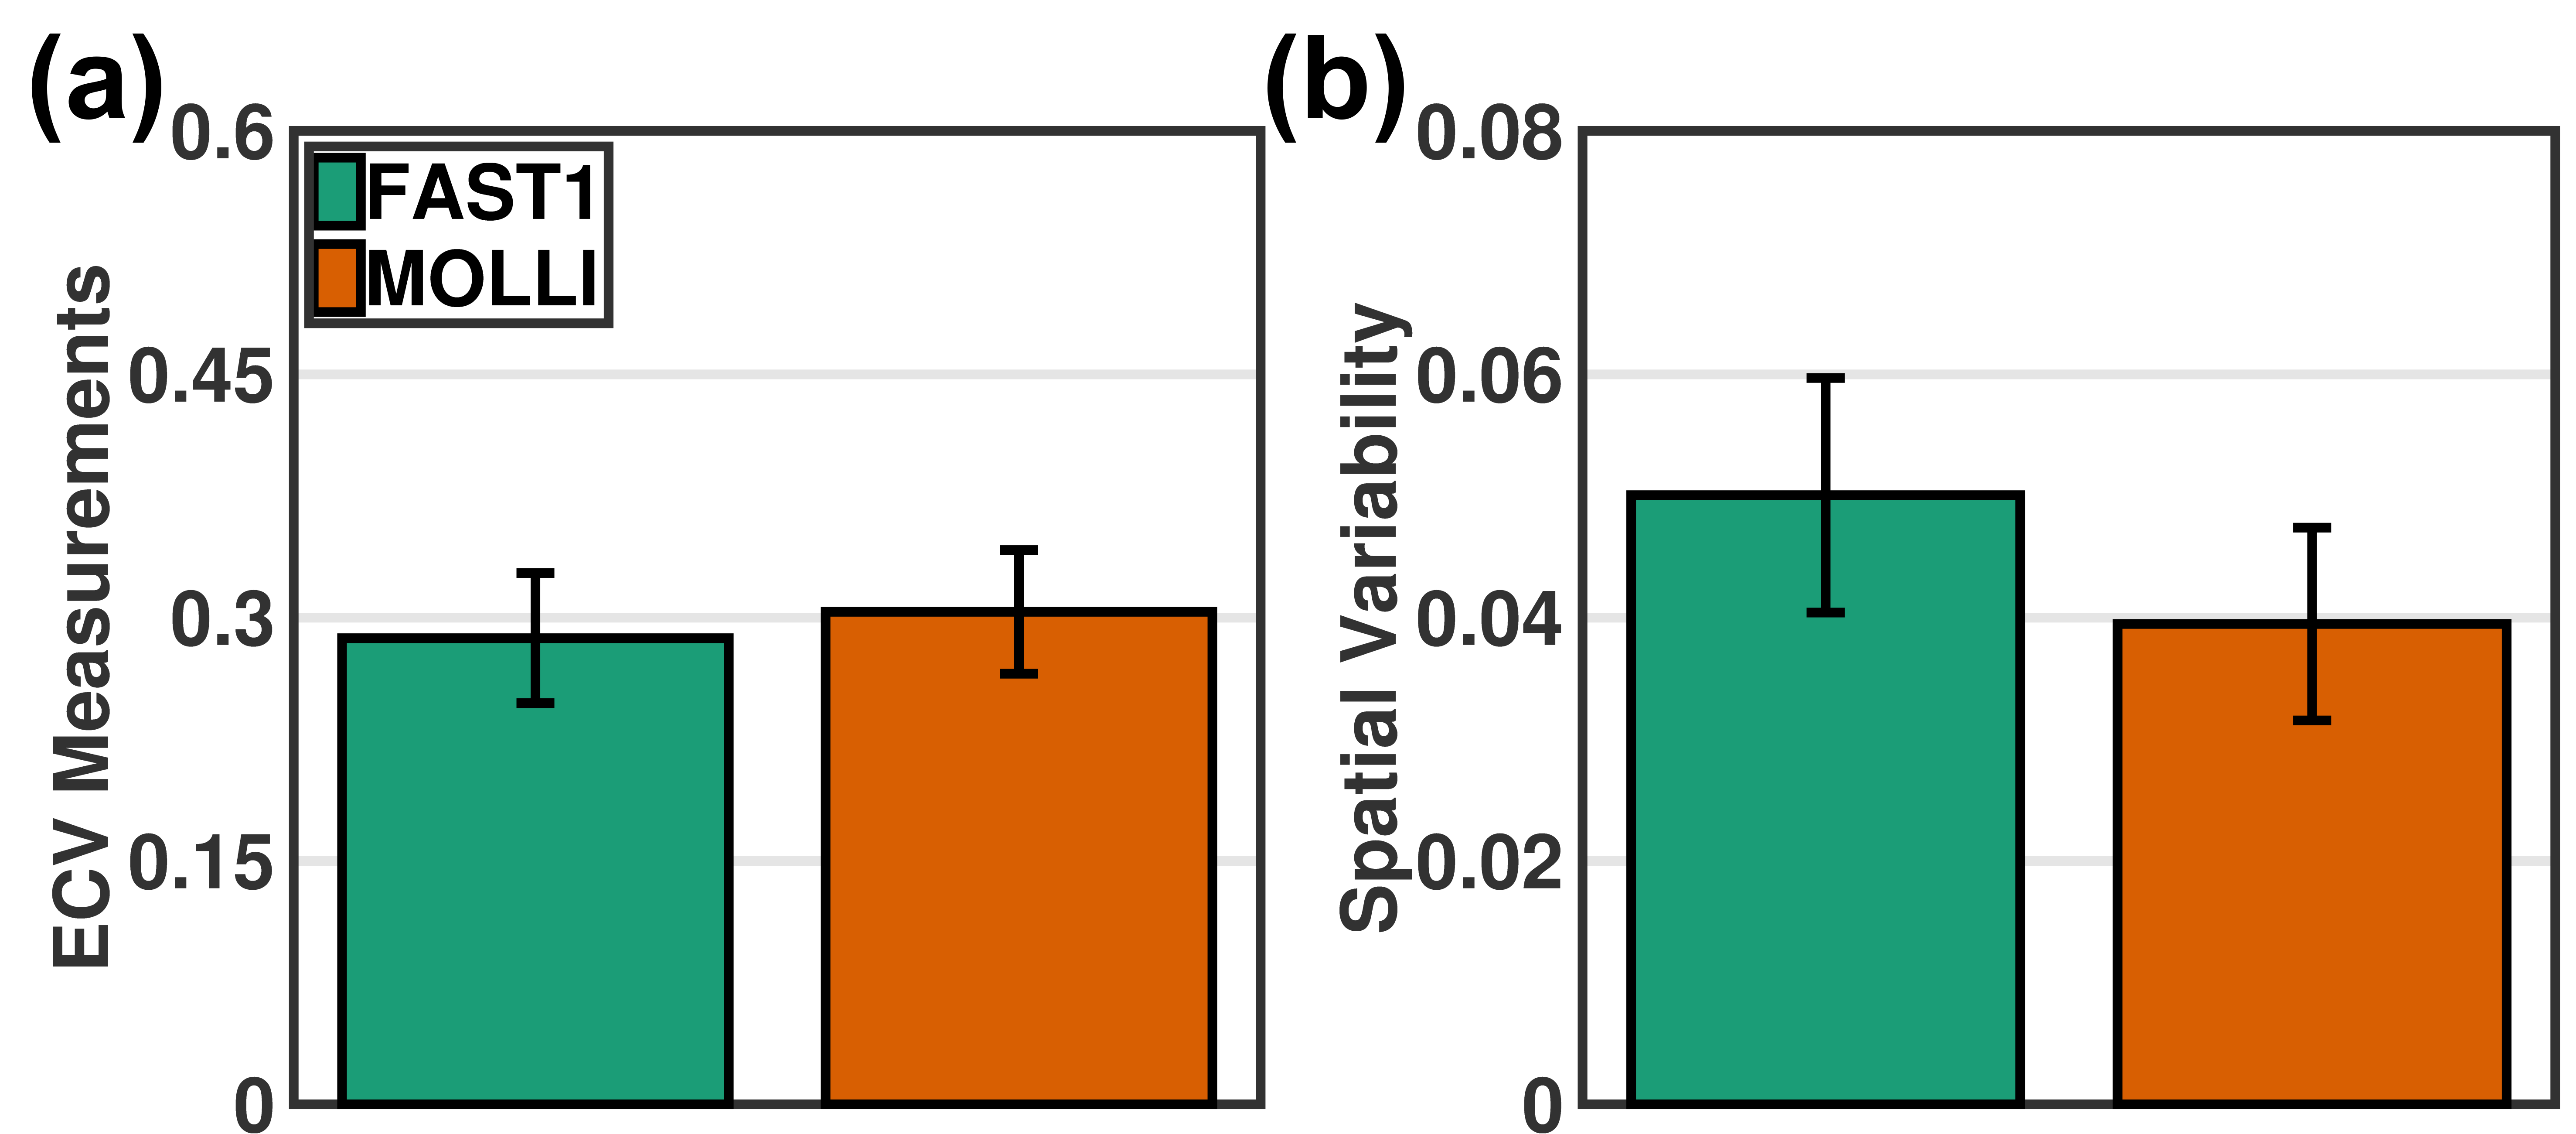
Fig.
2. Bar
plots of FAST1 and MOLLI in terms of ECV measurements (a) and spatial variability (b)
across all patients.
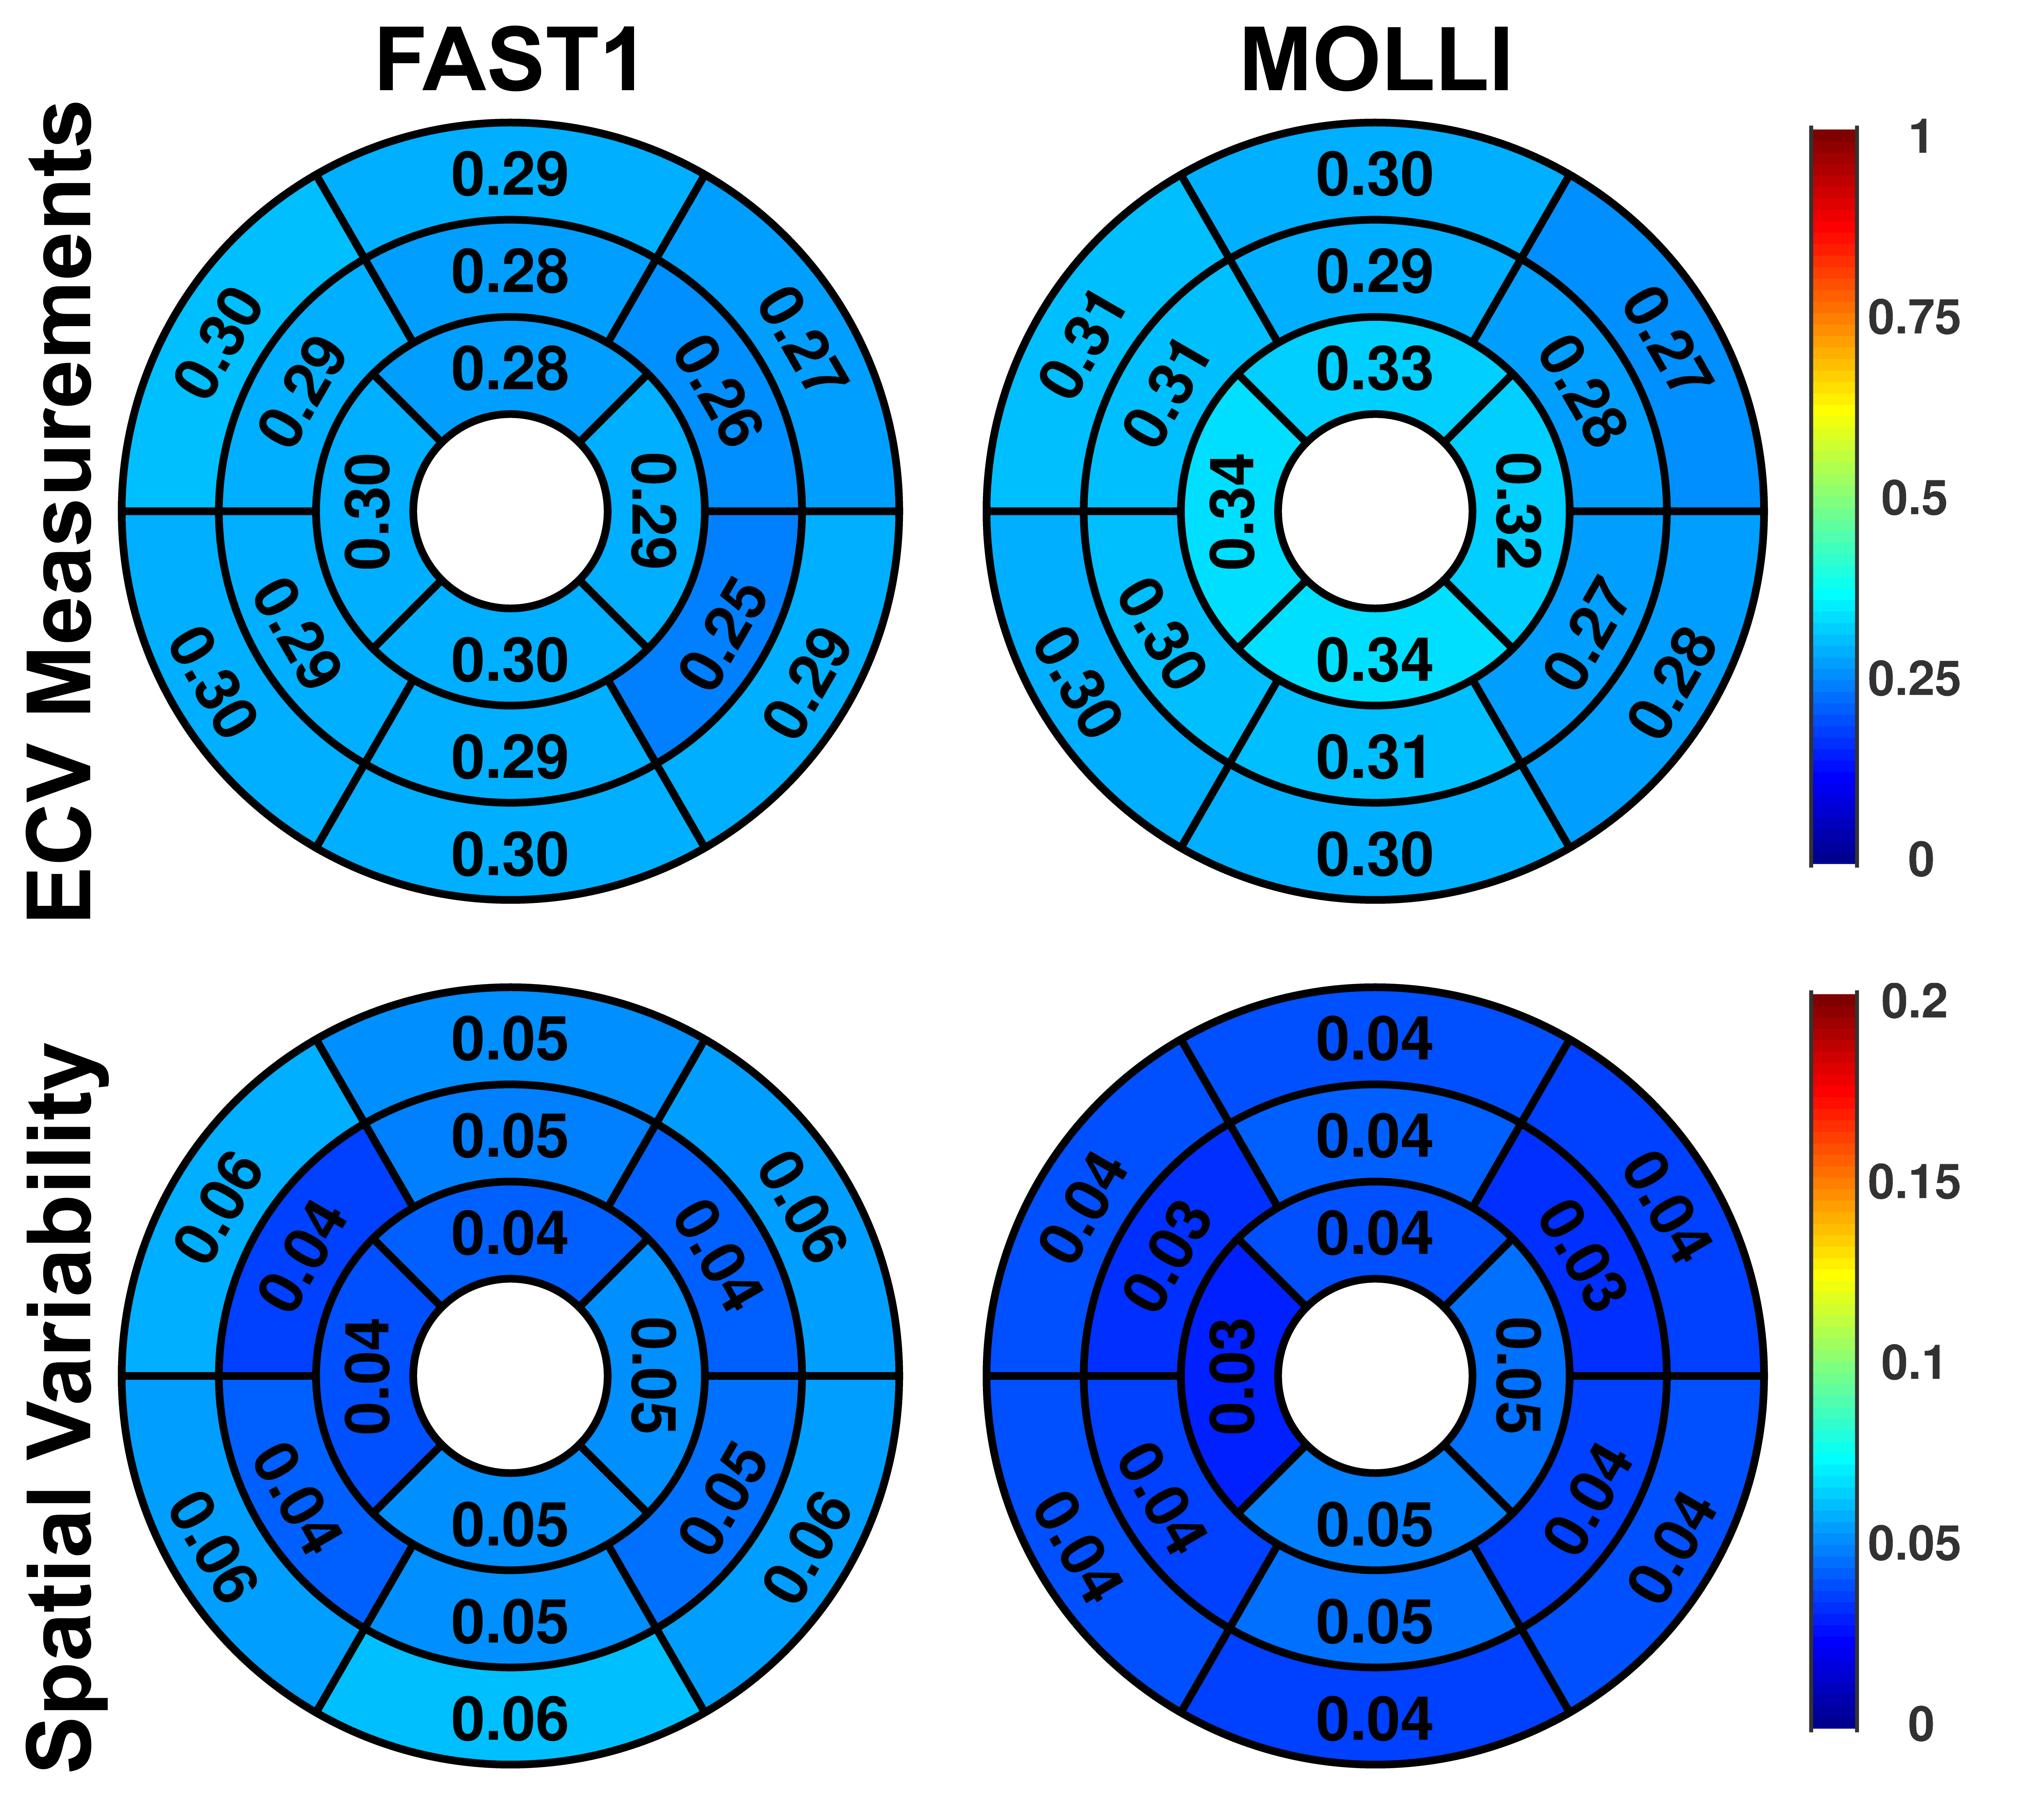
Fig. 3. Segmental analysis of FAST1 and MOLLI
regarding to ECV measurements and spatial variability across all patients.
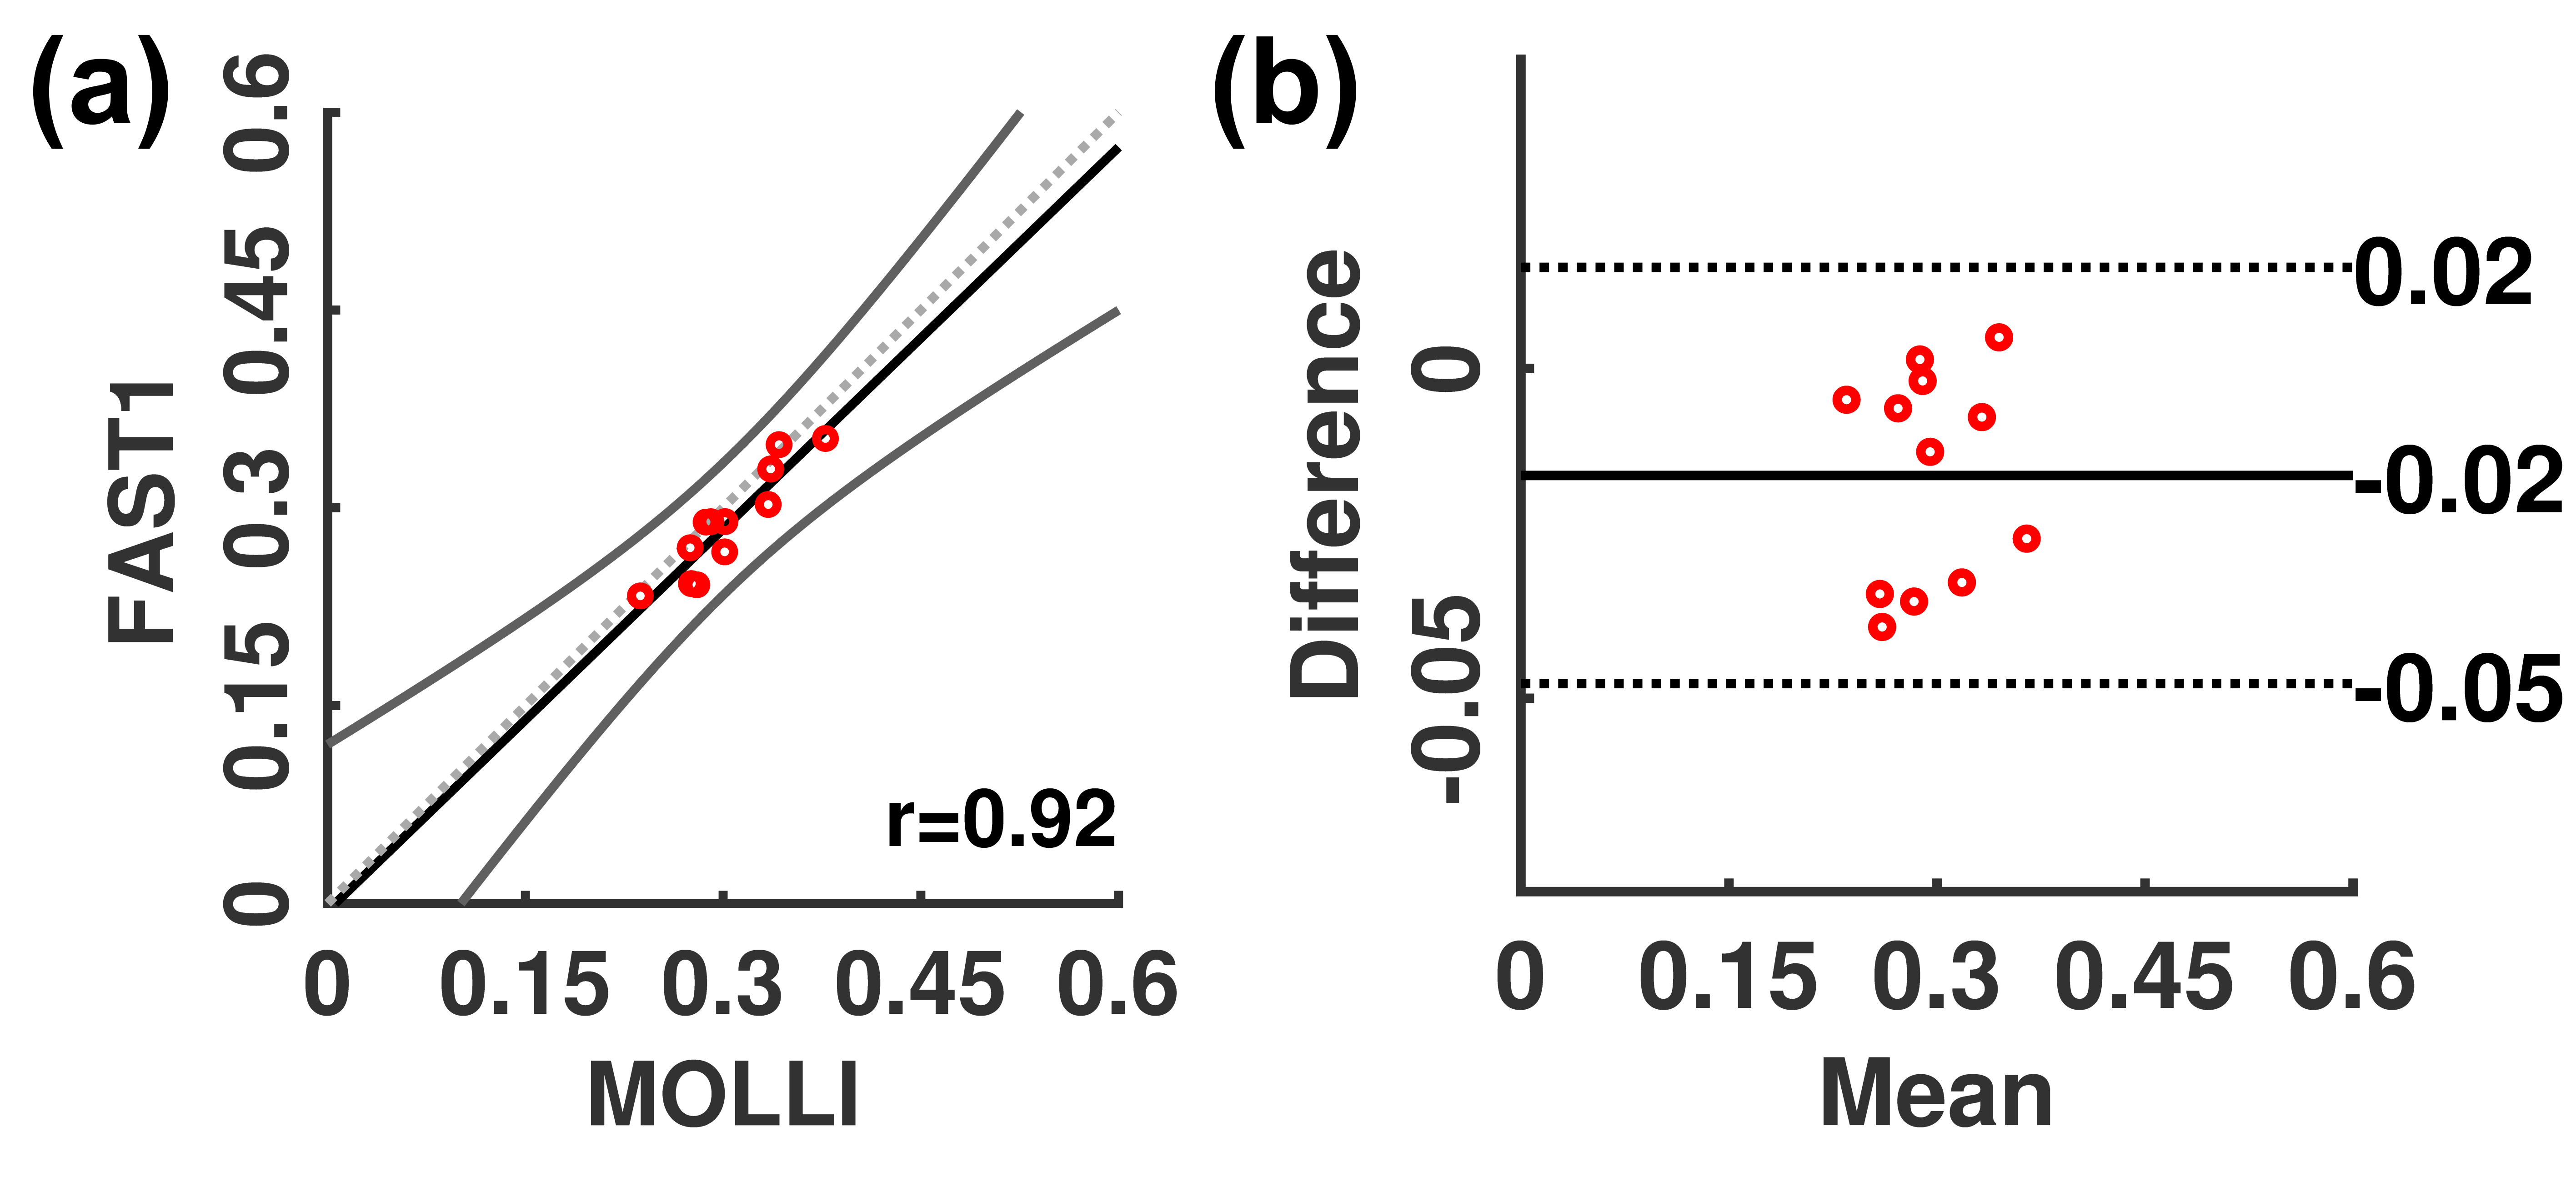
Fig. 4. Pearson correlation (a) and Bland-Altman (b) analyses of FAST1 and MOLLI ECV
measurements across all patients.