2078
Dark-blood Prepared T2* Cardiac MRI Based Assessment of Intramyocardial Hemorrhage in Patients with Reperfusion Acute MI at 1.5T1Cedars-Sinai Medical Center, Los Angeles, CA, United States, 2University of California, Los Angeles, Los Angeles, CA, United States, 3Radiology, Zhongshan Hospital, Fudan University, Shanghai, China, 4Medical Imaging, Shanghai Medical School, Shanghai Institute of Medical Imaging, Shanghai, China
Synopsis
Double inversion recovery preparation is often used in T2* cardiac MRI to acquire dark-blood images. We investigated the impact of dark-blood preparation on imaging of intramyocardial hemorrhage in patients with acute MI at 1.5T. SNR and CNR were compared between dark-blood and bright-blood T2* weighted images. Hemorrhage size, T2* were evaluated and compared between methods. Inter-observer reliability were reported as intraclass correlation coefficients. Our findings here support the notion that when choosing between bright-blood and dark-blood T2* cardiac MRI for the determination of intramyocardial hemorrhage in patients at 1.5T, bright-blood T2* cardiac MRI is likely the preferred approach.
Introduction
Double inversion recovery (DIR) preparation is often used in T2* cardiac MRI to acquire dark-blood (DB) images. This magnetization preparation approach, which suppresses the blood signal through DIR preparation, has been proven to be beneficial for evaluating iron overload in Thalassemia patients since dark-blood images provide a clearer border definition between the blood pool and the myocardium [1]. For similar reasons, DIR prepared dark-blood T2* cardiac MRI has been utilized for imaging intramyocardial hemorrhage as well. However, previous studies from our group using large animal models at 3T has showed that contrast-to-noise ratio for identifying intramyocardial hemorrhage is significantly reduced in dark-blood T2* images compared to bright-blood T2* images [2]. In this study, we investigated whether the dark-blood preparation compromises the diagnostic capacity to detect intramyocardial hemorrhage in patients with acute MI at 1.5T.Methods
Following informed consent, patients (n=5) with first ST-elevated myocardial infarction (STEMI) who underwent successful percutaneous coronary intervention (PCI) were prospectively enrolled and studied within 10 days after PCI. ECG-triggered, breath-held T2* weighted bright-blood (BB) mGRE images (TE = 2.01, 3.83, 5.65, 7.47, 9.29, 11.11, 12.93, 14.75 ms), as well as slice-position-matched double-inversion-recovery (DIR) prepared dark-blood (DB) T2* weighted mGRE images (same TEs) and LGE images were acquired. Size of hemorrhage was estimated on both BB and DB T2* weighted images (TE=14.75 ms) using the mean-2SD criterion by two expert readers using CVI42. T2* values were measured from T2* maps which were generated by pixel-wise exponential fitting. Intraclass correlation coefficients (ICC) were calculated in SPSS. Signal-to-noise ratio (SNR) and contrast-to-noise ratio (CNR) were calculated as:$$SNR = \frac{SI_{myo}}{σ_{air}}$$
$$CNR = \frac{SI_{myo} - SI_{hemo}}{σ_{air}}$$
where SImyo is the signal intensity of remote myocardium, SIhemois the signal intensity of hemorrhage and σair is SD of background noise. Paired t-test was used to compare the two methods and the differences were considered significant if p<0.05.
Results
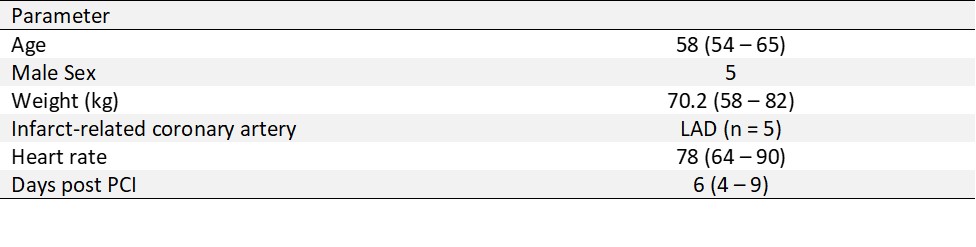
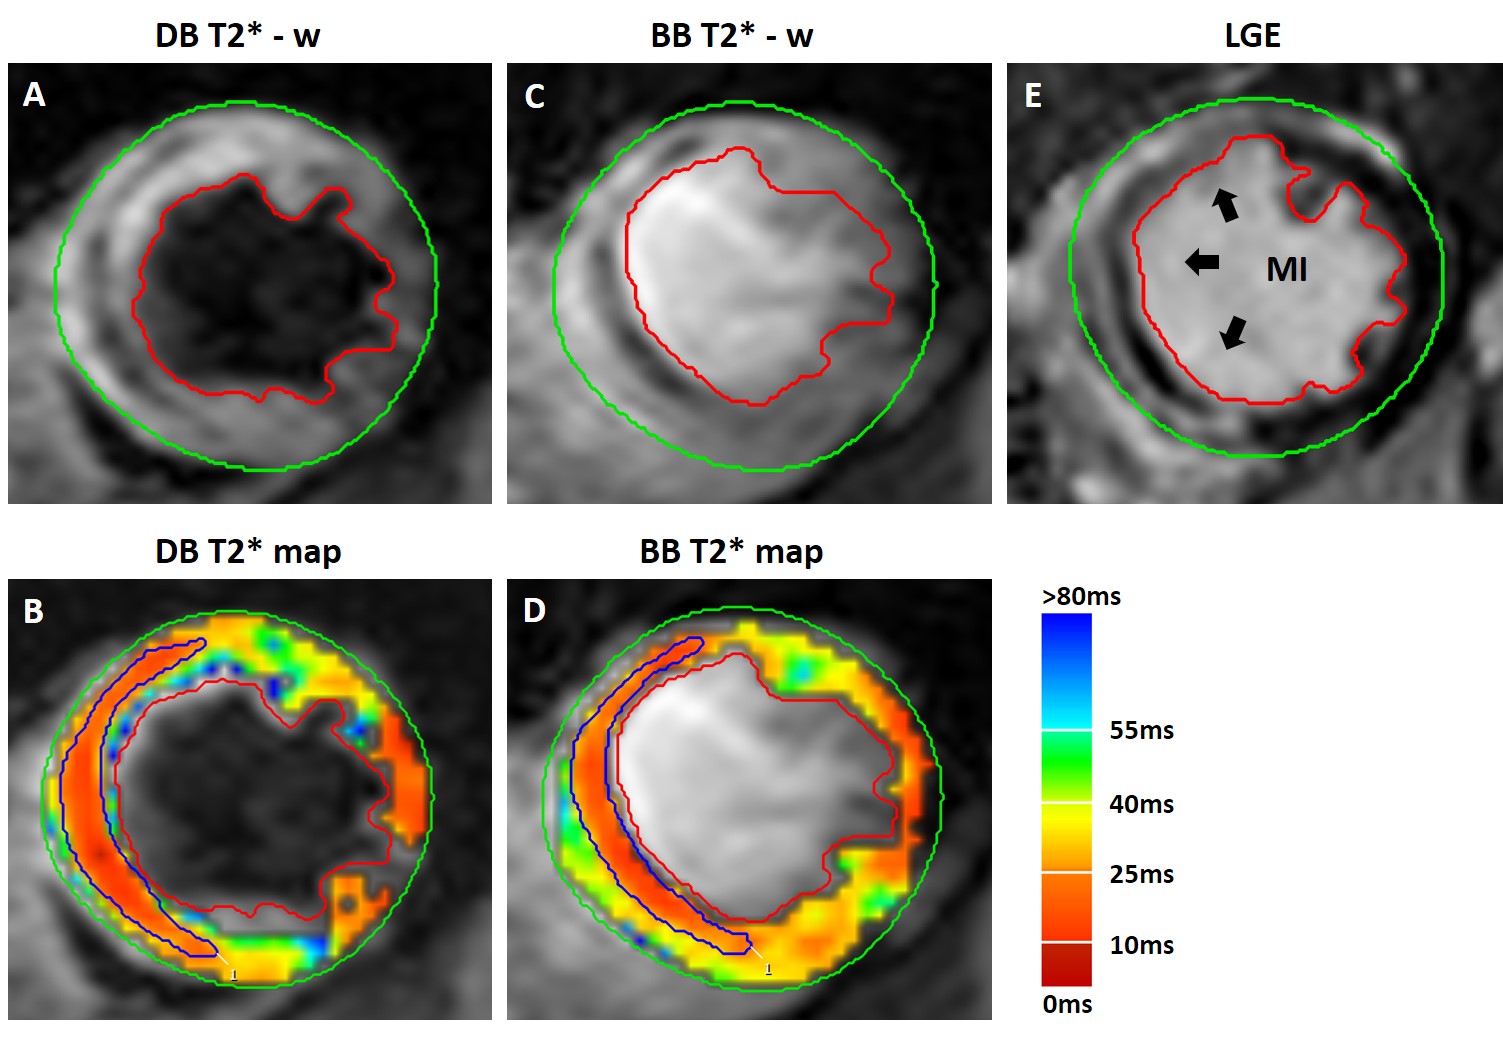
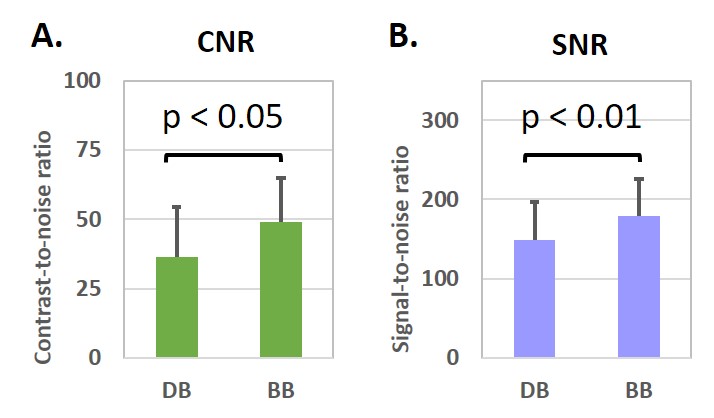
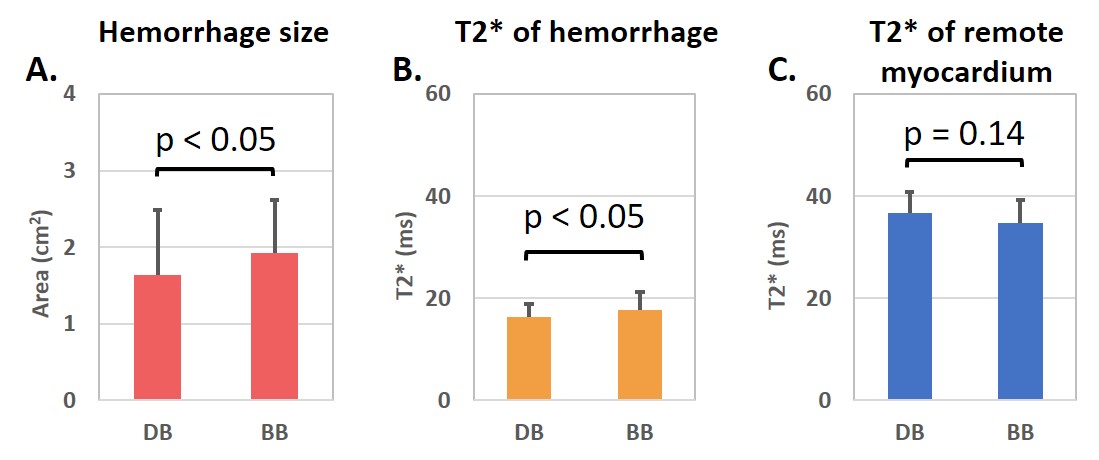
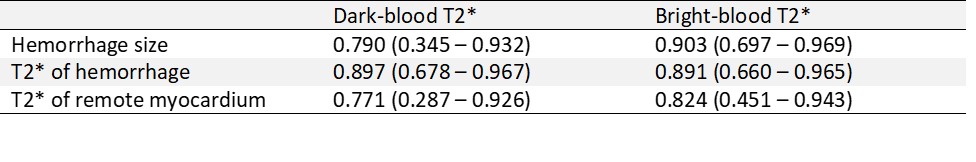
Table 1 details some of the key clinical features of patients with STEMI. Figure 1 shows a case example of a patient with hemorrhagic MI. Corresponding CNR and SNR measurements averaged across all patients is shown in Figure 2. Consistent with our past studies in animals, compared to bright-blood T2*-weighted images, dark-blood images T2*-weighted images provided lower CNR and SNR between hemorrhage and remote myocardium (CNR (between zone of hemorrhage and remote myocardium): 36.45 ± 18.05 (DB) vs 49.09 ± 15.83 (BB), p<0.05; SNR (remote myocardium): 149.04 ± 47.50 (DB) vs. 178.61 ± 47.75 (BB), p<0.01)).Mean size of hemorrhage measured from BB and DB imaging slices are reported in figure 3(A). The size and T2* of hemorrhage were lower on dark-blood images (1.64 ± 0.84 cm2 (size); 16.30 ± 2.66 ms (T2*) compared to that on bright-blood images (1.93 ± 0.69 cm2 (size); 17.69 ± 3.58 ms (T2*)). T2* of remote myocardium estimated using both methods were not statistically different (36.65 ± 4.26 ms (DB) vs 34.68 ± 4.49 ms (BB)). Intraclass correlation coefficients (ICC) with 95% confidence interval are shown in Table 2. ICC for hemorrhage size on dark-blood images (0.790) was markedly lower than that on bright-blood images (0.903), which suggests that bright-blood T2* images has greater reliability for identifying area of acute reperfusion hemorrhage.
Discussion
Double-inversion-recovery dark-blood preparation will reduce image contrast on T2* images when used for intramyocardial hemorrhage assessment in patients with acute MI at 1.5T. Our previous studies showed that that the source of CNR loss stems from the signal loss from double inversion and insufficient recovery time [3]. The loss of CNR and SNR can lead to underestimation of hemorrhage size on dark-blood T2* images compared to that on bright-blood T2* images and reduce inter-observer reliability of hemorrhage identification.Conclusion
Our early findings here support the notion that when choosing between bright-blood T2* and dark-blood T2* cardiac MRI for the determination of intramyocardial hemorrhage in patients at 1.5T, bright-blood T2* cardiac MRI appears to be the most desirable approach.Acknowledgements
No acknowledgement found.References
[1] G C Smith, J P Carpenter, T He, et al. Value of black blood T2* cardiovascular magnetic resonance. JCMR, 2011.
[2] X Guan, H Yang, G Wang, et al. T2* based detection of localized iron deposits in hemorrhagic myocardial infarction: the impact of dark-blood preparation on image contrast. SCMR abstract, 2019
[3] X Guan, X Zhang, J Sykes, et al. Image Contrast Loss in Double Inversion Recovery Dark-blood T2* CMR of Intramyocardial Hemorrhage. SCMR abstract, 2020.
Figures