2076
Arrhythmia Insensitive Rapid versus Modified Look Locker Inversion Recovery T1 mapping in mitral valve prolapse patients1Austin Health, Melbourne, Australia, 2The University of Melbourne, Melbourne, Australia, 3The Florey Institute of Neuroscience and Mental Health, Melbourne, Australia, 4Northwestern University, Evanston, IL, United States
Synopsis
We compare two cardiac T1 mapping techniques, arrhythmia insensitive rapid (AIR) which is a saturation recovery technique acquired in a short breath-hold and robust to arrhythmia, and Modified Look-Locker inversion recovery (MOLLI), in 55 patients with mitral valve prolapse. There was excellent inter-reader agreement in T1 values and extracellular volume (ECV) between techniques. However, higher T1 values were observed in AIR compared to MOLLI and vice versa for ECV, consistent with previous studies reporting significantly different T1 and ECV values between inversion recovery and saturation recovery techniques. These differences are important to consider when applying T1 mapping to clinical practice.
Introduction
Mitral valve prolapse (MVP) is found in 2% of the general population1. Some MVP patients may develop arrhythmias (8% prevalence of atrial fibrillation)2 or sudden death, and cardiac T1 mapping could prognosticate and identify substrates for arrhythmia3. Modified Look-Locker inversion recovery (MOLLI) T1 mapping is a well-established technique, but requires relatively long breath-holds, is sensitive to heart rate and rhythm, and is known to underestimate T1 values with high T1 or low T2 values4. Arrhythmia insensitive rapid (AIR) cardiac T1 mapping is a recently described saturation recovery technique that is insensitive to heart rate and rhythm and acquired over 2-3 hearbeats5. The primary purpose of the study was to assess the performance of AIR for T1 and extracellular volume fraction (ECV) quantification, with comparison to MOLLI in patients with MVP, where arrhythmias are not infrequently encountered. The secondary purpose was to assess inter-reader agreement.Methods
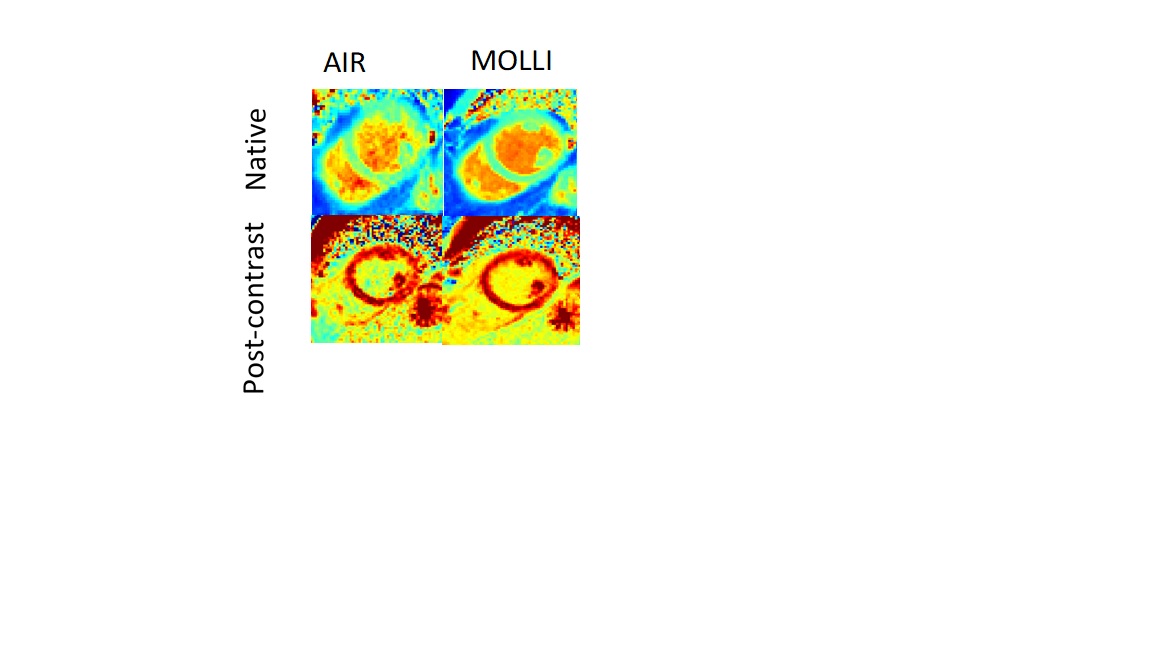
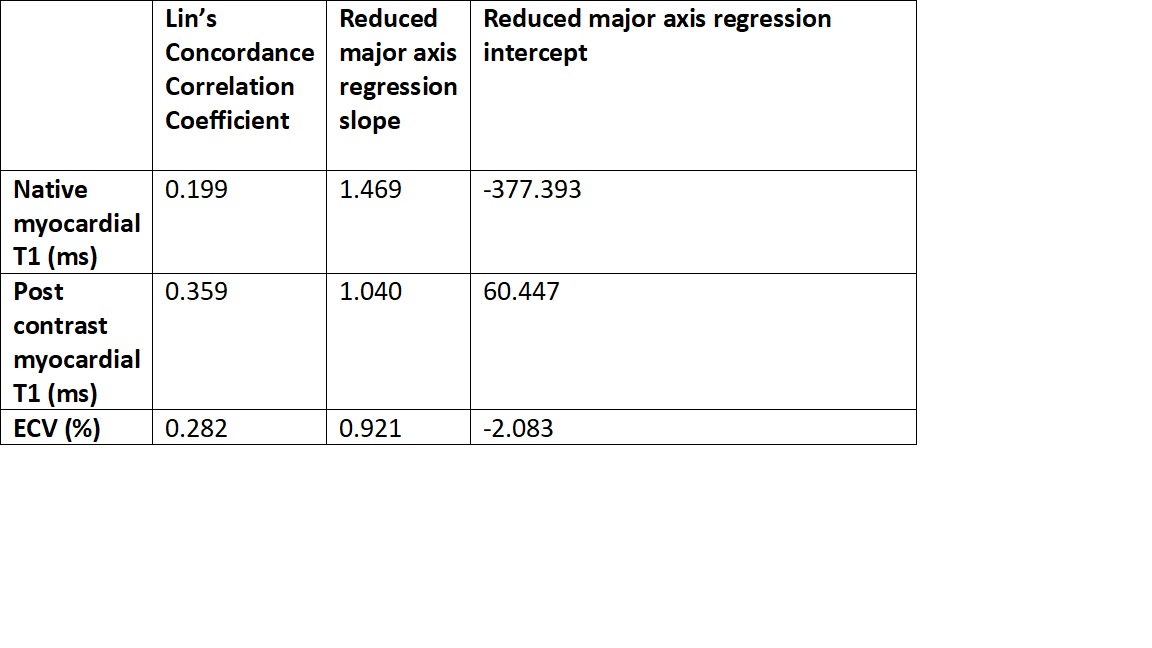
57 patients were recruited, however images were not obtained in 2 patients due to claustrophobia. 55 patients (24 F, 31 M, mean 59y, range 25-79y, mean heart rate 64 bpm) underwent AIR and MOLLI at 1.5-T (Avanto; Siemens Healthcare, Erlangen Germany). Mid-ventricular short axis AIR and MOLLI images were acquired pre-contrast and at 15 minutes after administration of 0.2 mmol/kg of gadoterate meglumine (Dotarem®, Aspen Pharmacare), Figure 1. TR/TE 2.4/1ms, matrix 192 x 144, FOV 360 x 270 mm for both sequences. AIR: FA 55°, BW 930 Hz/px, TA 2-3 heartbeats (2 single shot images); MOLLI: FA 35°, BW 965 Hz/px, TA 11 heartbeats 5(3)3 protocol6. Native and post contrast myocardial and blood T1 values were measured on T1 MOLLI/AIR maps by 2 independent readers using customized software in MATLAB (Mathworks, Natick, USA). Haemoglobin was measured in each patient on the day of scanning for ECV calculation. Lin’s concordance correlation coefficient (LCC) and reduced major axis regression (which evaluates for fixed and proportional bias separately, unlike Bland-Altman analysis) were used to assess inter-reader agreement and to compare derived T1 and ECV7.Results
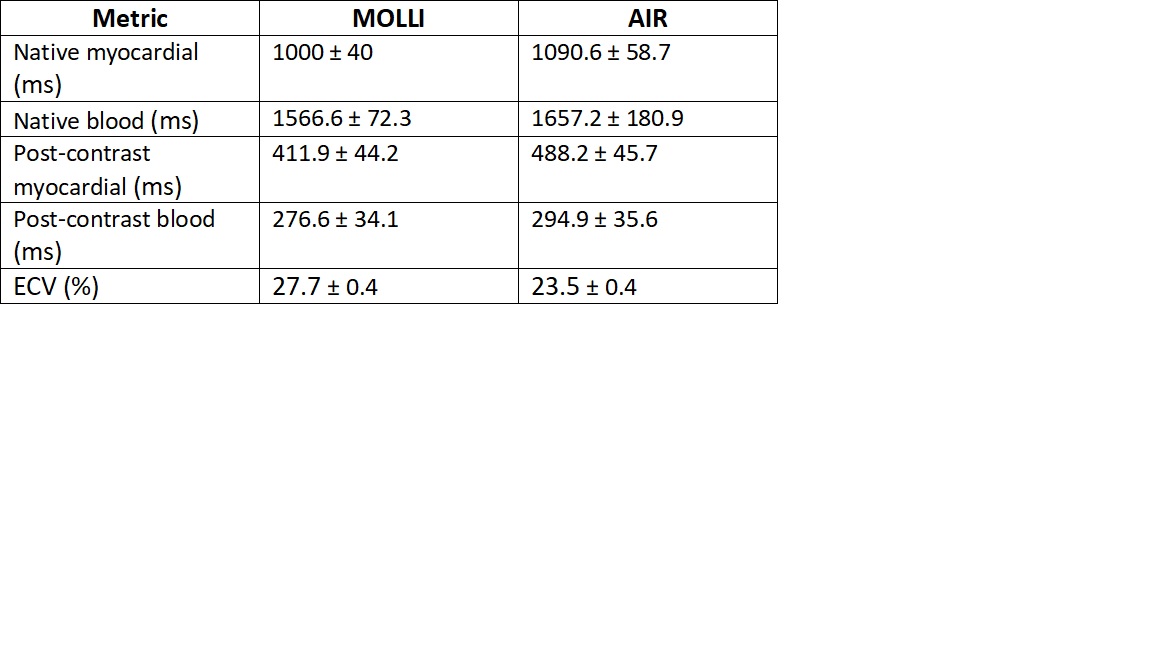
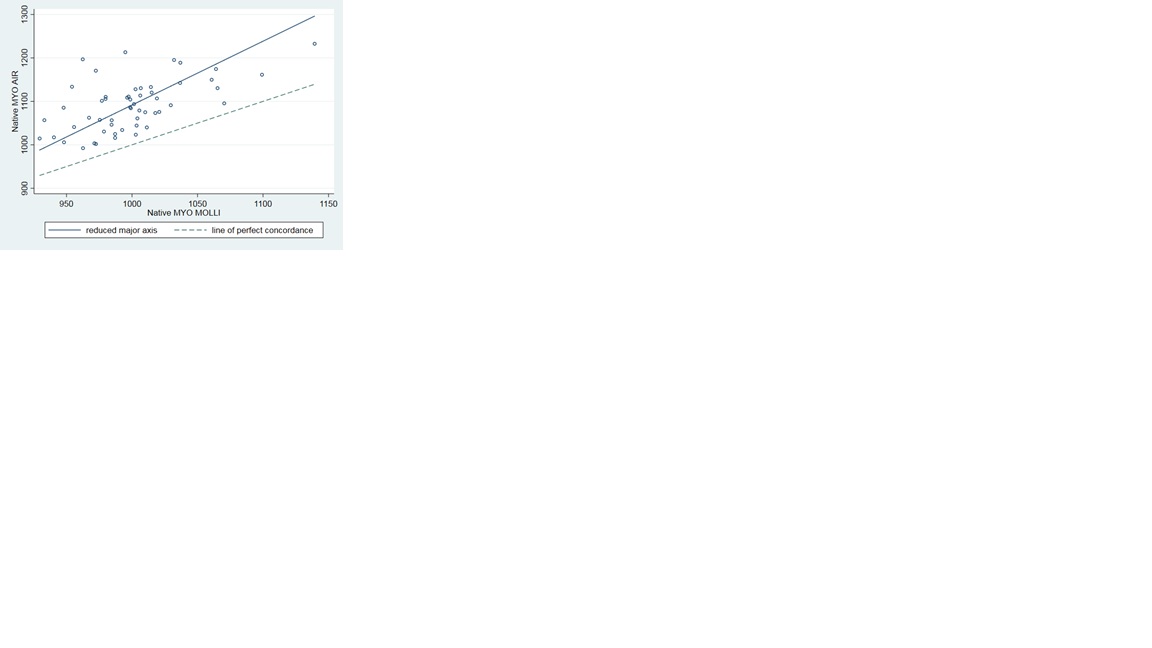
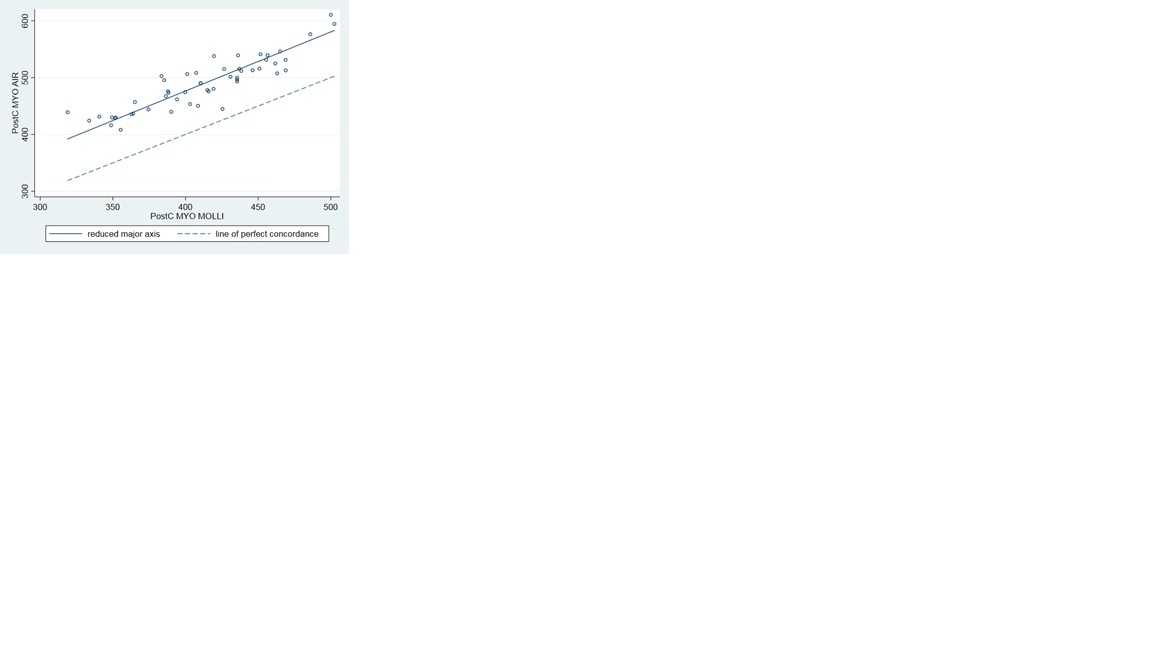
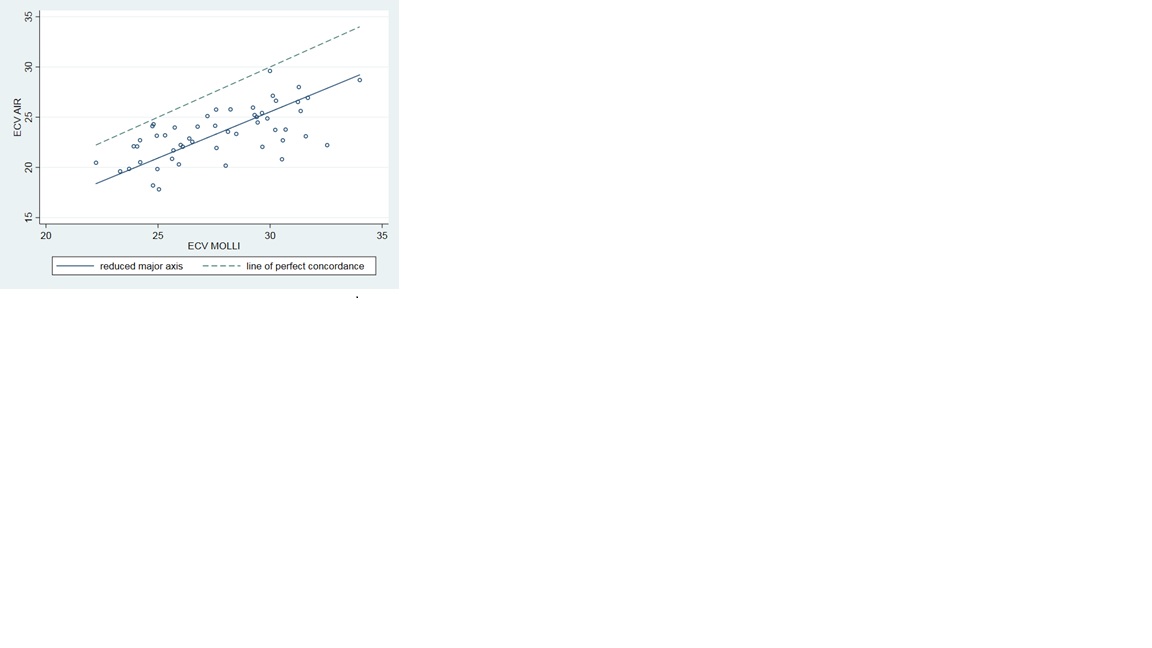
52/55 patients completed native and post contrast examinations. 3 patients underwent native T1 mapping only due to logistical reasons. 4 patients were in atrial fibrillation, with 51 patients in sinus rhythm. Mean results are presented in Table 1. There was almost perfect inter-reader agreement for myocardial T1 and ECV for both techniques (LCC > 0.96 for AIR and >0.94 for MOLLI, p<0.001 all comparisons). Higher T1 values and lower ECV were observed for AIR compared to MOLLI, with only slight agreement between native myocardial T1 values, with differences increasing at larger T1 values (Table 2 and Figure 2(a)). There was fair agreement of AIR and MOLLI for post contrast T1 myocardial values (higher for AIR) and ECV (lower for AIR) as shown in Table 2, Figures 2(b) and 2(c). Unfortunately, subpopulation analysis for patients with arrhythmia could not be done due to the low prevalence in our study.Discussion
In our experience, MOLLI returned lower T1 values and higher ECV than AIR, with differences more prominent at higher T1 values, consistent with the prior literature4. Compared with AIR, MOLLI produces less accurate results, which for MOLLI is influenced by several factors including T2-dependence8, magnetization transfer effect9, inversion pulse efficiency and arrhythmia10. Compared with AIR, MOLLI produces higher precision since it acquires 11 images and inversion recovery provides a wider range of data fitting than saturation recovery. There was near perfect inter-reader agreement for both techniques.In our patient group for MOLLI, we found slightly higher native T1 (1000 ± 40 vs 950 ± 21 ms ) and higher ECV (27.7 ± 0.4 % vs 25 ± 4 %) compared to a prior healthy volunteer study11. This may reflect differences in acquisition technique, or differences in patients with MVP.
Limitations in our study include a small sample size and lack of a gold standard for comparison. Furthermore, we were unable to determine the effect of arrhythmia on T1 values and ECV due to the low prevalence in our patients.
Conclusion
AIR and MOLLI-derived T1 and ECV values both have high inter-reader agreement in MVP patients. Higher T1 values and lower ECV for AIR compared with MOLLI is consistent with prior literature in healthy volunteers, thought to reflect lower accuracy of MOLLI. This highlights the need for a consistent T1 mapping technique when monitoring patients over time. AIR may be preferable in patients populations with a relatively high prevalence of arrhythmia, allowing for more patients to be successfully scanned. However, a larger study is required to assess technique performance in patients with arrhythmia.Acknowledgements
The authors thank Austin Health's radiography team for scanning the patientsReferences
1. Hayek E, Gring CN, Griffin BP. Mitral valve prolapse. The Lancet. 2005;365(9458):507-18.
2. Sutton MSJ, Weyman AE. Mitral Valve Prolapse Prevalence and Complications. Circulation. 2002;106(11):1305-7.
3. Basso C, Iliceto S, Thiene G, Perazzolo Marra M. Mitral Valve Prolapse, Ventricular Arrhythmias, and Sudden Death. Circulation. 2019;140(11):952-64.
4. Roujol S, Weingartner S, Foppa M, Chow K, Kawaji K, Ngo LH, et al. Accuracy, precision, and reproducibility of four T1 mapping sequences: a head-to-head comparison of MOLLI, ShMOLLI, SASHA, and SAPPHIRE. Radiology. 2014;272(3):683-9.
5. Fitts M, Breton E, Kholmovski EG, Dosdall DJ, Vijayakumar S, Hong KP, et al. Arrhythmia insensitive rapid cardiac T1 mapping pulse sequence. Magn Reson Med. 2013;70(5):1274-82.
6. Kellman P, Wilson JR, Xue H, Ugander M, Arai AE. Extracellular volume fraction mapping in the myocardium, part 1: evaluation of an automated method. J Cardiovasc Magn Reson. 2012;14(1):63.
7. Ludbrook J. Linear regression analysis for comparing two measurers or methods of measurement: but which regression? Clin Exp Pharmacol Physiol. 2010;37(7):692-9.
8. Chow K, Flewitt J, Pagano JJ, Green JD, Friedrich MG, Thompson RB. T(2)-dependent errors in MOLLI T(1) values: simulations, phantoms, and in-vivo studies. J Cardiovasc Magn Reson. 2012;14(Suppl 1):P281-P.
9. Robson MD, Piechnik SK, Tunnicliffe EM, Neubauer S. T1 measurements in the human myocardium: the effects of magnetization transfer on the SASHA and MOLLI sequences. Magn Reson Med. 2013;70(3):664-70.
10. Gai ND, Stehning C, Nacif M, Bluemke DA. Modified Look-Locker T1 evaluation using Bloch simulations: human and phantom validation. Magnetic resonance in medicine. 2013;69(2):329-36.
11. Dabir D, Child N, Kalra A, Rogers T, Gebker R, Jabbour A, et al. Reference values for healthy human myocardium using a T1 mapping methodology: results from the International T1 Multicenter cardiovascular magnetic resonance study. J Cardiovasc Magn Reson. 2014;16:69.
Figures