2075
Right ventricular T1-mapping in boys with Duchenne muscular dystrophy and healthy controls at 3T1Department of Radiology, Stanford University, Palo Alto, CA, United States, 2Department of Cardiothoracic Surgery, Stanford University, Palo Alto, CA, United States, 3Physics and Biology in Medicine Interdepartmental Program, University of California, Los Angeles, CA, United States, 4Department of Radiological Sciences, University of California, Los Angeles, CA, United States, 5Department of Bioengineering, University of California, Los Angeles, CA, United States, 6Department of Pediatrics, Stanford University, Palo Alto, CA, United States, 7Department of Pediatrics, University of California, Los Angeles, CA, United States, 8Maternal & Child Health Research Insitute, Palo Alto, CA, United States, 9Cardiovascular Insitute, Stanford University, Palo Alto, CA, United States
Synopsis
Early diagnosis of cardiac involvement in boys with Duchenne muscular dystrophy (DMD) allows for timely therapy. The aim of this study was to assess the association between native T1 in the right ventricle (RV) and cardiac involvement as marked by decreased left ventricular (LV) or RV ejection fraction (EF). Healthy boys (N=10) and boys with DMD (N=16) underwent 3T cardiac MR using motion-corrected gradient-MOLLI T1-mapping, a clinically routine protocol. RV-T1 did not correlate with LVEF or RVEF. Longer native LV-T1 was associated with lower LVEF. Based on this data, native RV-T1 does not provide insight to cardiac involvement in DMD.
Introduction
Duchenne muscular dystrophy (DMD) is a genetic muscle disorder associated with degeneration of muscle leading to a progressive decline in heart function by early adulthood. Heart failure is the most common cause of death for boys with DMD.1 Early diagnosis of cardiac involvement allows for prompt initiation of anti-congestive and other DMD appropriate drug therapy.1Cardiovascular magnetic resonance (CMR) imaging is an important tool in the clinical management of DMD to detect structural and functional changes.1 Both the presence of late gadolinium enhancement (LGE) and declining ejection fraction (EF) are used as clinical biomarkers, but are relatively late outcomes. Alternatively, myocardial T1 mapping offers a quantitative, non-invasive method for measurement of diffuse fibrosis that may offer earlier insight into myocardial involvement in DMD. Currently, CMR imaging in DMD focuses on the left ventricle (LV). However, there is pre-clinical evidence that right ventricular (RV) fibrosis may precede a decrease in LVEF.2 However, RV myocardial native T1 (RV-T1) remains unstudied in boys with DMD.
The aim of this study was to assess the association between native RV-T1 and cardiac involvement of DMD, marked by decreases LVEF or RVEF.
Methods
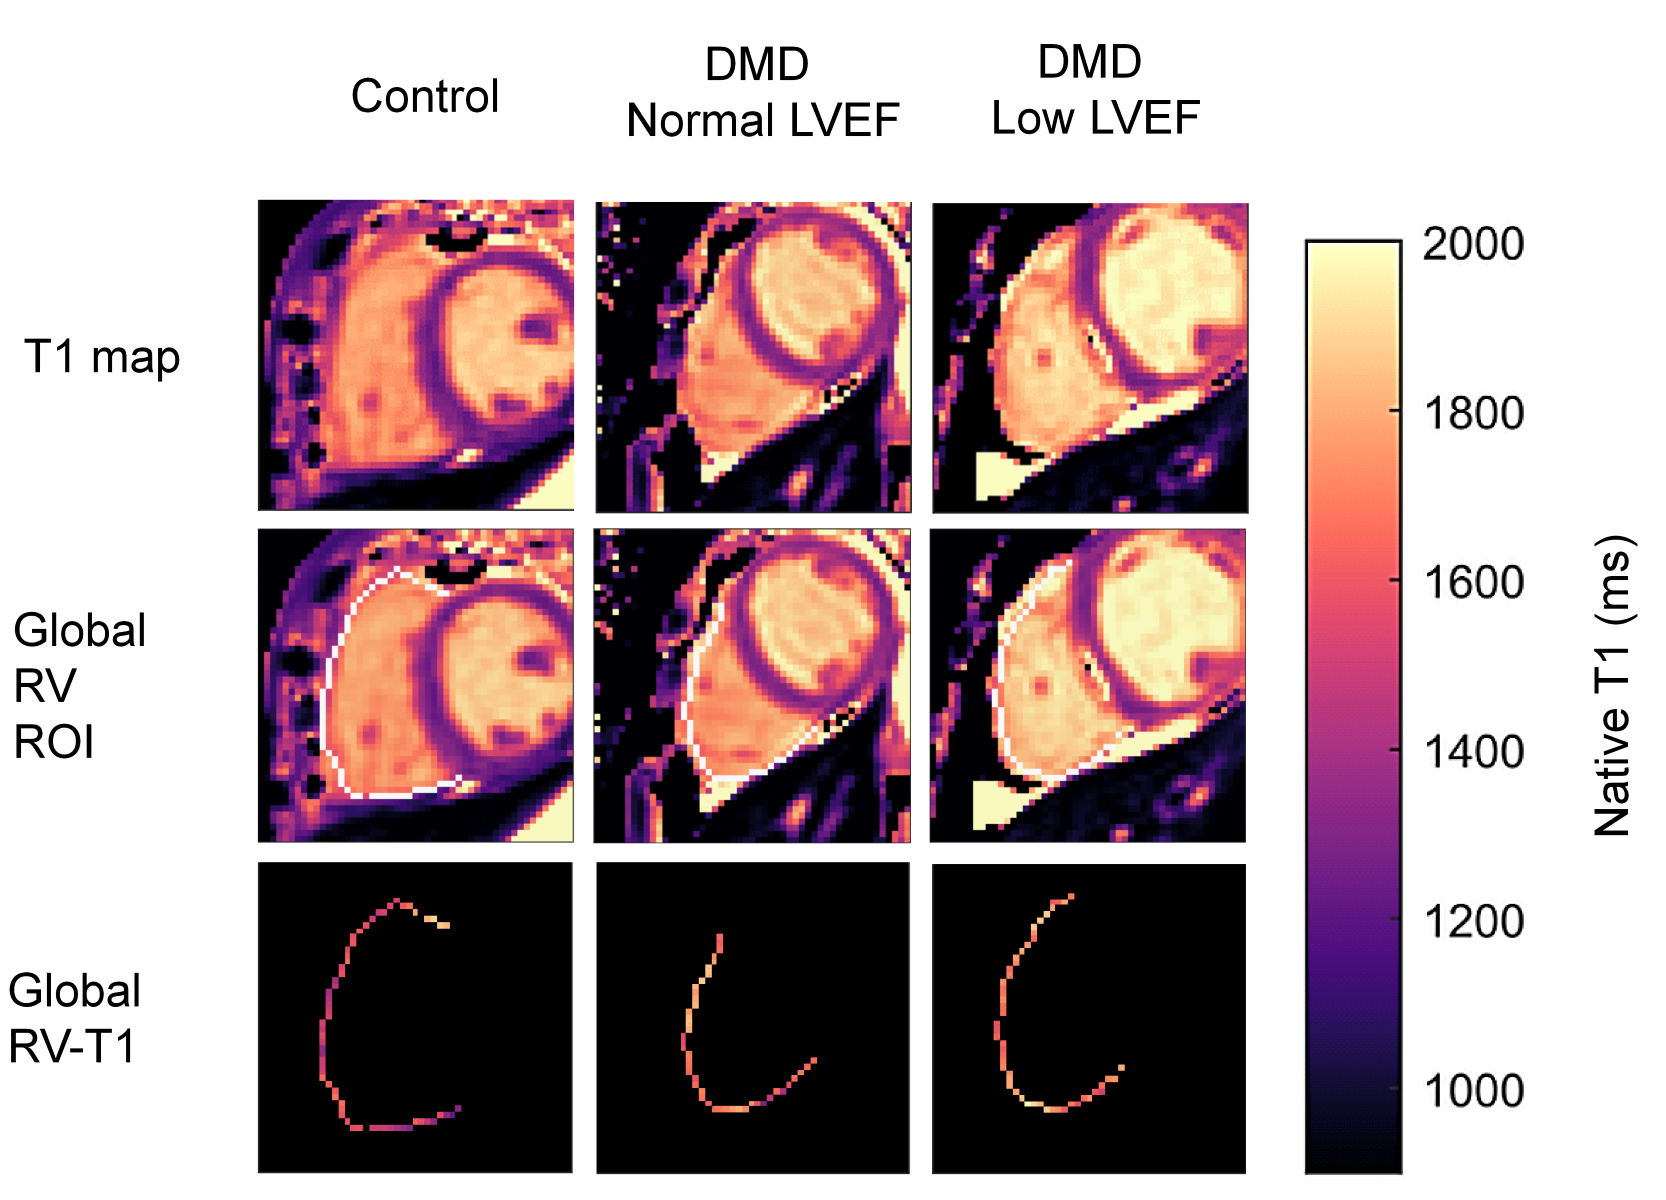
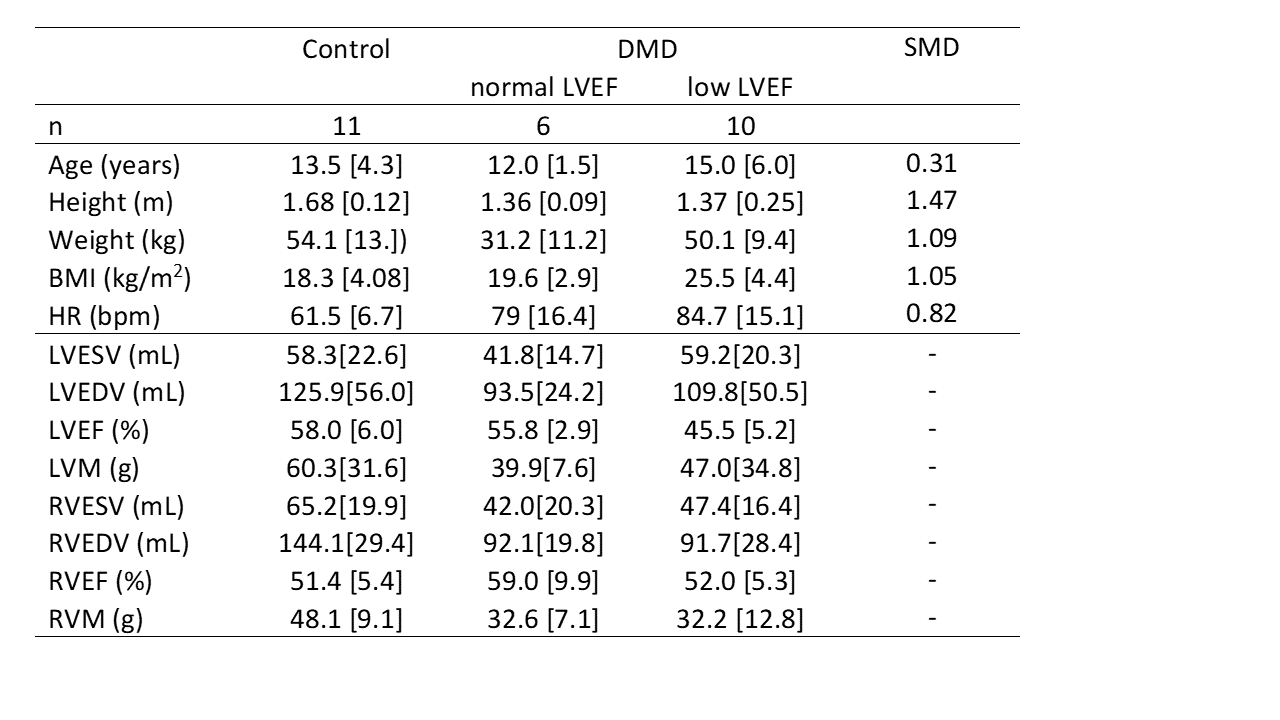
Boys with DMD (N=16) and age-matched healthy controls (N=10) were prospectively enrolled for a CMR exam at 3T (Skyra, Siemens) (Table 1). The study was approved by the IRB and parental permission and assent was obtained from all subjects. The subjects were chosen from a larger study cohort, 16/28 of DMD boys and 10/16 of healthy controls, based on acceptable RV visibility in native T1 maps. The CMR exam included standard functional imaging using free-breathing retrospectively binned balanced steady state free precession (bSSFP).3 Native T1 maps were acquired in a single mid-ventricular short-axis slice with motion-corrected gradient-echo MOLLI (5-3-3) (20° flip angle, 192x132 matrix, 1.9mm x 1.9mm pixels, slice thickness 8mm, bandwidth 1085Hz/Px, TE/TR=1.01ms/2.44ms, acquisition window duration of 168.3ms, initial inversion time 100ms with 80ms increments).4Volumetry was performed by two expert clinicians using clinical software (Circle Cardiovascular Imaging Inc. or Medis Cardiovascular Imaging). The threshold to distinguish normal from low cardiac function was defined as LVEF≥55%5 and RVEF≥47%.6 Native LV-T1 was evaluated for the global LV myocardium (including the septum) and in a segment of the lateral LV wall. Native RV-T1 were evaluated using a 1D region of interest (ROI) of the entire circumference of the RV (Figure 1). The resulting ROI size as well as median values of T1 were compared between the ROIs.
Group-wise comparison was performed using a linear regression t-test. All data is reported as median [interquartile range]. P < 0.05 was considered significant.
Results
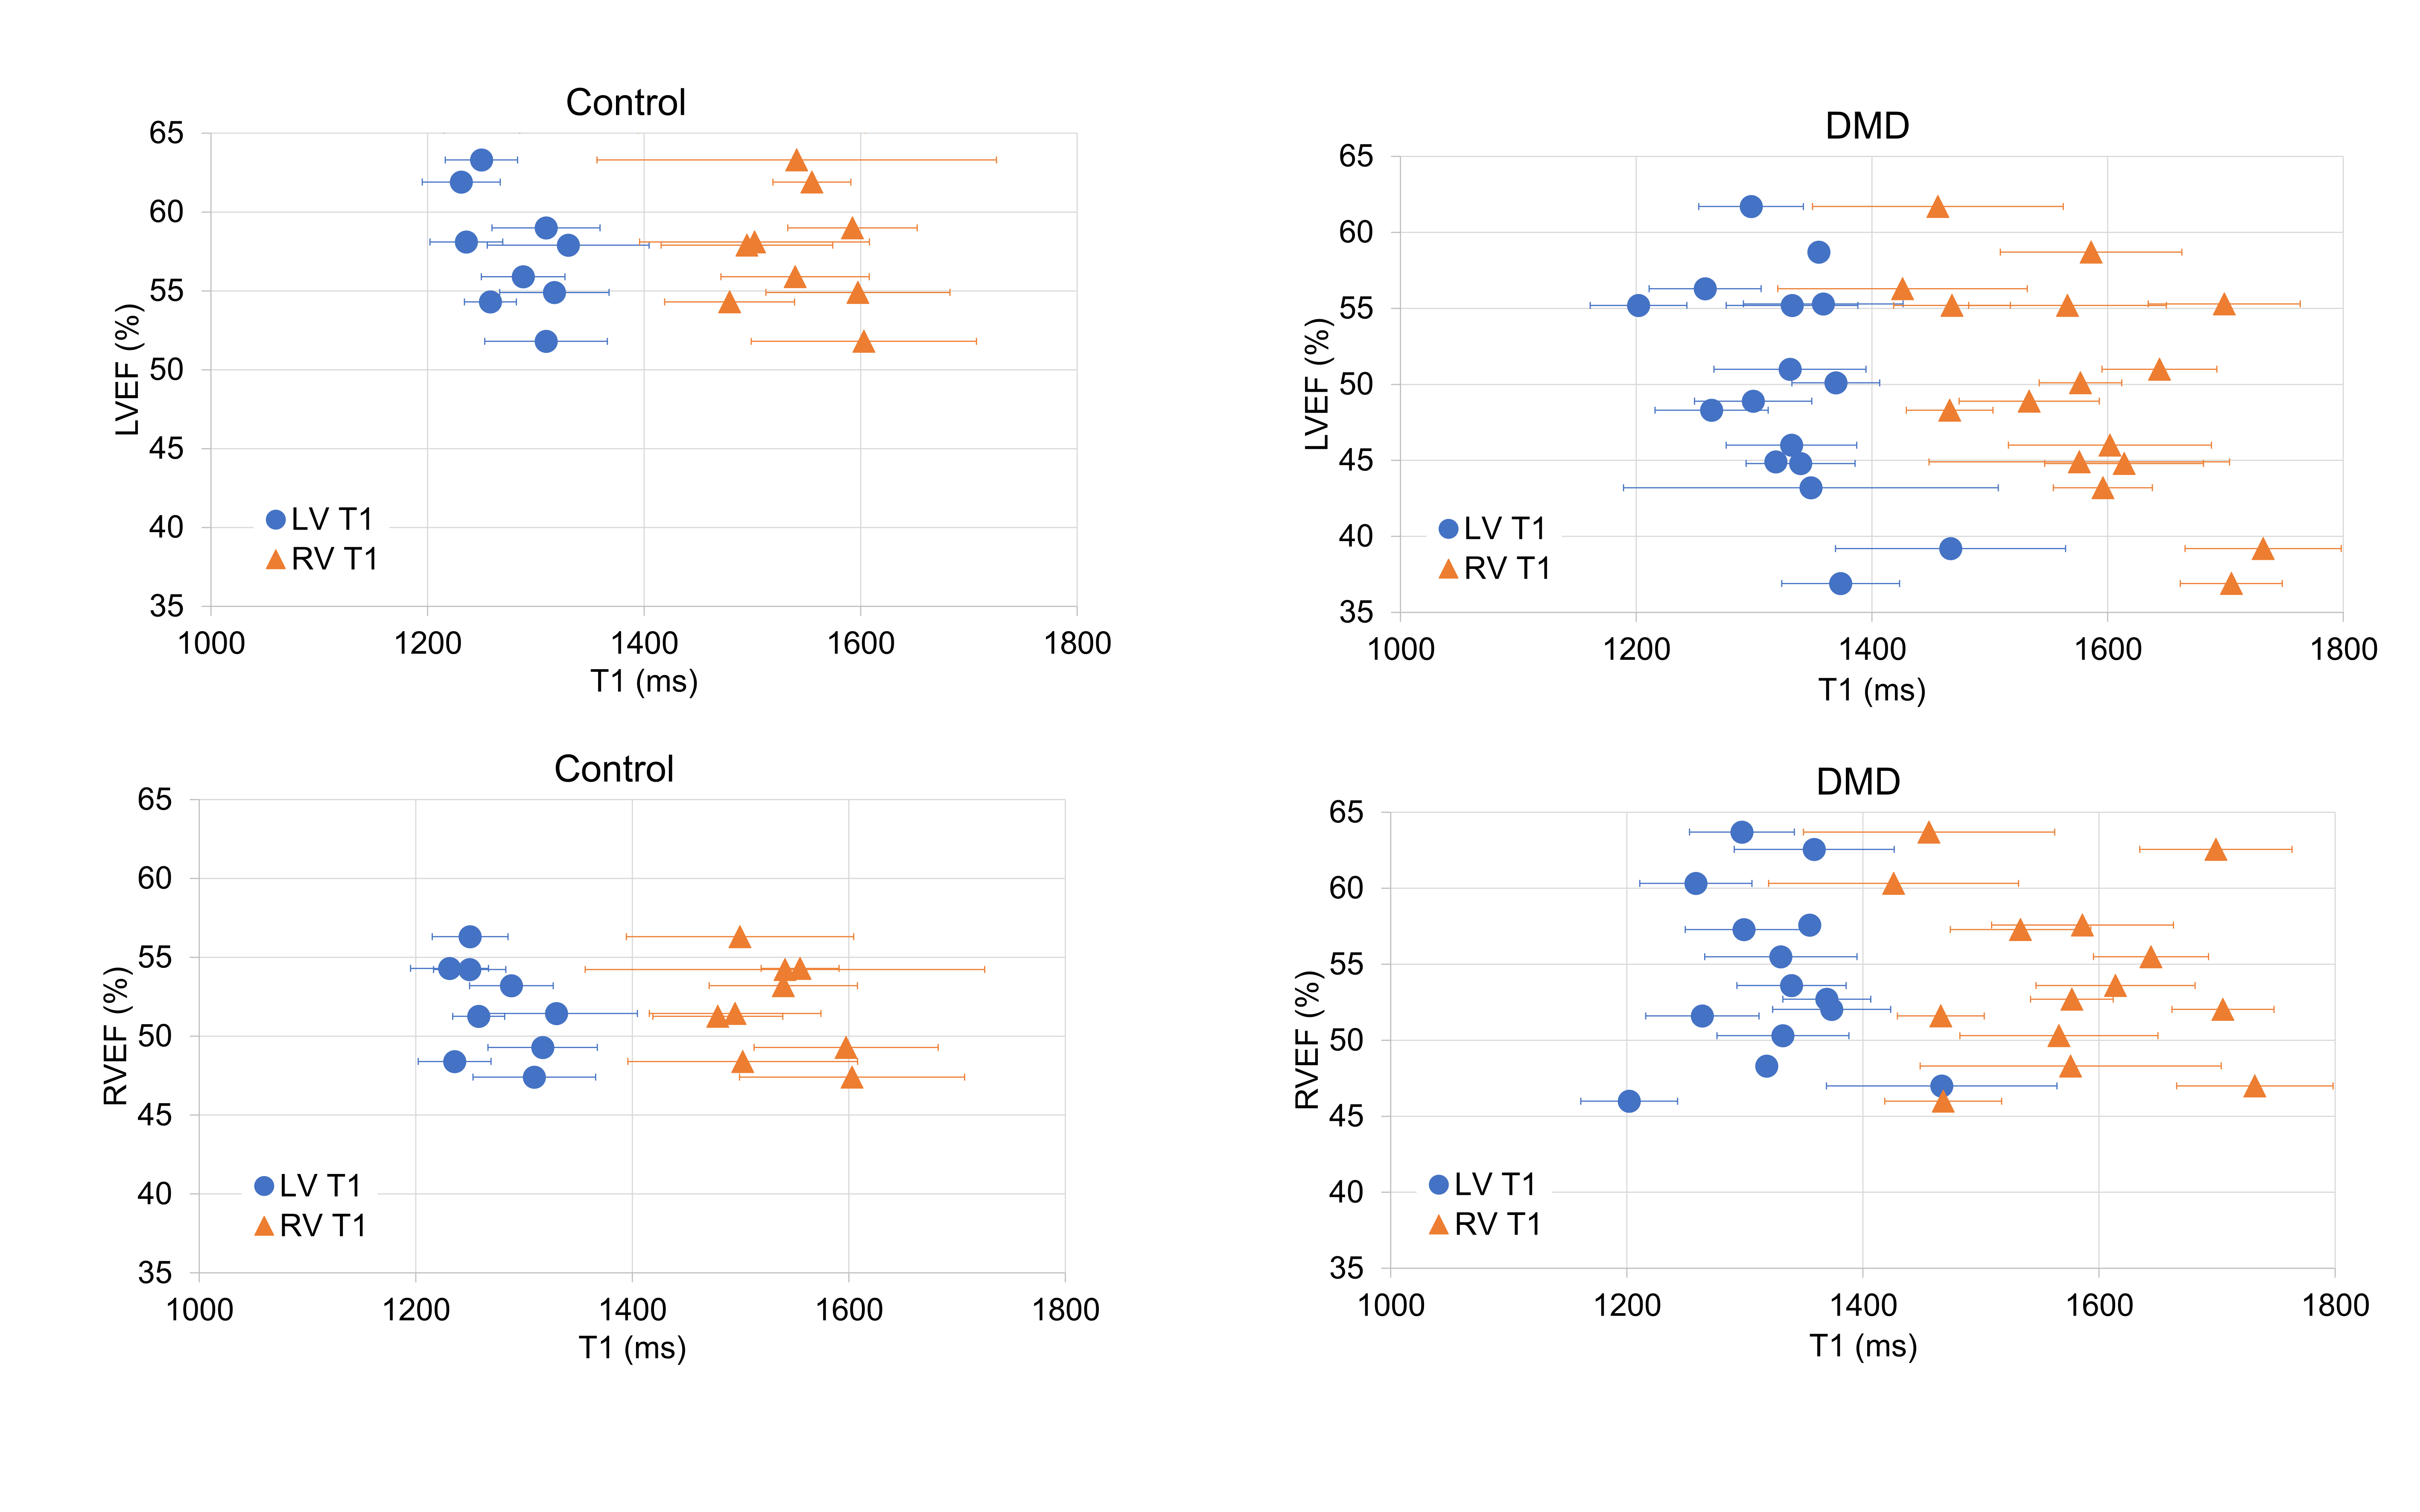
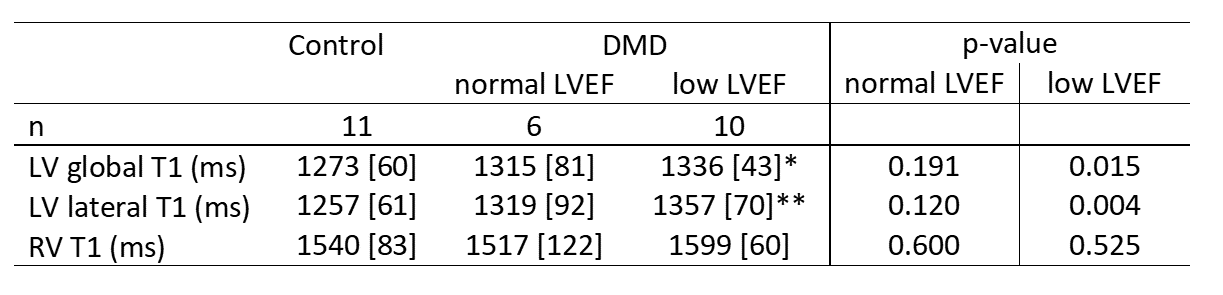
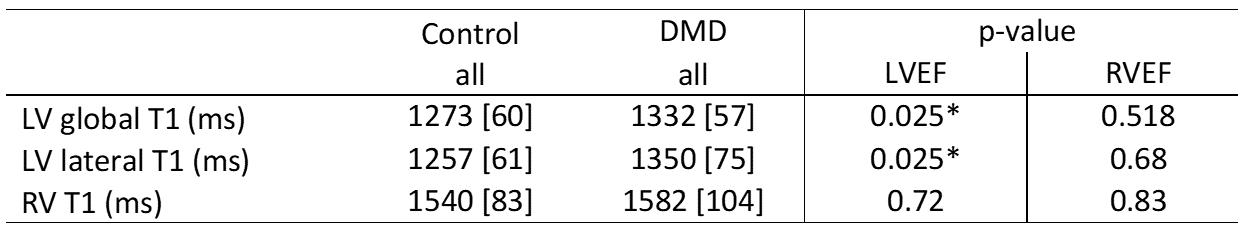
Within the DMD group, 33% had normal LVEF and RVEF; 53% had low LVEF, but normal RVEF; and 14% had low RVEF, of which 7% also had low LVEF. Native RV-T1 was higher than global and lateral native LV-T1 (1571[101]ms vs. 1307[93] vs. 1313[78]). No difference in RV-T1 was found in boys with low LVEF compared to healthy controls (1599[60] ms vs. 1540[83] ms) (Table 2). Native LV-T1 was significantly elevated in DMD boys with low LVEF, compared to healthy controls in global LV (1336[43] ms vs. 1273 [60] ms, p = 0.015) and lateral LV (1357[70] vs. 1256[61], p = 0.004 (Table 2). Global and lateral native LV-T1 were correlated with LVEF, but not with RVEF (Table 3, Figure 2).Discussion
To our knowledge, this is the first report of measuring native RV-T1 in boys with DMD and age-matched healthy controls. The reported values help to establish reference values for these cohorts. While elevated native LV-T1 appears to be associated with declining LVEF in boys with DMD, we did not identify any such relationship with RV-T1. The lack of any such relationship might be due to more aggressive cardiac involvement of the LV compared to the RV as is typically seen in DMD. Delayed onset of fibrosis in the RV may also underlie this observation.Alternatively, the lack of any association between RV-T1 and cardiac involvement may be due to a number of technical factors resulting in high variability in RV-T1 and RVEF analysis. The standard clinical spatial resolution, the small number of subjects, and the thin wall of the RV limit the interpretation of our findings. We measured RV-T1 in a single slice for the evaluation of the T1 values. In the thinner parts of the RV, the partial volume effect likely elevates the measured values and their heterogeneity in this study setting. Indeed, the interquartile ranges of RV-T1 are above previously reported values for LV-T1.7 The apparently elevated RV-T1 values compared to the LV-T1 in both healthy boys and boys with DMD might also be due to the naturally higher collagen content of the RV.8
Higher spatial resolution and more slices might be necessary to measure RV-T1 accurately. Alternatively, a combination of pre- and post-contrast T1 could provide a stronger sensitivity to fibrosis in the RV wall.
Conclusion
Using a standard clinical T1-mapping protocol to measure native RV-T1, we found no association between native RV-T1 values and ejection fractions of DMD. Longer native LV-T1 values, however, were associated with a reduced LVEF.Acknowledgements
This project was supported, in part, by NIH R01 HL131975 to DBE. We thank Jaden Yang for support with the statistical analysis.References
[1] Fayssoil A, Abasse S, Silverston K. Cardiac Involvement Classification and Therapeutic Management in Patients with Duchenne Muscular Dystrophy. J Neuromuscul Dis 2017;4:17–23.
[2] Meyers TA, Townsend D. Early right ventricular fibrosis and reduction in biventricular cardiac reserve in the dystrophin-deficient mdx heart. Am J Physiol - Hear Circ Physiol 2015;308:H303–15.
[3] Kellman P, Chefd’hotel C, Lorenz CH, Mancini C, Arai AE, McVeigh ER. High spatial and temporal resolution cardiac cine MRI from retrospective reconstruction of data acquired in real time using motion correction and resorting. Magn Reson Med 2009;62:1557–64.
[4] Messroghli DR, Radjenovic A, Kozerke S, Higgins D, Sivananthan M, Ridgway J. Modified Look-Locker inversion recovery (MOLLI) for high-resolution T1 mapping of the heart. Magn Reson Med 2004;52.
[5] Pfeffer MA, Shah Amil M, Borlaug BA. Heart Failure With Preserved Ejection Fraction In Perspective. Circ Res 2019;124:1598–617.
[6] Konstam MA, Kiernan MS, Bernstein D, Bozkurt B, Jacob M, Kapur NK, et al. Evaluation and Management of Right-Sided Heart Failure: A Scientific Statement From the American Heart Association. Circulation 2018;137.
[7] Chow K, Flewitt JA, Green JD, Pagano JJ, Friedrich MG, Thompson RB. Saturation recovery single-shot acquisition (SASHA) for myocardial T 1 mapping. Magn Reson Med 2014;71:2082–95.
[8] Freed BH, Collins JD, François CJ, Barker AJ, Cuttica MJ, Chesler NC, et al. MR and CT Imaging for the Evaluation of Pulmonary Hypertension. 2016.
Figures