2064
Dynamic changes of tissue characteristics by T1 and T2 mapping in patients with peripartum cardiomyopathy1Department of Cardiology, Beijing Hospital, Beijing, China, 2Department of Cardiology, West China Hospital, Chengdu, China, 3Siemens Shenzhen Magnetic Resonance Ltd, Shenzhen, China
Synopsis
This study aimed to demonstrate the dynamic changes of tissue characteristics in patients with peripartum cardiomyopathy (PPCM). Cardiovascular magnetic resonance (CMR) examination was performed using a 3.0T MR scanner, consisted of a MOLLI sequence for T1 mapping, and a T2 prep with bSSFP for T2 mapping. Ten PPCM patients with repeated CMR and 20 healthy age-matched females were analyzed. After a median 15.3-month follow-up, five patients had a recovered left ventricular ejection fraction. PPCM patients showed significantly higher native T1, extracellular volume, and T2 than normal controls. Furthermore, native T1 decreases significantly in the follow-up CMR of PPCM patients.
Background and propose
Peripartum cardiomyopathy (PPCM) is rare and potentially life-threatening1. Imaging characteristics on cardiovascular magnetic resonance (CMR) and the dynamic changes of tissue characterization have rarely been studied. We therefore aimed to explore the dynamic changes of tissue characterization in PPCM by using T1 and T2 mapping techniques.Methods
Ten PPCM patients and 20 healthy age-matched females from our CMR registry database were analyzed. The onset times for abnormalities ranged from the last month of pregnancy up to 5 months postpartum and fit into the strict criteria of PPCM established by the European Society of Cardiology2. All subjects underwent comprehensive contrast-enhanced CMR including standardized clinical protocol3 on a 3T MR scanner(MAGNTEOM Trio, Siemens Healthcare, Erlangen, Germany) at baseline and during follow-up. All images were acquired with ECG-gating and breath-holding. The imaging protocol consisted of a balanced steady-state free precession (bSSFP) cine sequence for left and right ventricular function, an inversion recovery turbo-flash pulse sequence after gadolinium administration for late gadolinium enhancement (LGE), a prototype modified Look-Locker inversion recovery (MOLLI) sequence for T1 mapping, and a T2 mapping sequence using T2 prep with bSSFP for myocardial edema. T1mapping was acquired in three short-axis slices (basal, mid, and apical) with a fixed 5(3)3/4(1)3(1)2 sampling scheme for pre- and post-contrast mapping, respectively. Ventricular size and function, LGE, myocardial T1 value, extracellular volume (ECV), and T2 value were analyzed. It was used to calculate the ECV according to the following equation: ECV = (1 - hematocrit) × (∆R1myocardium / ∆R1blood)4. The recovered left ventricular ejection fraction (LVEF) was defined as LVEF ≥ 50% after at least 6 months of the diagnosis. Normally distributed variables were described as mean ± SD values and tested with Student’s t tests. Non-normally distributed variables were described as median and quartile values and tested with Mann-Whitney U tests. The comparison of tissue characteristics between follow-up and baseline CMR findings was performed using the paired T-test.Results
The mean age of ten PPCM patients was 27.1 ± 5.1 years. CMR showed that these PPCM patients had severely impaired left and right ventricular systolic function (LVEF: 30.0 ± 10.3%; RVEF: 38.2 ± 15.3%) at baseline. Five patients had LGE. PPCM patients had significantly higher native T1 and ECV (1349.7±59.7ms vs. 1212.2 ± 32.0 ms, P < 0.001; 32.8±5.6% vs. 27.1 ± 3.1%, P = 0.011; respectively) and higher myocardial T2 value (42.3±3.3ms vs. 36.8 ± 2.3 ms, P < 0.001) than did the normal controls (Table1). After a median 15.3-month follow-up (interquartile range: 12.9 to 22.8 months), five patients had a recovered LVEF. The follow-up CMR had significant lower native T1 than baseline CMR in these 10 PPCM patients (1366.5±72.3ms vs. 1288.5±74.1ms, P = 0.019 by paired T-test). However, the ECV (31.9 ± 4.9% vs. 30.0±5.8%, P = 0.350) and T2 value (41.8 ± 3.0 ms vs. 40.9±2.8ms, P = 0.395) had no significant difference between the twice CMR. The five LVEF-recovered patients and another five patients didn’t show the significant difference in any variables by T1 and T2 mapping at baseline and follow-up CMR (Table 2). However, the five patients in the unrecovered group showed a trend of higher ECV (33.9±5.8% vs 29.9±3.1%) and T2 values (42.8±2.5ms vs 40.8±3.4ms) than those in another five patients at baseline.Discussion
Regarding the analysis of the ten PPCM patients underwent repeated CMR scan, a significant decrease was noted in the dynamic change of native T1 in PPCM patients. However, there was no significant change of the value of ECV or T2 mapping in PPCM patients. A previous study based on endomyocardial biopsy have demonstrated that native T1 value could noninvasively reflect myocardial fibrosis5. Thus, the finding may suggest that the regression of myocardial diffuse fibrosis and the improvement of LV function may be simultaneously, and further study with larger sample size is needed. On the other hand, the lack of significant change of T2 mapping values at follow-up may indicate that the myocardial inflammatory or edema may not be the main manifestation of the early stage of PPCM patients. As for the ECV, the possible examination of the lack of significant decreased during the repeated CMR scan in LVEF recovered group may be the fact that ECV is a ratio representing the relative volume of extracellular volume, thus the change of ECV may be affected by changes in myocardial cells6. Further research on the dynamic change of myocardial tissue characteristics in PPCM may provide more information on pathogenesis in PPCM patients.Conclusion
Myocardial tissue characteristics in PPCM patients have been changed in the onset of heart failure. However, myocardial tissue characteristics are gradually improving over time, verified by native T1 decreasing significantly in the follow-up CMR of PPCM patients. Further study with larger sample size is needed.Acknowledgements
Not applicable.References
1. Arany Z, Elkayam U. Peripartum Cardiomyopathy. Circulation. 2016;133(14):1397-1409.
2. Sliwa K, Hilfiker-Kleiner D, Petrie MC, et al. Current state of knowledge on aetiology, diagnosis, management, and therapy of peripartum cardiomyopathy: a position statement from the Heart Failure Association of the European Society of Cardiology Working Group on peripartum cardiomyopathy. European journal of heart failure. 2010;12(8):767-778.
3. Kramer CM, Barkhausen J, Flamm SD, Kim RJ, Nagel E. Standardized cardiovascular magnetic resonance (CMR) protocols 2013 update. Journal of cardiovascular magnetic resonance: official journal of the Society for Cardiovascular Magnetic Resonance. 2013;15:91.
4. Arheden H, Saeed M, Higgins CB, et al. Measurement of the distribution volume of gadopentetate dimeglumine at echo-planar MR imaging to quantify myocardial infarction: comparison with 99mTc-DTPA autoradiography in rats. Radiology. 1999;211(3):698-708.
5. Sibley CT, Noureldin RA, Gai N, et al. T1 Mapping in cardiomyopathy at cardiac MR: comparison with endomyocardial biopsy. Radiology.2012;265(3):724-732.
6. Treibel TA, Kozor R, Schofield R, et al. Reverse Myocardial Remodeling Following Valve Replacement in Patients With Aortic Stenosis. Journal of the American College of Cardiology. 2018;71(8):860-871.
Figures
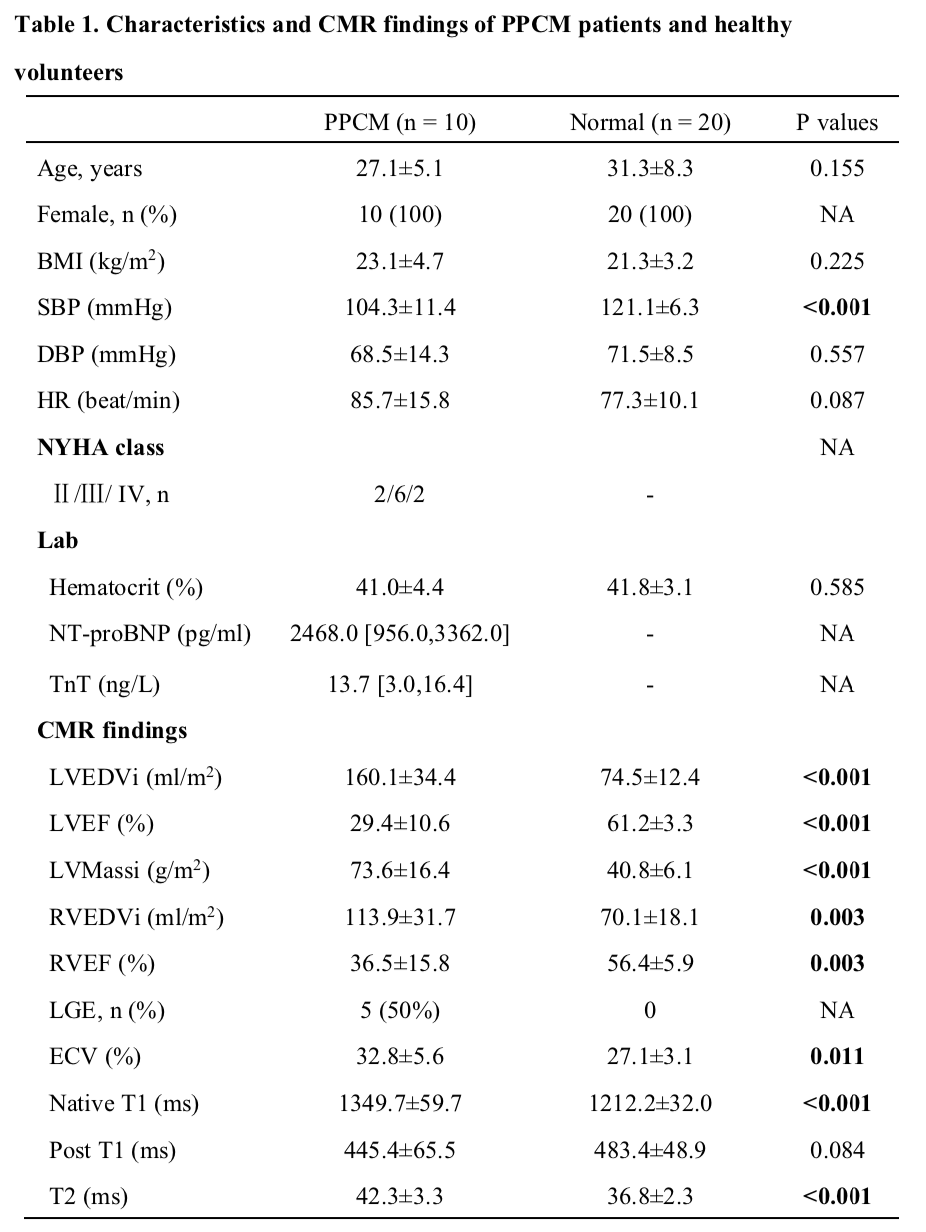
CMR, cardiovascular magnetic resonance; PPCM, peripartum cardiomyopathy; BMI, body mass index; SBP, systolic blood pressure; DBP, diastolic blood pressure; HR, heart rate; NYHA, New York Heart Association; NT-proBNP, N-terminal pro-B-type natriuretic peptide; TnT, troponin T; LVEDVi, left ventricular end diastolic volume index; LVEF, left ventricular ejection fraction; LVMassi, left ventricular mass index; RVEDVi, right ventricular end diastolic volume index; RVEF, right ventricular ejection fraction; LGE, late gadolinium enhancement; ECV, extracellular volume.
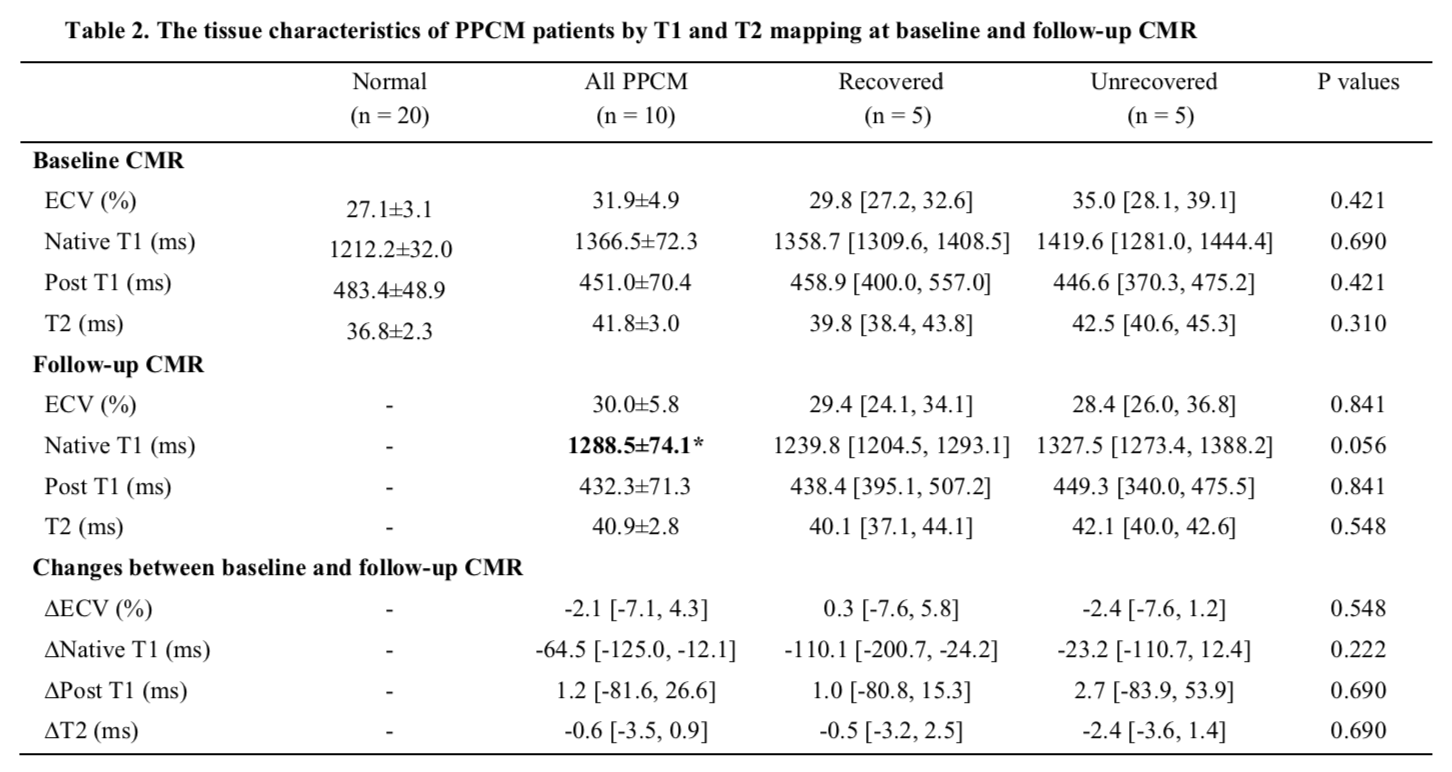
Table 2. The tissue characteristics of PPCM patients by T1 and T2 mapping at baseline and follow-up CMR
*P<0.05, follow-up CMR vs baseline CMR by paired T-test. Delta values are the differences between those parameters’ follow-up value minus baseline value. Abbreviations: CMR, cardiovascular magnetic resonance; PPCM, peripartum cardiomyopathy; ECV, extracellular volume.