2063
Quantitative assessment of the effect of alcohol on myocardial tissues with T1 rho and T1 mapping1Department of Biomedical Engineering, Beijing Institute of Technology, Beijing, China, 2Center for Biomedical Imaging Research, Department of Biomedical Engineering, School of Medicine, Tsinghua University, Beijing, China, 3Department of Cardiology, Peking Union Medical College Hospital, Beijing, China, 4Department of Imaging and Interventional Radiology, The Chinese University of Hong Kong, Hong Kong, China
Synopsis
Quantitative Cardiovascular Magnetic Resonance (CMR) imaging has been widely used in detection of myocardial diseases. In this study, T1 rho and T1 mapping MR imaging were performed in subjects with and without alcohol consumption to assess the impact of drinking on the heart. The results suggested that compared with healthy controls, heavy alcohol consumption may lead to detectable changes in myocardial tissues, while moderate alcohol consumption showed no significant difference. In addition, T1 mapping was more sensitive to detect myocardial changes caused by alcohol than T1 rho.
Introduction
Excessive alcohol consumption could lead to collagen accumulation, myocardial fibrosis and heart failure.1 Cardiovascular Magnetic Resonance (CMR) provides a diagnostic tool for detecting the structural and functional changes in myocardium. T1 mapping, in which native T1, post T1 and extracellular volume (ECV) fraction could be estimated, is particularly valuable for detection of myocardial fibrosis.2 T1 rho could reflect collagen accumulation in osteoarthritis and diffuse fibrosis in liver, so it may be an attractive technique for characterization of myocardial tissues without exogenous contrast agents.3 This study attempted to investigate the potential of T1 rho and T1 mapping in assessing myocardial changes caused by alcohol as well as the association of the two techniques.Methods
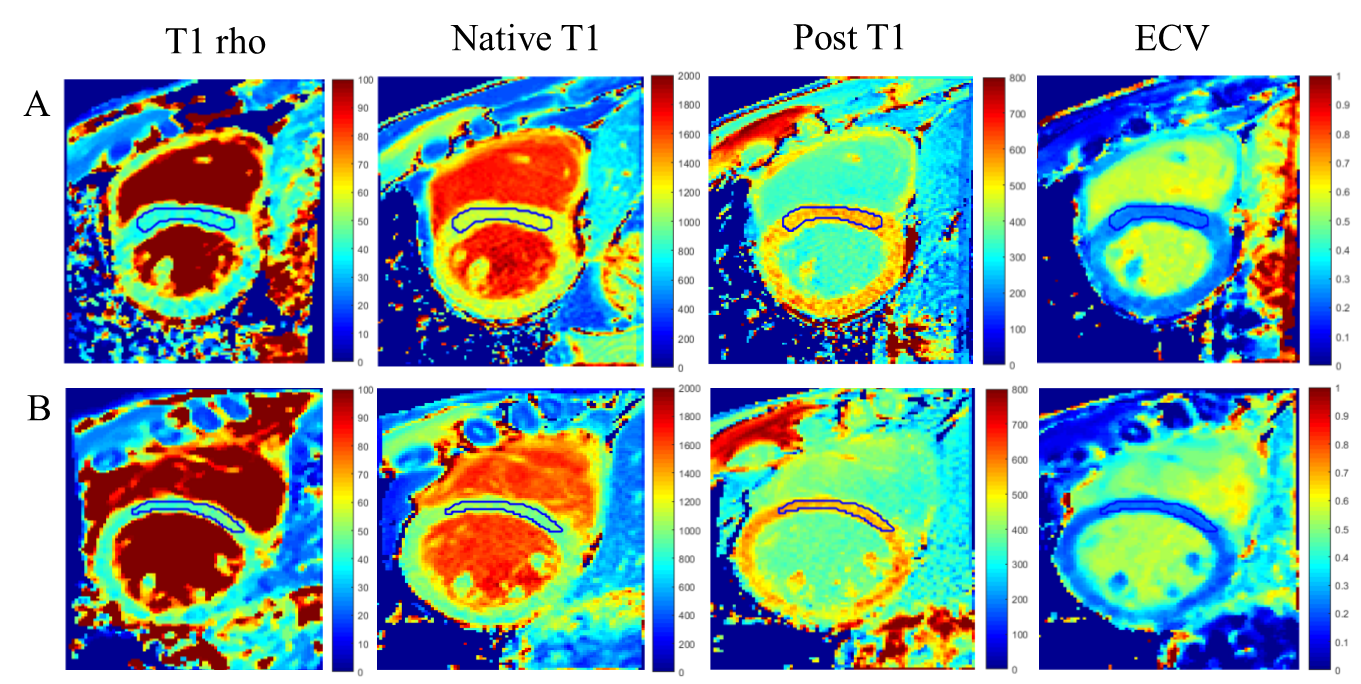
Study sample: A total of 35 male subjects (15 subjects with heavy alcohol consumption, 12 subjects with moderate alcohol consumption and 8 healthy controls) were recruited in this study (Table 1). The study protocol was approved by institutional review board and written consent form was obtained from each subject. MR imaging: T1 rho and T1 mapping MR imaging were conducted on a 3.0T MR scanner (Achieva TX, Philips Healthcare, Best, The Netherlands) with a 32-channel cardiac coil. T1 rho and T1 mapping used the same parameters as follows: TR/TE 2.3/0.9 ms, FOV 320*320 mm, flip angle 35°, slice thickness 8 mm. Pre- and post- contrast T1 mapping were performed with 3-3-5 MOLLI sequence. Post-contrast enhanced T1 mapping was conducted 10 minutes after adminitration of Gadolinium-based contrast agent (Magnevist, Bayer Schering Pharma, Germany) injection with a dose of 0.15 mmol/kg. Data analysis: Group-wise registration was performed in raw images of T1 rho and T1 mapping to eliminate myocardial motion.4 T1 rho was calculated with a linear model, native T1 and post T1 were calculated with a 3-parameter model, and ECV was calculated based on native T1 and post T1.2 Statistical analysis: The healthy controls and subjects with alcohol consumption were compared by an independent t test. Spearman correlation was performed to estimate the association between T1 rho and T1 mapping using all points in region of interest (ROI) from interventricular septum. All statistical analyses were conducted with SPSS 25.0 (IBM Inc., USA).Results
Compared with healthy controls, subjects with heavy alcohol consumption showed significantly higher ECV values (27.66 ± 2.64% vs. 26.27 ± 0.97%, p = 0.008). No significant differences were found between healthy controls and subjects with moderate alcohol consumption in T1 rho, native T1, post T1 and ECV (all p > 0.05, Table2). T1 rho was significant correlated with native T1, post T1 and ECV in almost all groups with p values < 0.05. Especially, there were moderate correlations between T1 rho and post T1 in subjects with heavy alcohol consumption (r = -0.3864, p < 0.05) as well as T1 rho and ECV in healthy controls (r = 0.3516, p < 0.05) (Table3).Discussion
In this study, significant correlation was observed between ECV and T1 rho, this can be partly explained by the association of extracellular volume fraction and collagen volume fraction(CVF).5 Precious studies suggest that alcohol exposure promotes collagen deposition and fibrosis by modulating metalloproteinases (MMPs) and tissue inhibitors of MMPs (TIMPs) expression.1,6 Our study found that the change of ECV was more obvious than T1 rho during chronic alcohol exposure. The underlying principle of the two measurement is different. ECV is a direct marker for characterization of myocardial interstitium, while the change of T1 rho is relatively complex, affected by macromolecular content, magnetization transfer and residual dipolar interaction etc.3 Further studies are required to explore the molecular mechanism of alcohol cardiomyopathy and potential of T1 rho in myocardial fibrosis assessment.Conclusion
Heavy alcohol consumption could lead to detectable changes in myocardial tissues, while moderate alcohol consumption showed no significant difference compared with healthy controls. In addition, T1 mapping was more sensitive to detect myocardial changes caused by alcohol than T1 rho.Acknowledgements
NoneReferences
1. El Hajj E C, El Hajj M C, et al. Alcohol Modulation of Cardiac Matrix Metalloproteinases (MMPs) and Tissue Inhibitors of MMPs Favors Collagen Accumulation[J]. Alcoholism: Clinical and Experimental Research, 2014, 38(2):448-456.
2. Haaf P, Garg P, Messroghli D R, et al. Cardiac T1 Mapping and Extracellular Volume (ECV) in clinical practice: a comprehensive review[J]. Journal of Cardiovascular Magnetic Resonance, 2016, 18(1):89.
3. Han Y, Liimatainen T, Gorman R C, et al. Assessing myocardial disease using T1ρ MRI[J]. Current Cardiovascular Imaging Reports, 2014, 7(2):9248.
4. Tao, Q., Tol, P. V. D., et al. Robust motion correction for myocardial t1 and extracellular volume mapping by principle component analysis‐based groupwise image registration. Journal of Magnetic Resonance Imaging, 2018; 47(5), 1397-1405.
5. Flett A S, Hayward M P, et al. Equilibrium Contrast Cardiovascular Magnetic Resonance for the Measurement of Diffuse Myocardial Fibrosis: Preliminary Validation in Humans[J]. Circulation, 2010, 122(2):138-144.
6. Spinale F G, Coker M L, Heung L J, et al. A Matrix Metalloproteinase Induction/Activation System Exists in the Human Left Ventricular Myocardium and Is Upregulated in Heart Failure[J]. Circulation, 2000, 102(16):1944-1949.
Figures