2060
3D left atrial LGE MRI at 1.5 Tesla: calibration of fibrosis cut point and initial evaluation in patients with and without atrial fibrillation1Northwestern University, Chicago, IL, United States
Synopsis
Given the thin nature of the left atrial (LA) wall and the need to perform respiratory gating, the clinical translation of LA late gadolinium-enhanced (LGE) MRI has proven challenging, particularly at 1.5 Tesla. To address this, a recent study described development of a self-navigated, free-breathing 3D LA LGE pulse sequence using stack-of-stars k-space sampling and XD-GRASP reconstruction. Here, we aim to derive the cut point for LA fibrosis for this 3D LA LGE technique, by using image intensity ratio (LA wall/blood signal) of healthy volunteers, and evaluate LA fibrosis in patients with and without atrial fibrillation.
Introduction
Left atrial (LA) fibrosis is considered a substrate responsible for the initiation and maintenance of atrial fibrillation (AF) (1, 2). LA fibrosis as measured by late gadolinium enhancement (LGE) MRI (3) has been shown to predict AF recurrence following AF ablation (4). However, due to the thin nature of the LA wall (5) and the need to perform respiratory gating, the clinical translation of LA LGE MRI has proven challenging, particularly at 1.5 Tesla. To address this, we developed a self-navigated, free-breathing 3D LA LGE pulse sequence using stack-of-stars k-space sampling, b-SSFP readout, and XD-GRASP reconstruction with predictable scan time (~5-6 min), as previously described (6). One approach to analyze LA LGE is to calculate the image intensity ratio (IIR) (7). The IIR can then be used to derive the cut point for fibrosis, either by correlating against electroanatomic mapping in patients (7) or statistically from healthy volunteers (8). The aims of this study were to 1) statistically establish the normal IIR cut point for our 3D LA LGE sequence (6) and, 2) evaluate the ability of this IIR cut point to quantify differences in LA fibrosis in patients with and without AF.Methods
Human Subjects: Eleven young, healthy volunteers without prior history of cardiovascular disease (7 females, age = 25 ± 2 years) were scanned on a 1.5 T scanner (Siemens, AERA) for determining the IIR. Additionally our 3D LA LGE sequence was run on 6 patients with no history of AF (3 females, mean age = 67 ± 11 years) and 8 patients with AF (2 females, mean age = 59 ± 16 years).Pulse Sequence & Image Reconstruction: We modified a previously described 3D LA LGE pulse sequence at 1.5 T using stack-of-stars k-space sampling, b-SSFP readout, and XD-GRASP reconstruction method (6). Briefly, we designed an inversion-recovery pulse sequence to acquire 52 rays per heartbeat during diastole. Prior to each single-shot readout, two rays were sampled for self‐navigation of respiratory motion (9). A 3D volume with 300 mm x 300 mm x 114 mm FOV and 1.5 mm x 1.5 mm x 2.2 mm spatial resolution was imaged in an oblique sagittal plane. A total of 18,200 rays were sampled over 350 heartbeats with ECG triggering every heartbeat. The optimal inversion time to was determined using a TI scout sequence with triggering every heart beat. The 3D LA LGE data were reconstructed using the XD-GRASP framework, as previously described (6).
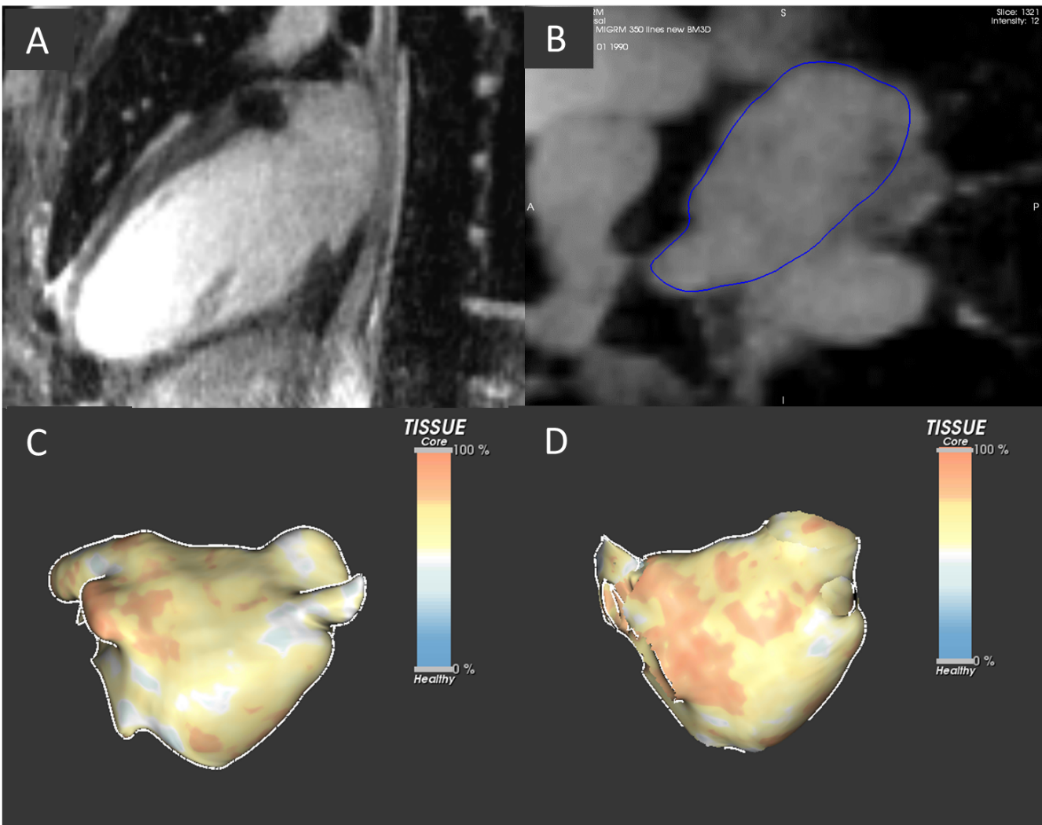
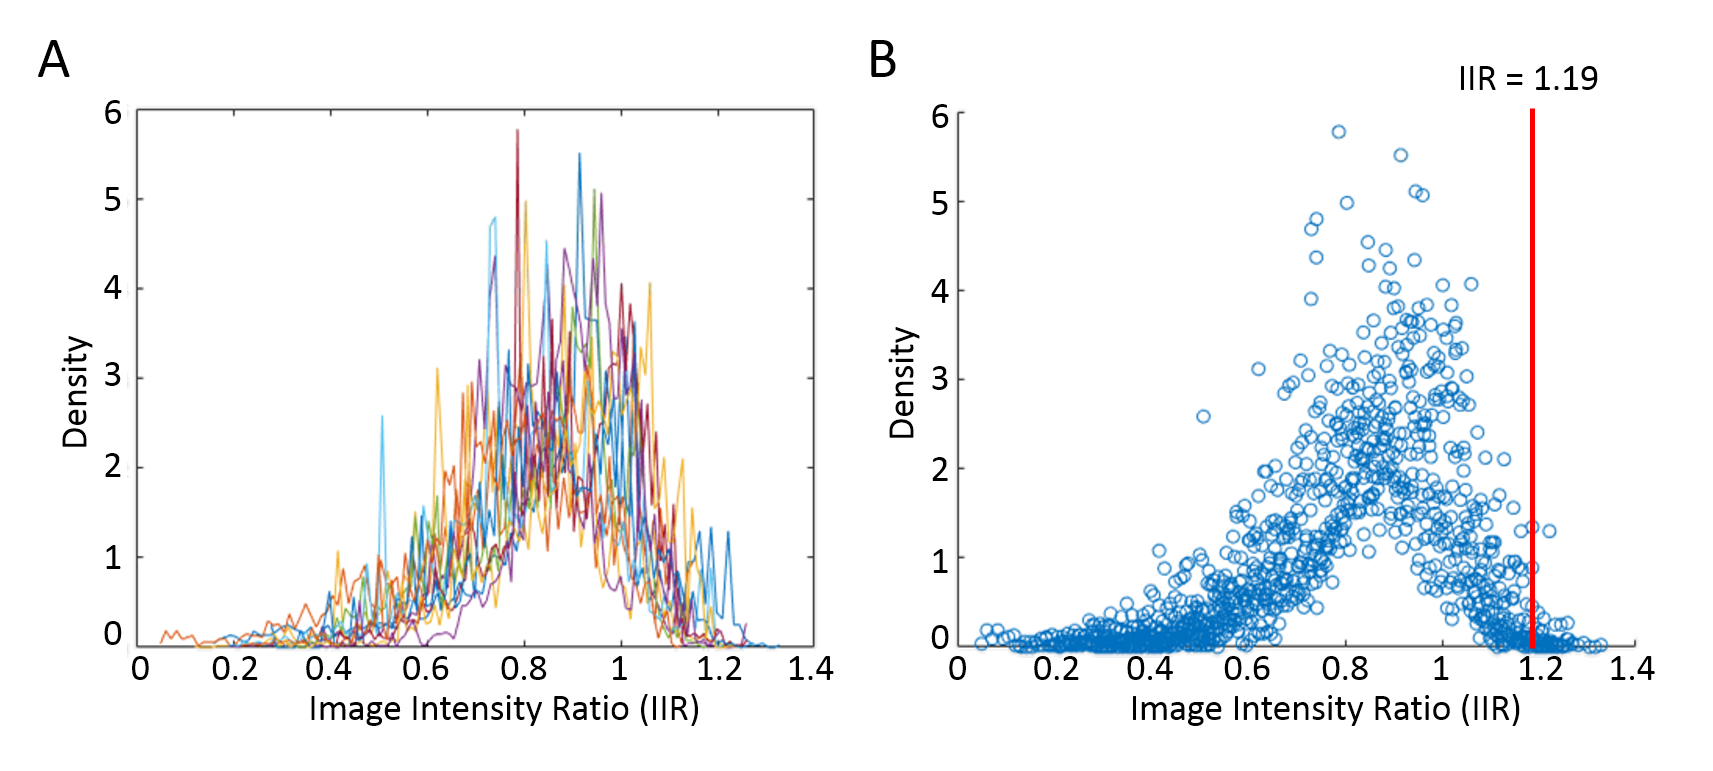
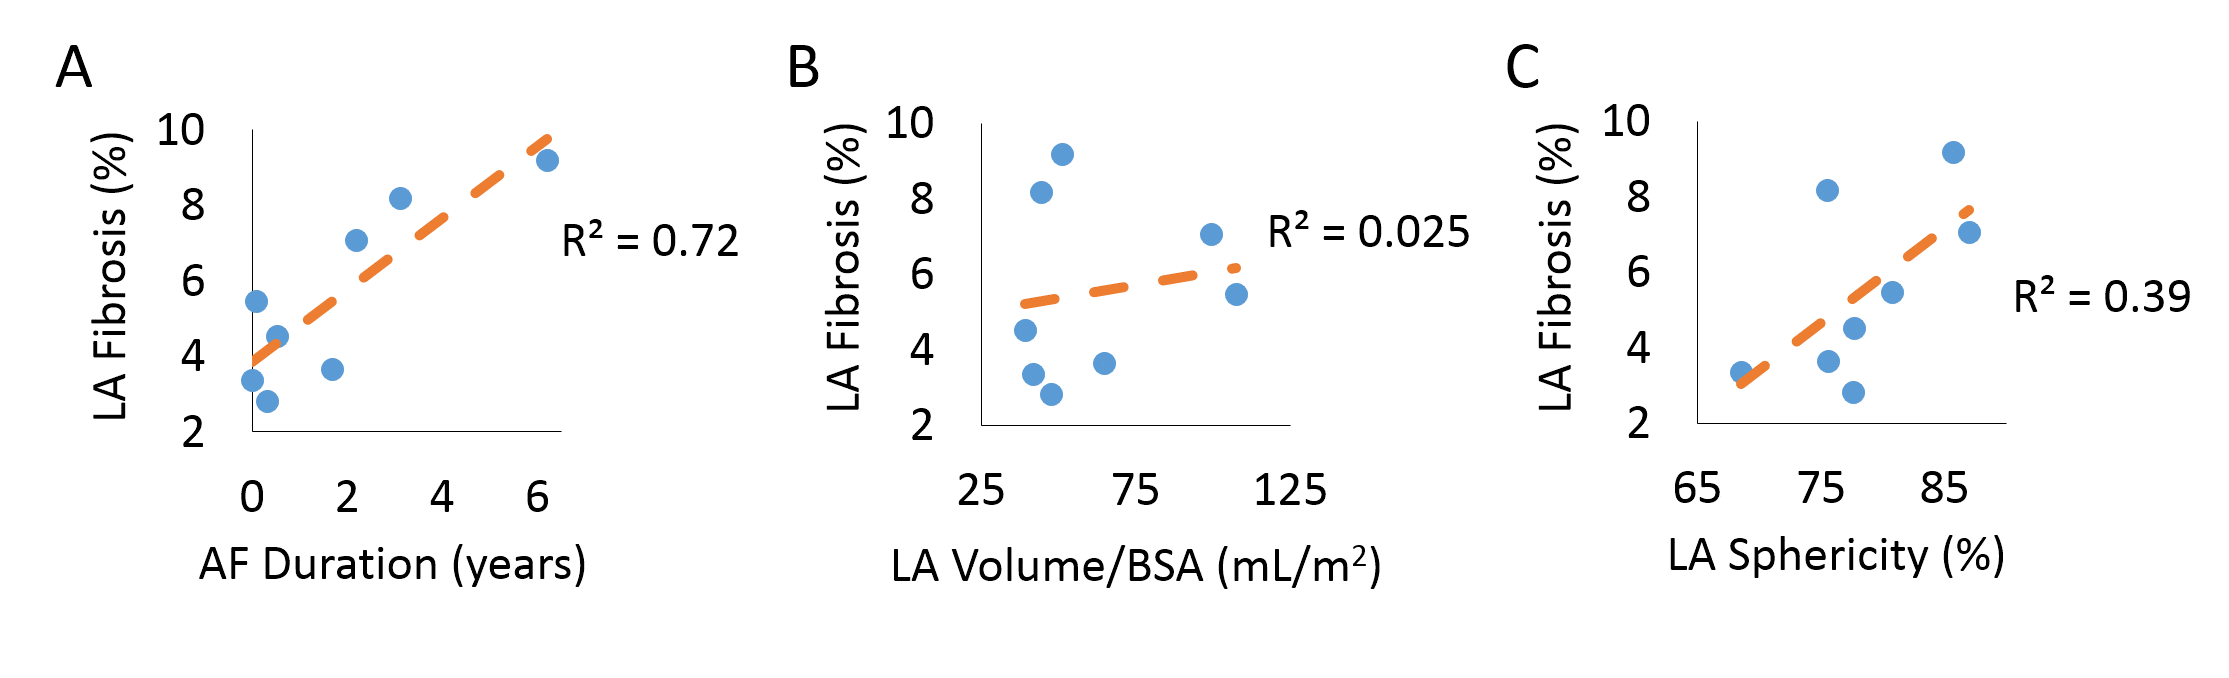
Data Analysis: LA wall contours were manually drawn in the axial plane using ADAS 3D (Galgo Medical, Barcelona, Spain). Pulmonary veins and the mitral valve were excluded from segmentation to focus the analysis on LA tissue. Using the LA wall pixel intensities and the mean blood pool intensity, the LA IIR was calculated as: signal intensity at each LA wall voxel divided by the mean blood pool intensity (8) resulting in an IIR surface map (Figure 1D). We then computed the normalized histogram density of the LA IIR voxels distribution (Figure 2A). The IIR cut point for healthy tissue was statistically determined as the 95th percentile value of pooled IIR data from all 11 volunteers (Figure 2B). In patients, LA fibrosis percentage was computed as the percentage of the LA wall voxels above the IIR cut point relative to the total number of LA wall voxels. In AF patients, we used Pearson correlation to evaluate the association between the IIR-identified LA fibrosis percentage and AF duration, LA volume/body surface area (BSA), and LA sphericity (Figure 4).
Results
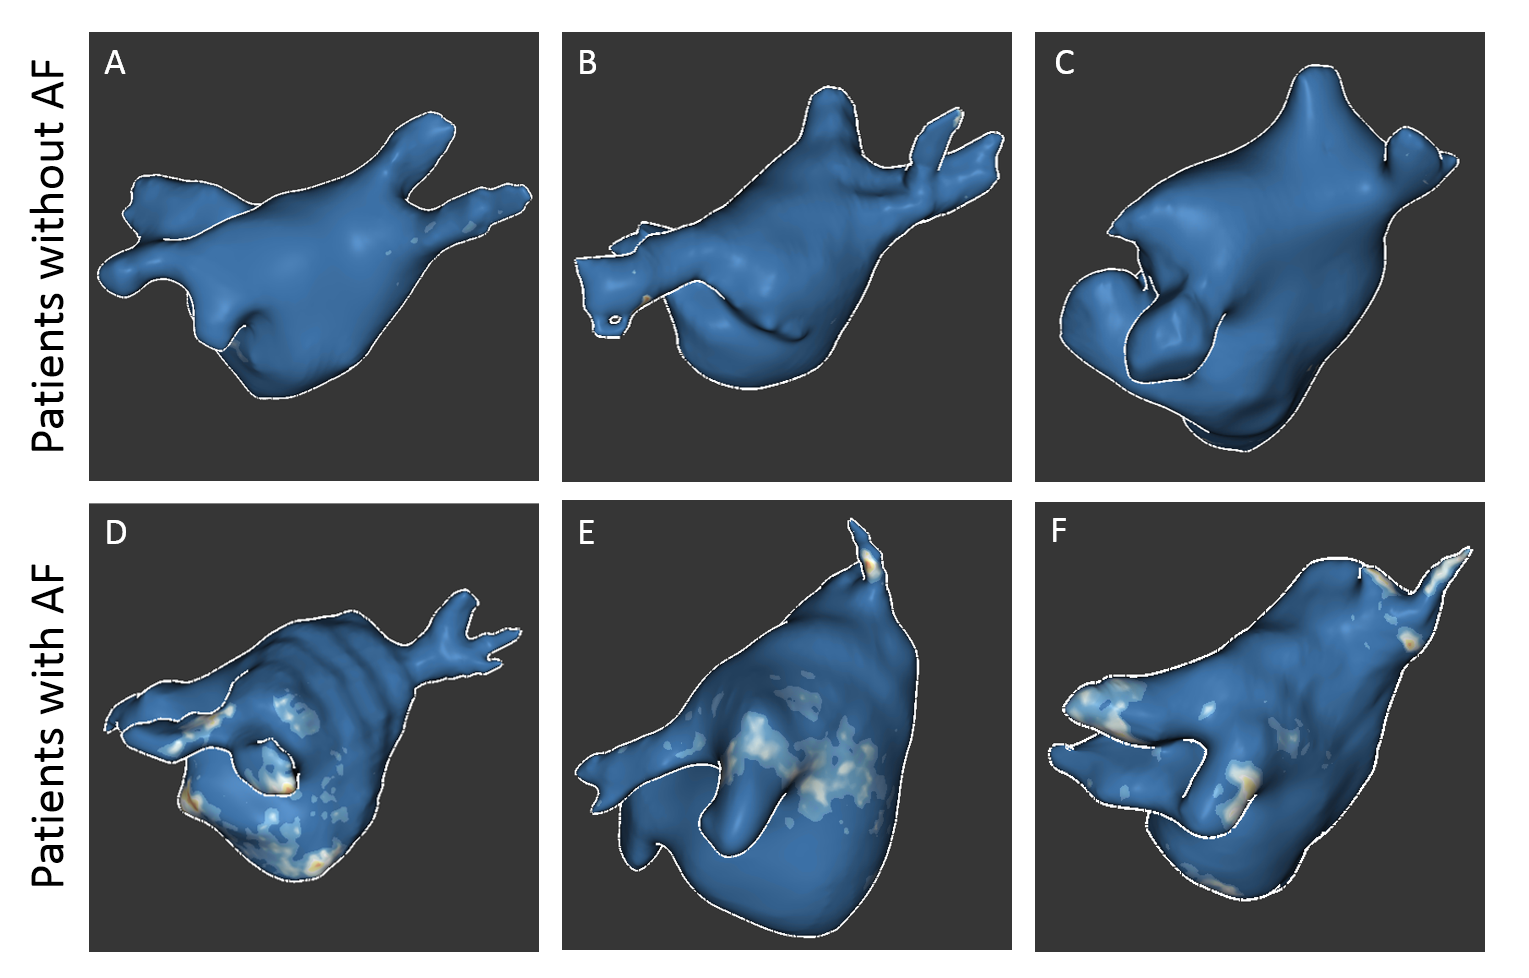
3D LA LGE was successfully run on all enrolled volunteers and patients (scan time = 5.3 ± 1.0 min). In our volunteer cohort, the IIR cut point for healthy tissue was calculated to be 1.19 (Figure 2B). Patients with AF had more visible fibrosis in regions proximal to the pulmonary veins compared to patients without AF (Figure 3). Significantly higher LA fibrosis was detected in patients with AF (5.5 ± 2.4%) compared to patients without AF (2.3 ± 2.1%, p = 0.022). In patients with AF, the detected IIR-based fibrosis percentage showed good correlation with AF duration (R2=0.72) and fair association with LA sphericity (R2=0.39) (Figure 4).Discussion
In this study we derived the IIR cut point as 1.19 for LA fibrosis using the proposed 3D LA LGE pulse sequence at 1.5 Tesla, which essentially matches 1.2 reported by a previously published work using a gradient echo pulse sequence at 3 Tesla (8). Using this cut point, we were able to detect fibrosis in the LA and around the pulmonary veins in patients (Figure 3). In patients with AF, LA fibrosis was correlated with AF duration and LA sphericity, which are established biomarkers of AF severity (10, 11). Future work includes validating LA fibrosis quantification against electroanatomical mapping in patients undergoing AF ablation.Conclusion
We established 1.19 as the IIR cut point for LA fibrosis using the proposed 3D LA LGE sequence. IIR-based identified fibrosis in AF patients has good correlation with AF duration and fair association with LA sphericity. Future validation (e.g. vs. electroanatomical mapping) is warranted to further assess the potential of the technique for predicting AF recurrence following AF ablation.Acknowledgements
Funding: National Institutes of Health (R01HL116895, R01HL138578, R21EB024315, R21AG055954, T32EB025766) and American Heart Association (14SFRN20480260, 19IPLOI34760317).References
1. Dzeshka MS, Lip GY, Snezhitskiy V, Shantsila E. Cardiac Fibrosis in Patients With Atrial Fibrillation: Mechanisms and Clinical Implications. J Am Coll Cardiol. 2015;66(8):943-59.
2. Goldberger JJ, Arora R, Green D, Greenland P, Lee DC, Lloyd-Jones DM, et al. Evaluating the Atrial Myopathy Underlying Atrial Fibrillation: Identifying the Arrhythmogenic and Thrombogenic Substrate. Circulation. 2015;132(4):278-91.
3. Peters DC, Wylie JV, Hauser TH, Kissinger KV, Botnar RM, Essebag V, et al. Detection of pulmonary vein and left atrial scar after catheter ablation with three-dimensional navigator-gated delayed enhancement MR imaging: initial experience. Radiology. 2007;243(3):690-5.
4. Akoum N, Daccarett M, McGann C, Segerson N, Vergara G, Kuppahally S, et al. Atrial fibrosis helps select the appropriate patient and strategy in catheter ablation of atrial fibrillation: a DE-MRI guided approach. J Cardiovasc Electrophysiol. 2011;22(1):16-22.
5. Tan HW, Wang XH, Shi HF, Zhou L, Gu JN, Liu X. Left atrial wall thickness: anatomic aspects relevant to catheter ablation of atrial fibrillation. Chin Med J (Engl). 2012;125(1):12-5.
6. Gunasekaran S HHH-V, R Passman, D Lee, D Kim editor Self-Navigated, Free-Breathing 3D Left Atrial Late Gadolinium Enhancement MRI with Stack-of-Stars k-space Sampling and GRASP Reconstruction: A Preliminary Study for Quantification of Atrial Fibrosis. ISMRM; 2019; Montreal, QC, Canada.
7. Khurram IM, Beinart R, Zipunnikov V, Dewire J, Yarmohammadi H, Sasaki T, et al. Magnetic resonance image intensity ratio, a normalized measure to enable interpatient comparability of left atrial fibrosis. Heart Rhythm. 2014;11(1):85-92.
8. Benito EM, Carlosena-Remirez A, Guasch E, Prat-Gonzalez S, Perea RJ, Figueras R, et al. Left atrial fibrosis quantification by late gadolinium-enhanced magnetic resonance: a new method to standardize the thresholds for reproducibility. Europace. 2017;19(8):1272-9.
9. Haji-Valizadeh H, Collins JD, Aouad PJ, Serhal AM, Lindley MD, Pang J, et al. Accelerated, free-breathing, noncontrast, electrocardiograph-triggered, thoracic MR angiography with stack-of-stars k-space sampling and GRASP reconstruction. Magn Reson Med. 2019;81(1):524-32.
10. Sardana M, Lessard D, Tsao CW, Parikh NI, Barton BA, Nah G, et al. Association of Left Atrial Function Index with Atrial Fibrillation and Cardiovascular Disease: The Framingham Offspring Study. J Am Heart Assoc. 2018;7(7).
11. Botto GL, Padeletti L, Santini M, Capucci A, Gulizia M, Zolezzi F, et al. Presence and duration of atrial fibrillation detected by continuous monitoring: crucial implications for the risk of thromboembolic events. J Cardiovasc Electrophysiol. 2009;20(3):241-8.
12. Moon J, Lee HJ, Yu J, Pak HN, Ha JW, Lee MH, et al. Prognostic implication of left atrial sphericity in atrial fibrillation patients undergoing radiofrequency catheter ablation. Pacing Clin Electrophysiol. 2017;40(6):713-20.
Figures