2056
Fast Myocardial T1 Mapping in Mice at 11.7 T using DESPOT and continuous tiny golden Angle Acquisitions1Core-Facility Small Animal Imaging, Ulm University, Ulm, Germany, 2Experimental Cardiovascular MRI, Ulm University Medical Center, Ulm, Germany
Synopsis
In magnetic resonance imaging, T1 mapping is a valuable tool for investigating structural alterations of the heart due to cardiomyopathy. This work presents a fast T1 mapping method based on DESPOT in combination with continuous radial tiny golden angle acquisitions. The suggested method was tested at 11.7 T and compared to DESPOT based on respiratory and cardiac gated FLASH data. Average values of both measurements are in good accordance to one another as well as to recent literature findings. The presented method is capable of acquiring qualitative and quantitative 2D T1 maps of the myocardium in under 25 s.
Introduction
Myocardial $$$T_1$$$ mapping is a well-established tool for the diagnosis and evaluation of cardiomyopathy. In combination with mouse models, studies of diseases such as myocardial infarction, heart failure and hypertrophy are possible in a reproducible and well-controlled environment. Additionally, transgenic models allow further insights into the pathogenesis of cardiac diseases.Since cardiovascular studies are overall time consuming, continuous efforts have been made to reduce imaging time for the generation of quantitative information. DESPOT $$$T_1$$$ mapping in combination with a radial tiny-golden-angle (tyGA) acquisition can achieve high spatial resolution $$$T_1$$$-maps from only two consecutive scans without the need of cardiac- or respiratory gating. Furthermore, using a respiratory and cardiac gated FLASH sequence, the cyclic variations of myocardial $$$T_1$$$ in rodents can be observed. Equal approaches for human myocardial $$$T_1$$$ variations have already proven its feasibility for the assessment of myocardial blood volume1.
Methods
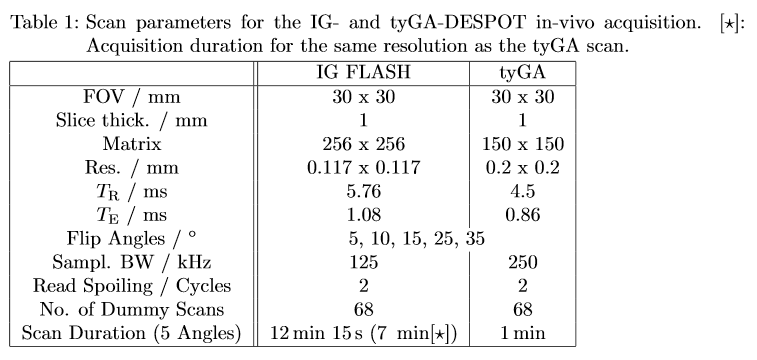
The DESPOT method2 relies on the flip-angle dependent signal evolution during an acquisition in the steady-state. A $$$T_1$$$ map may be determined from only two experiments according to $$\begin{equation}T_1 = T_\text{R}/\log[\{I_1\sin \alpha_1 \cos \alpha_1 - I_2\sin \alpha_1 \cos \alpha_2\}/\{I_1\sin \alpha_2 - I_2\sin \alpha_1\}]\, ,\end{equation}$$ where $$$\alpha_1$$$ and $$$\alpha_2$$$ are two different flip angles with corresponding pixel intensities $$$I_1$$$ and $$$I_2$$$. Both scans are acquired at equal Repetition Time $$$T_\text{R}$$$.More exact results might be obtained from more than two measurements by regression analysis of $$$I/\sin\alpha$$$ against $$$I\cot\alpha$$$ in which the slope $$$s$$$ corresponds to $$$\exp(-T_\text{R}/T_1)$$$ and therefore $$\begin{equation}T_1 = -T_\text{R}/\log(s)\, .\end{equation}$$ In-vivo $$$T_1$$$ maps of a short-axis slice were acquired at 11.7 T (Bruker Biospec 117/16) using a 2D IntraGate (IG) CINE FLASH sequence3 to quantify $$$T_1$$$ variations over the entire cardiac cycle. Additional maps were acquired using a radial tyGA acquisition without any cardiac or respiratory gating. The tyGA approach has the advantage of being less prone to eddy current and motion related artefacts4. Both, the IG and tyGA scans were accomplished using a sufficient number of dummy scans (68) and two cycles of (read)-gradient spoiling. Further scan parameters are shown in table 1.
Each calculated $$$T_1$$$ map is based on measurements with five different flip angles. $$$B_1$$$ deviations and inhomogeneities were retrospectively corrected using a double flip angle approach5.The application of DESPOT in combination with tyGA for explicitly long in-vivo $$$T_1$$$ values was a priori validated by $$$T_1$$$ measurements of the cerebral cortex.
Results and Discussion
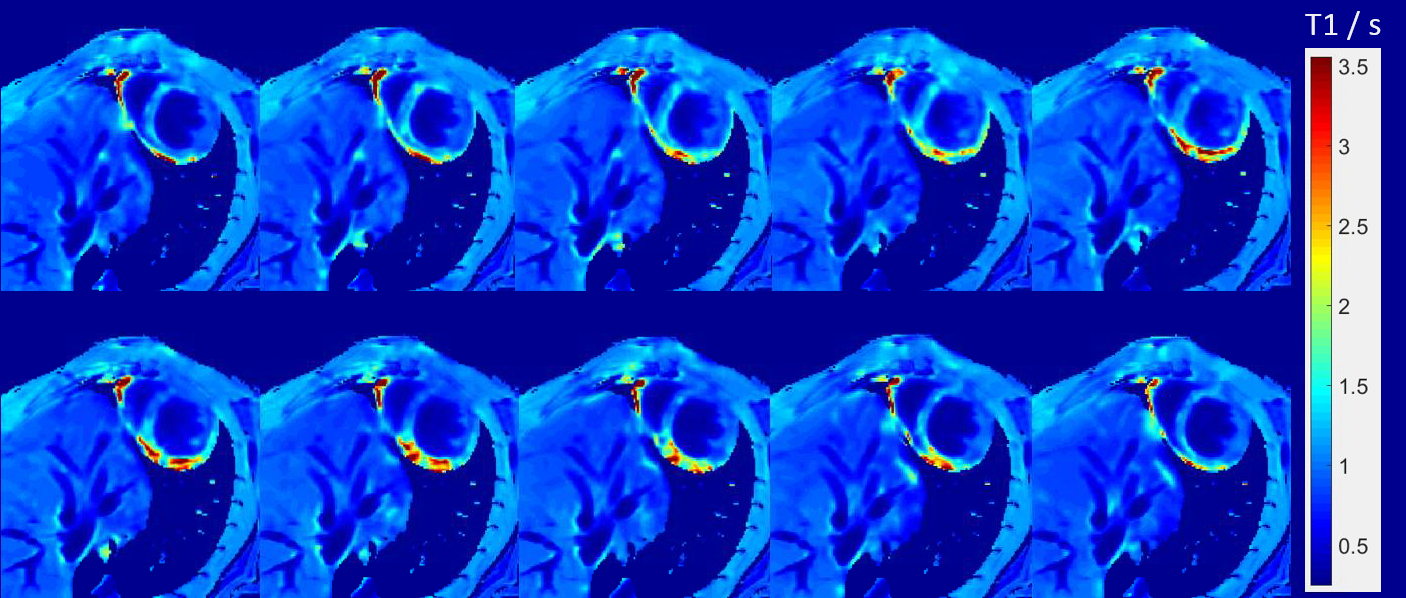
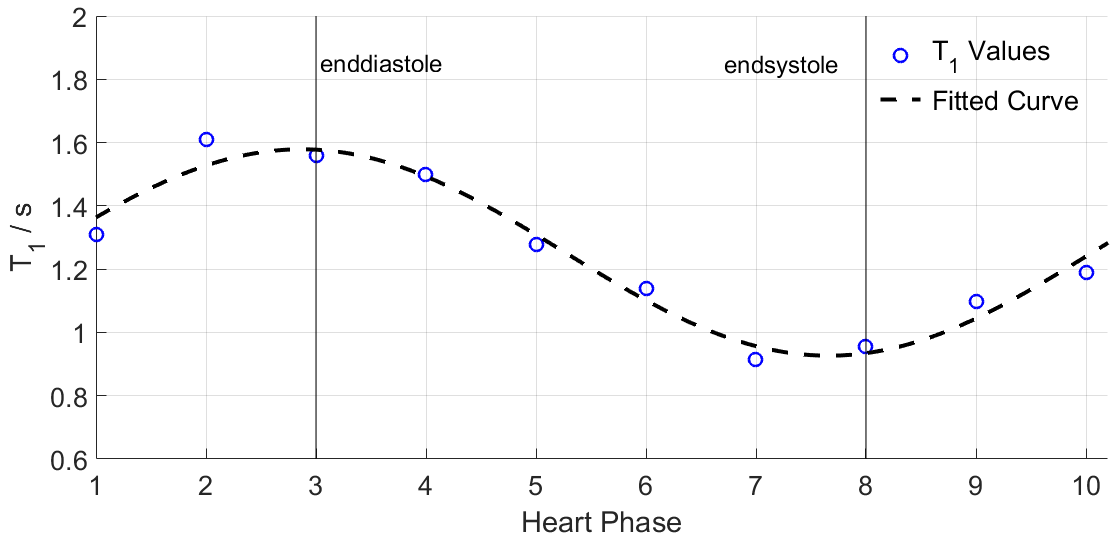
In-vivo measurements in the cerebral cortex using the tyGA-DESPOT approach yielded an average $$$T_1$$$ value of $$$(2120\pm 250)\,$$$ms which is in good accordance to the reference value of $$$(2073\pm 101)\,$$$ms6.All ten $$$T_1$$$ maps associated to ten consecutive phases of the cardiac cycle, resulting from the IG-DESPOT acquisition are shown in figure 1. The average left-ventricular myocardium (LVM) $$$T_1$$$ value over all phases of the cardiac cycle is $$$(1253\pm 532)\,$$$ms where the high standard deviation arises from the high $$$T_1$$$ variability of the cardiac cycle as well as within the LVM of one cardiac phase. The cardiac phase dependent changes in average LVM $$$T_1$$$ is displayed in figure 2. The minimum $$$T_1$$$ value of $$$(915\pm 400)\,$$$ms is reached around the endsystolic phase and the maximum of $$$(1610\pm 786)\,$$$ms at the enddiastolic phase. An overall reference value for LVM $$$T_1$$$ at $$$11.7\,$$$T is given in by $$$(1100\pm 270)\,$$$ms7.
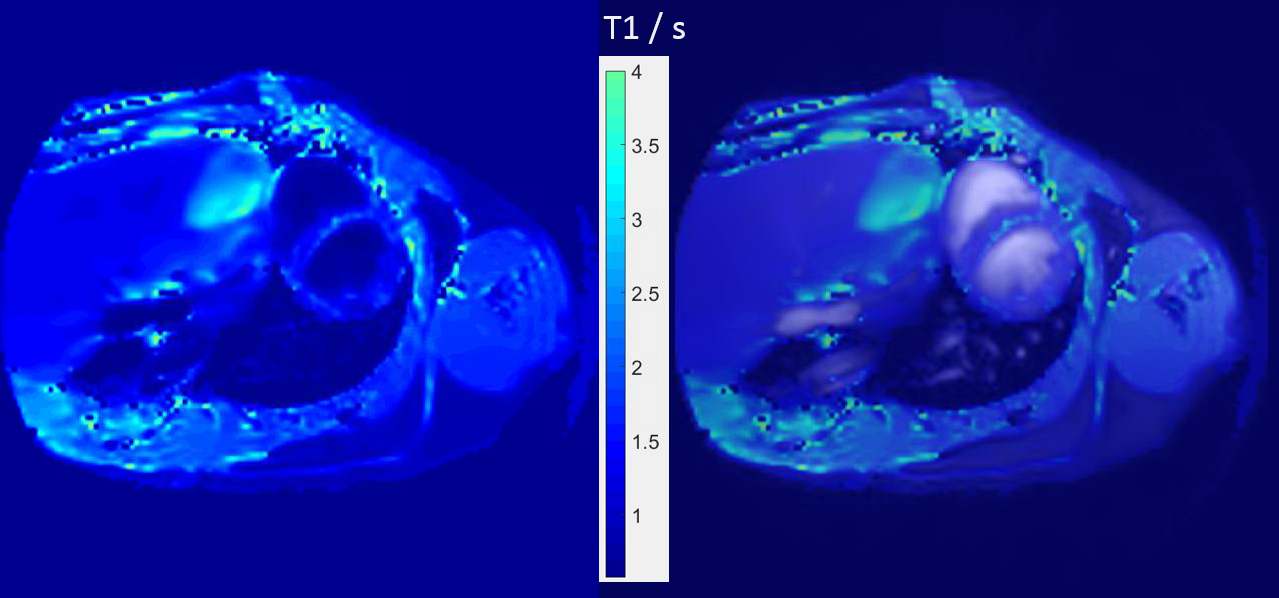
The tyGA-DESPOT approach is capable of achieving equal average $$$T_1$$$ values of $$$(1156\pm 283)\,$$$ms and is therefore again in good accordance to the literature reference. Figure 3 shows the calculated $$$T_1$$$ map with an additional anatomical overlay on the right-hand side. Since the map is based on five continuous and ungated acquisitions at different flip angles, the LVM $$$T_1$$$ value is an intrinsic average over all heart phases.
By only considering a tyGA-DESPOT measurement using two flip angles with an overall acquisition time of 24 s, the deviation in average $$$T_1$$$ is 15 % compared to five considered flip angles. Thereby, best results were obtained by using flip angles of 5 and 25 degrees.
Conclusion
Fast in-vivo myocardial $$$T_1$$$ mapping in mice is possible using a continuous (no cardiac or respiratory gating) tyGA sequence which is insensitive to the usually arising motion artefacts. Qualitative and quantitative $$$T_1$$$ maps can be achieved from only two measurements within a 15 % deviation from the reference value in under 25 s.High resolution IG scans additionally confirm the calculated $$$T_1$$$ values with the further possibility of observing changes in $$$T_1$$$ over the entire heart cycle using DESPOT. Furthermore, equal images of specific heart cycle stages might be obtained using the tyGA acquisition in combination with a non-uniform self-gating approach8 which focuses on a retrospective correction of cardiac and respiratory motion from continuous acquisitions.
Acknowledgements
The authors thank the Ulm University Centre for Translational Imaging MoMAN for its support.References
[1] Wansapura J., Gottliebson W., Crotty E. and Fleck R. Cyclic variation of T1 in the myocardium at 3 T. Magn Reson Imag. 24, 889-893, 2006.
[2] Cheng H.L. and Wright G.A. Rapid high-resolution T1 mapping by variable flip angles: accurate and precise measurements in the presence of radiofrequency field inhomogeneity. Magn Reson Med. 55, 566-574, 2006.
[3] Zuo Z., Subgang A., Abaei A., Rottbauer W., Stiller D., Ma G. and Rasche V. Assessment of Longitudinal Reproducibility of Mice LV Function Parameters at 11.7 T Derived from Self-Gated CINE MRI. BioMed Res Int. 2, 1-10, 2017.
[4] Wundrak S., Paul J., Ulrici J., Hell E., Geibel M.A., Bernhardt P., Rottbauer W. and Rasche V. Golden ratio sparse MRI using tiny golden angles. Magn Reson Med. 75, 2372-2378, 2016.
[5] Balezeau F., Eliat P.A., Cayamo A.B. and Saint-Jalmes H. Mapping of low flip angles in magnetic resonance. Phys Med Biol. 56, 6635-6647, 2011.
[6] de Graaf R.A., Brown P.B., McIntyre S., Nixon T.W., Behar L. and Rothman D.L. High Magnetic Field Water and Metabolite Proton T1 and T2 relaxation in Rat Brain In Vivo. Magn Reson Med. 56, 386-394, 2006.
[7] Schneider J.E., Cassidy P.J. and Lygate C. Fast, high-resolution in vivo cine magnetic resonance imaging in normal and failing mouse hearts on a vertical 11.7 T system. J Magn Reson Imaging. 18, 691-701, 2003.
[8] Wundrak S., Paul J., Radermacher M., Hombach V., Rottbauer W., Bernhardt P. and Rasche V. High-quality reconstruction of arrhythmic cardiac cycles. J Cardiovasc Magn Reson. 18, 2016.
Figures