2055
Reproducibility of diffusion tensor imaging (DTI) on 12 clinical scanners: Towards validation of cardiac DTI sequences.1Leeds Institute of Cardiovascular and Metabolic Medicine, University of Leeds, Leeds, United Kingdom, 2Université de Lyon, UJM-Saint-Etienne, INSA, CNRS UMR 5520, INSERM U1206, CREATIS, F-42023, Saint Etienne, France, 3Department of Radiology, VA Palo Alto Health Care System, Palo Alto, CA, United States, 4Royal Brompton Hospital and Imperial College, London, United Kingdom, 5Department of Radiology, The Ohio State University Wexner Medical Center, Columbus, OH, United States, 6Institute for Biomedical Engineering, University and ETH Zurich, Zurich, Switzerland, 7Department of Cardiovascular Imaging, Comprehensive Heart Failure Center, Würzburg, Germany, 8Stanford University, Stanford, CA, United States, 9Massachusetts General Hospital and Harvard Medical School, Boston, MA, United States, 10Department of Anatomy and Medical Imaging, The University of Auckland, Auckland, New Zealand, 11Department of Radiology, Radiation-Oncology and Nuclear Medicine and Institute of Biomedical Engineering, Université de Montréal, Montréal, QC, Canada, 12University of Oxford, Oxford, United Kingdom, 13San Francisco Veteran Affairs Medical Center, San Francisco, CA, United States, 14Department of Diagnostic and Interventional Radiology, University Hospital Würzburg, Würzburg, Germany, 15Department of Biomedical Engineering, King's College London, London, United Kingdom
Synopsis
Cardiac diffusion tensor imaging (DTI) is increasingly used for non-invasive in vivo characterisation of cardiac microstructure. To help reconcile the variation in DTI metrics in the literature, we investigated the inter- and intra-site variation of DTI across twelve clinical scanners. Data were acquired at two time points, with a standardised isotropic phantom, acquisition, and post-processing pipeline. In water at 0°C, the coefficient of variation of mean diffusivity (MD) across sites was 1.9 ± 1.4% (mean ± SD), while the mean difference across two scans was (-0.010 ± 0.098) × 10-3 mm2/s (mean ± 1.96SD), indicating low bias and good reproducibility.
Introduction
Cardiac diffusion tensor imaging (DTI) is an emerging non-invasive contrast-free method for in vivocharacterization of cardiac microstructure. Currently, a wide range of mean diffusivity (MD, 0.75 × 10⁻³ to 1.72 × 10⁻³ mm2/s) and fractional anisotropy (FA, 0.29 to 0.61) have been reported in the healthy myocardium1,2,3,4. This range may arise from differences in scanners, field strengths, pulse sequences and post-processing. The objective of this multi-centre study was therefore to investigate the sources and scale of variation in DTI parameters. This would be achieved in two steps: first by establishing intra- and inter-site variation in DTI parameters across multiple sites using standardised isotropic phantoms and product pulse sequences to evaluate scanner-related differences, and second by adopting specially designed cardiac DTI pulse sequences for evaluation of pulse sequence-related differences. In this abstract, we present the first set of data from eleven participating cardiac DTI sites using twelve clinical scanners.Methods
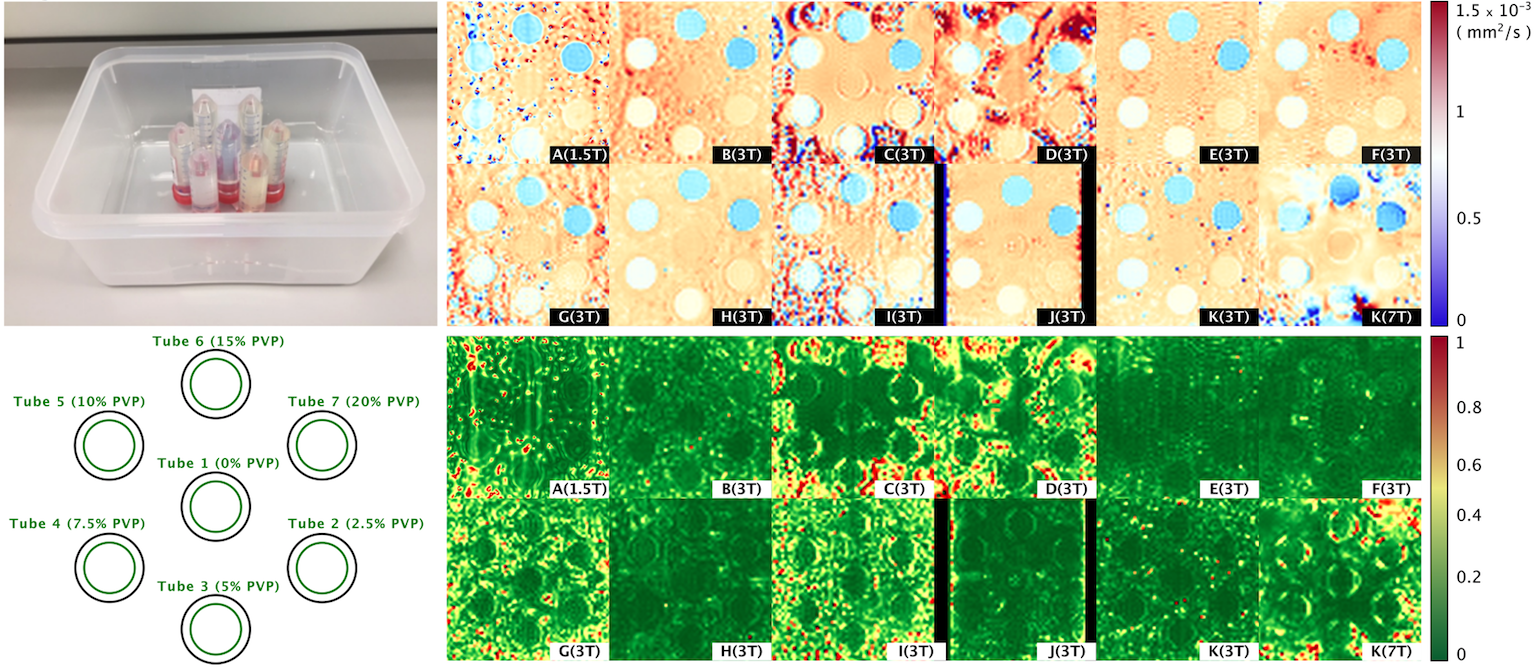
Site and scanner information: Philips (N=1) and Siemens (N=11); 1.5T (N=1), 3T (N=10) and 7T (N=1). Phantoms comprising 7 tubes filled with 0 - 20% polyvinylpyrrolidone (PVP)5 were prepared at a single site and shipped to participating sites (Figure 1). The phantoms were chilled in ice water and imaged at 0°C. DTI scans were performed using product spin echo EPI with parameters matching typical cardiac DTI protocols: TR / TE = 3000 / 85 ms, in-plane resolution = 2.5mm, slices = 3, thickness = gap = 8mm, blow= 0 s/mm2, bhigh= 450 s/mm2, number of diffusion directions = 6, bandwidth ~3000Hz, parallel imaging = 2x, and triggered with simulated ECG = 60 bpm. A second scan was performed under the same conditions on a different day within 30 days. Data storage and management were performed using the Human Heart Project, an online platform for heart imaging research6,7. CMRDiffTools was used for image processing, including automatic tube segmentation, tensor fitting, and calculation of MD and FA. To obtain a reference diffusivity (Dref), the self-diffusion of water as measured using an independent non-MR technique, was extrapolated to 0°C using a 2nd order polynomial fit8.Results
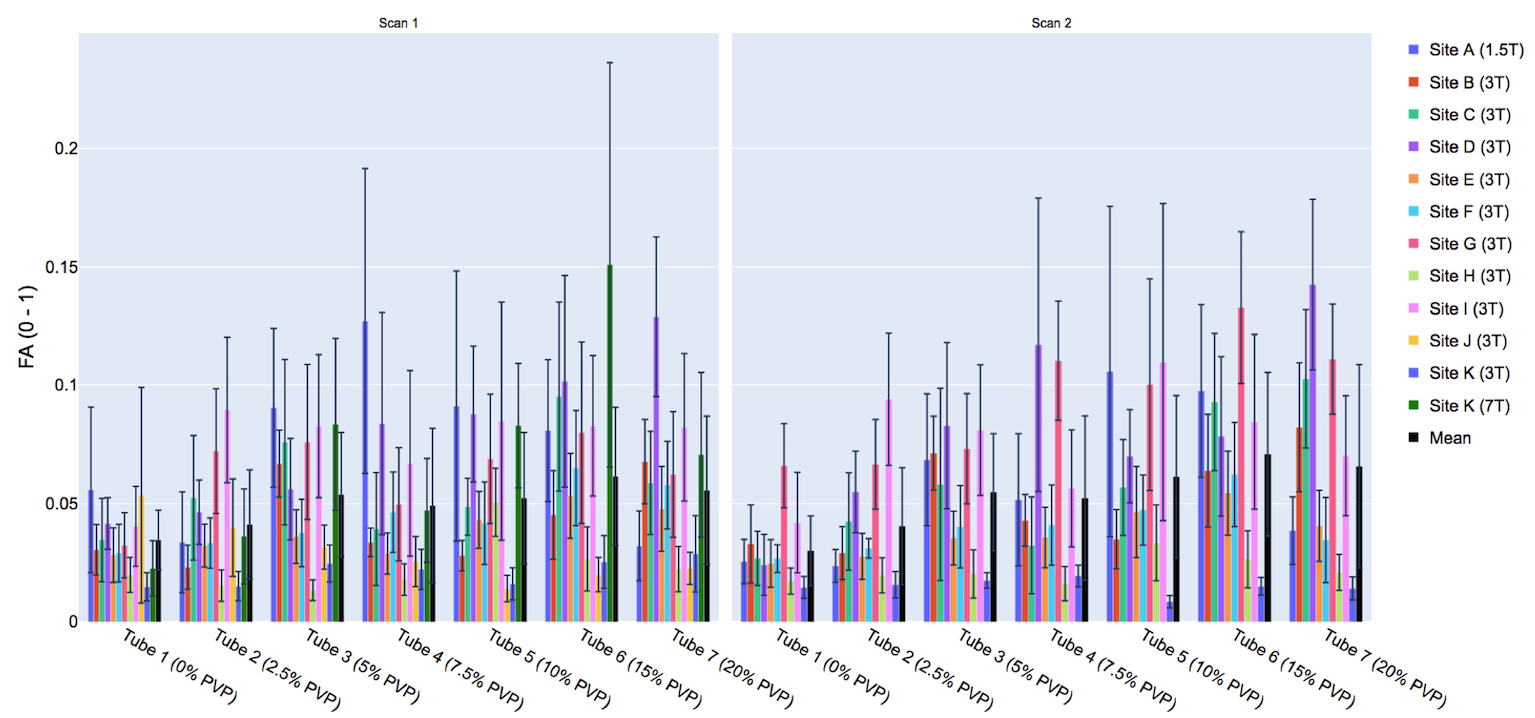
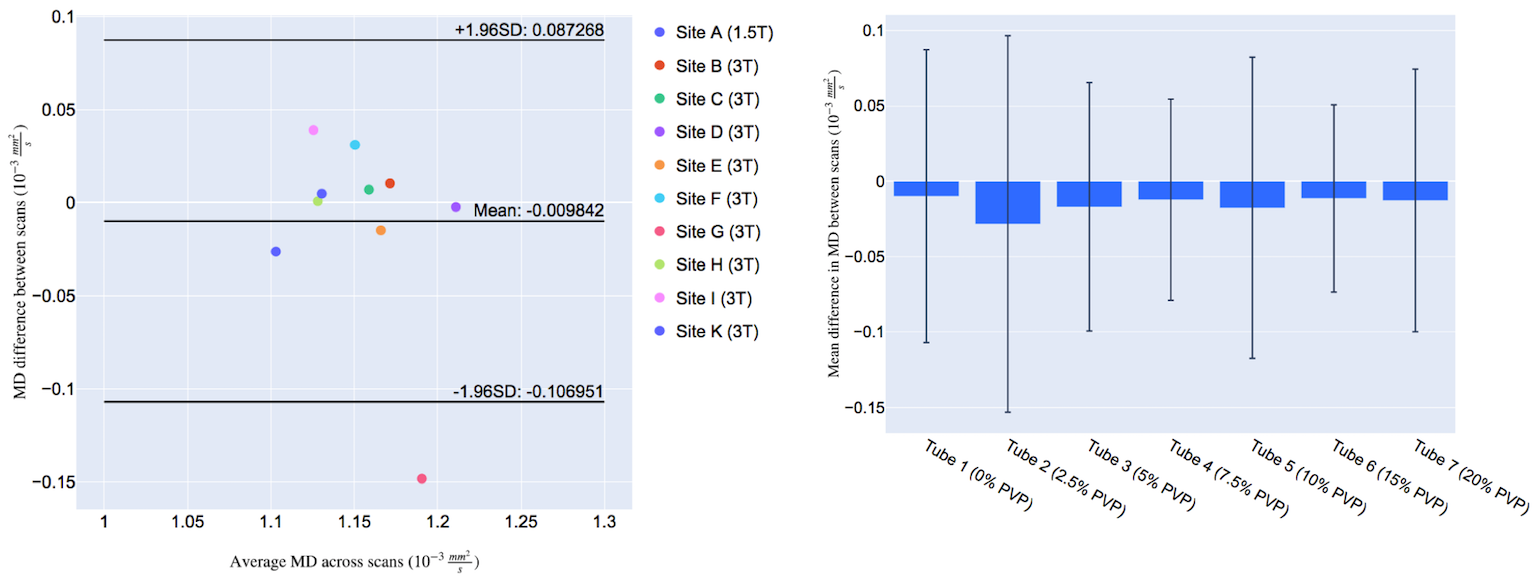
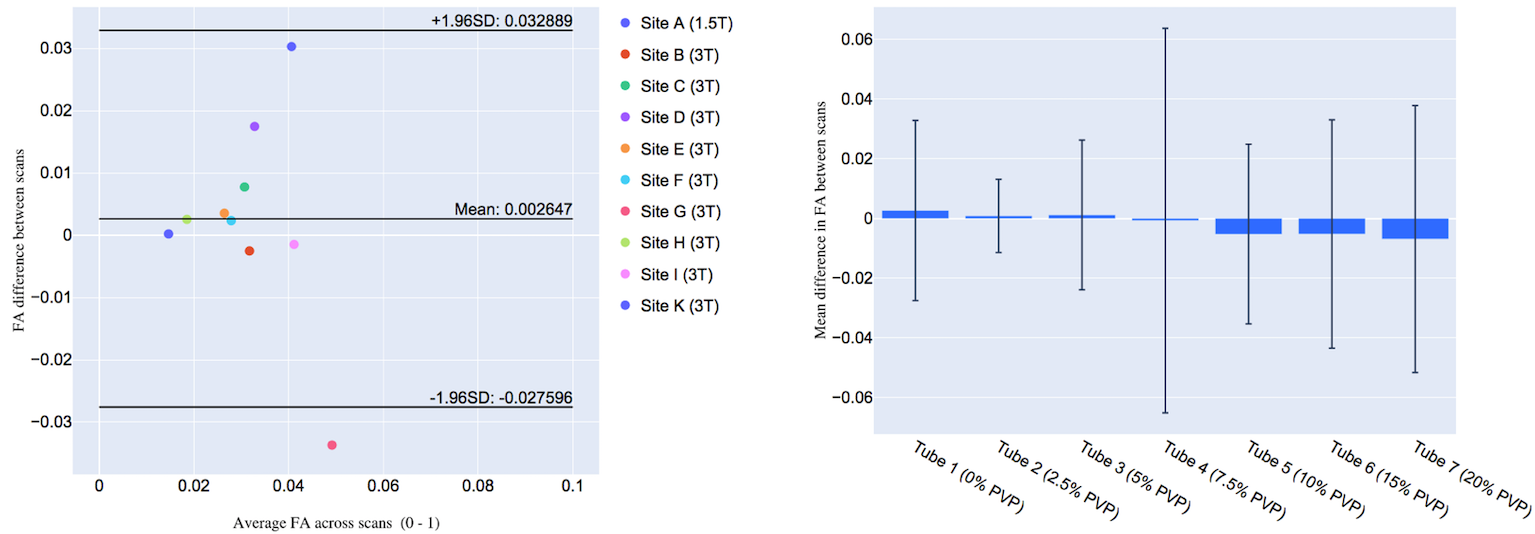
Representative MD and FA maps (Figure 1), and MD and FA across tubes, scanners and scans are shown (Figures 2 and 3). At 0% PVP, the average MD (mean ± SD across scanners) at Scans 1 and 2 were (1.149 ± 0.032) × 10-3 mm2/s and (1.159 ± 0.049) × 10-3 mm2/s respectively, while the coefficient of variation (CV) at Scan 1 was 1.9 ± 1.4%; the average FA at Scans 1 and 2 were 0.035 ± 0.013 and 0.030 ± 0.015 respectively. Bland-Altman plots of MD and FA across two scans are shown (Figures 4 and 5). At 0% PVP, the mean difference of MD and FA were (-0.010 ± 0.098) × 10-3 mm2/s (mean ± 1.96SD) and 0.003 ± 0.030 respectively. Ground truth diffusivity Dref(H2O), corresponding to 0% PVP, extrapolated from Mills8 was 1.113 × 10⁻³ mm2/s. B1 inhomogeneity was found to be an issue at 7T as can be seen from Figure 1, and the 7T data were excluded from Figures 4 and 5 and the Results. Scan 2 data from Site J (3T) were not available.Discussion
One prerequisite for the establishment of cardiac DTI-based biomarkers is the assessment of their sources of variation. We present initial results, acquired on 12 clinical scanners with a standardised phantom, acquisition, and post-processing pipeline. The average MD in the 0% PVP solution was 3.7% higher than Dref(H2O). This may stem from convection of the liquid solutions, which may be mitigated by using non-zero low b-values. The CV of MD was lower compared to a previous study optimising brain DTI involving eight scanners9, pointing to potentially better temperature control in this study. The average FA was lower than the same previous study, suggesting comparable or better signal-to-noise ratio and gradient calibration. The phantom was not specially developed for 7T scanners and B1 inhomogeneity was found to be an issue at 7T with this phantom design, resulting in outliers in the data. Overall, we demonstrated good baseline inter- and intra-site reproducibility in an isotropic diffusion phantom using product diffusion sequences with scan parameters matching typical cardiac DTI scans. However, it should be noted that the product sequences used here were not motion-compensated and therefore unsuitable for in vivo studies10. The variation in MD and FA reported in the cardiac DTI literature exceeds what was measured here, pointing to the additional impact of other variables in vivo, such as pulse sequences and diffusion times3,11. Future work will therefore investigate the additional variation arising from the use of site-specific pulse sequences designed specifically for in vivo cardiac DTI.Acknowledgements
References
1. Wei H, Viallon M, Delattre BM, Moulin K, Yang F, Croisille P and Zhu Y. Free-breathing diffusion tensor imaging and tractography of the human heart in healthy volunteers using wavelet-based image fusion. IEEE Trans Med Imaging. 2015;34:306-16.
2. Moulin K, Croisille P, Feiweier T, Delattre BM, Wei H, Robert B, Beuf O and Viallon M. In vivo free-breathing DTI and IVIM of the whole human heart using a real-time slice-followed SE-EPI navigator-based sequence: A reproducibility study in healthy volunteers. Magn Reson Med. 2016;76:70-82.
3. von Deuster C, Stoeck CT, Genet M, Atkinson D and Kozerke S. Spin echo versus stimulated echo diffusion tensor imaging of the in vivo human heart. Magn Reson Med. 2016;76:862-72.
4. Stoeck CT, Kalinowska A, von Deuster C, Harmer J, Chan RW, Niemann M, Manka R, Atkinson D, Sosnovik DE, Mekkaoui C and Kozerke S. Dual-phase cardiac diffusion tensor imaging with strain correction. PLoS One. 2014;9:e107159.
5. Pierpaoli C, Sarlls J, Basser PJ and Horkay F. Polyvinylpyrrolidone (PVP) water solutions as isotropic phantoms for diffusion MRI studies. International Society of Magnetic Resonance in Medicine. 2009:1414.
6. CREATIS. http://humanheart-project.creatis.insa-lyon.fr/.
7. Romero WA, Viallon M, Froeling M, Stoeck CT, Kozerke S, Tunnicliffe E, Scott AD, Ferreira P, Aliotta E, Ennis D, Moulin K and Croisille P. CMRDiffTools: A Processing and Analysis Tool for Cardiac Diffusion MR images. International Society of Magnetic Resonance in Medicine. 2018:4778.
8. Mills R. Self-Diffusion in Normal and Heavy-Water in Range 1-45 Degrees. J Phys Chem-Us. 1973;77:685-688.
9. Grech-Sollars M, Hales PW, Miyazaki K, Raschke F, Rodriguez D, Wilson M, Gill SK, Banks T, Saunders DE, Clayden JD, Gwilliam MN, Barrick TR, Morgan PS, Davies NP, Rossiter J, Auer DP, Grundy R, Leach MO, Howe FA, Peet AC and Clark CA. Multi-centre reproducibility of diffusion MRI parameters for clinical sequences in the brain. Nmr Biomed. 2015;28:468-85.
10. Stoeck CT, Scott AD, Ferreira PF, Tunnicliffe EM, Teh I, Nielles-Vallespin S, Moulin K, Sosnovik DE, Viallon M, Croisille P, Kozerke S, Firmin DN, Ennis DB and Schneider JE. Motion-Induced Signal Loss in In Vivo Cardiac Diffusion-Weighted Imaging. J Magn Reson Imaging. 2019.
11. Scott AD, Nielles-Vallespin S, Ferreira PF, Khalique Z, Gatehouse PD, Kilner P, Pennell DJ and Firmin DN. An in-vivo comparison of stimulated-echo and motion compensated spin-echo sequences for 3 T diffusion tensor cardiovascular magnetic resonance at multiple cardiac phases. J Cardiovasc Magn Reson. 2018;20:1.
Figures