2052
Optimizing Myocardium T2* Mapping using a Novel Multi-Dimension Integration (MDI) Method1Department of Radiology, Zhongnan Hospital of Wuhan University, Wuhan University, Wuhan, China, 2United Imaging Healthcare, Shanghai, China, 3UIH America Inc., Houston, TX, United States
Synopsis
Traditional myocardium T2* mapping based on curve fitting methods generally suffers from artifacts, suboptimal SNR and poor reproducibility. This study aimed to evaluate the benefits of a novel multi-dimension integration (MDI) method on myocardium T2* mapping. Five patients with known myocardial infarction were recruited. The MDI method was compared with curve fitting methods based on exponential and linear models. Results showed our MDI method had higher image quality and diagnose sensitivity, as well as much faster computation speed than curve fitting methods. MDI has the potential to provide accurate and reliable measurements for myocardial iron content.
Introduction
Traditional myocardium T2* mapping methods generally adopt the curve fitting strategy, which require a separate step to combine the data from individual channels into a single composite image, and suffer from artifacts, suboptimal SNR and poor reproducibility [1-4]. Recently, a novel multi-dimension integration (MDI) method was proposed to achieve high SNR T2* mapping without the need of coil combination [5, 6]. This study aimed to demonstrate the implementation and evaluate the benefits of MDI on myocardium T2* mapping.Methods
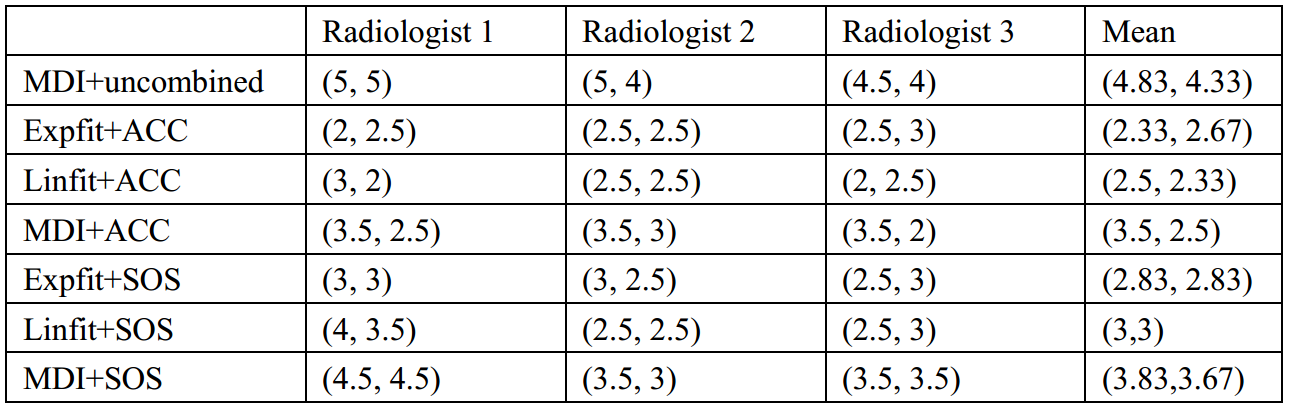
Five patients with known myocardial infarction were recruited in this study with signed informed consents. A 2D dark blood eight-echo GRE sequence was used on a 3.0T scanner (uMR 790, United Imaging Healthcare, Shanghai) with a 12-channel body coil and following parameters: FOV=360x320mm2, matrix=192x75, slice thickness=8mm, flip angle=45°, TR=12.69ms, TE=1.4/2.79/4.18/5.57/6.96/8.35/9.74/11.13ms, Band width=800Hz/Pixel. Uncombined dataset of each individual channel and combined dataset calculated based on the ACC (Adaptive Coil Combination)and SOS(Sum Of Square)algorithm were firstly obtained [7]. Myocardium T2* mappings were then reconstructed: 1) using the MDI method with uncombined and combined datasets, or 2) using exponential and linear curve fitting methods with combined datasets. A total of 7 resultant T2* maps were computed and compared. Native T1 mapping sequence was used to locate the infract regions. Visual evaluation of image quality and diagnose sensitivity scores of T2* maps were independently evaluated in anonymized and randomized fashion by three experienced radiologists using a 5-point Likert scale (1 as unacceptable and 5 as perfect). Computation times of each T2* mapping method were also calculated and compared.Results
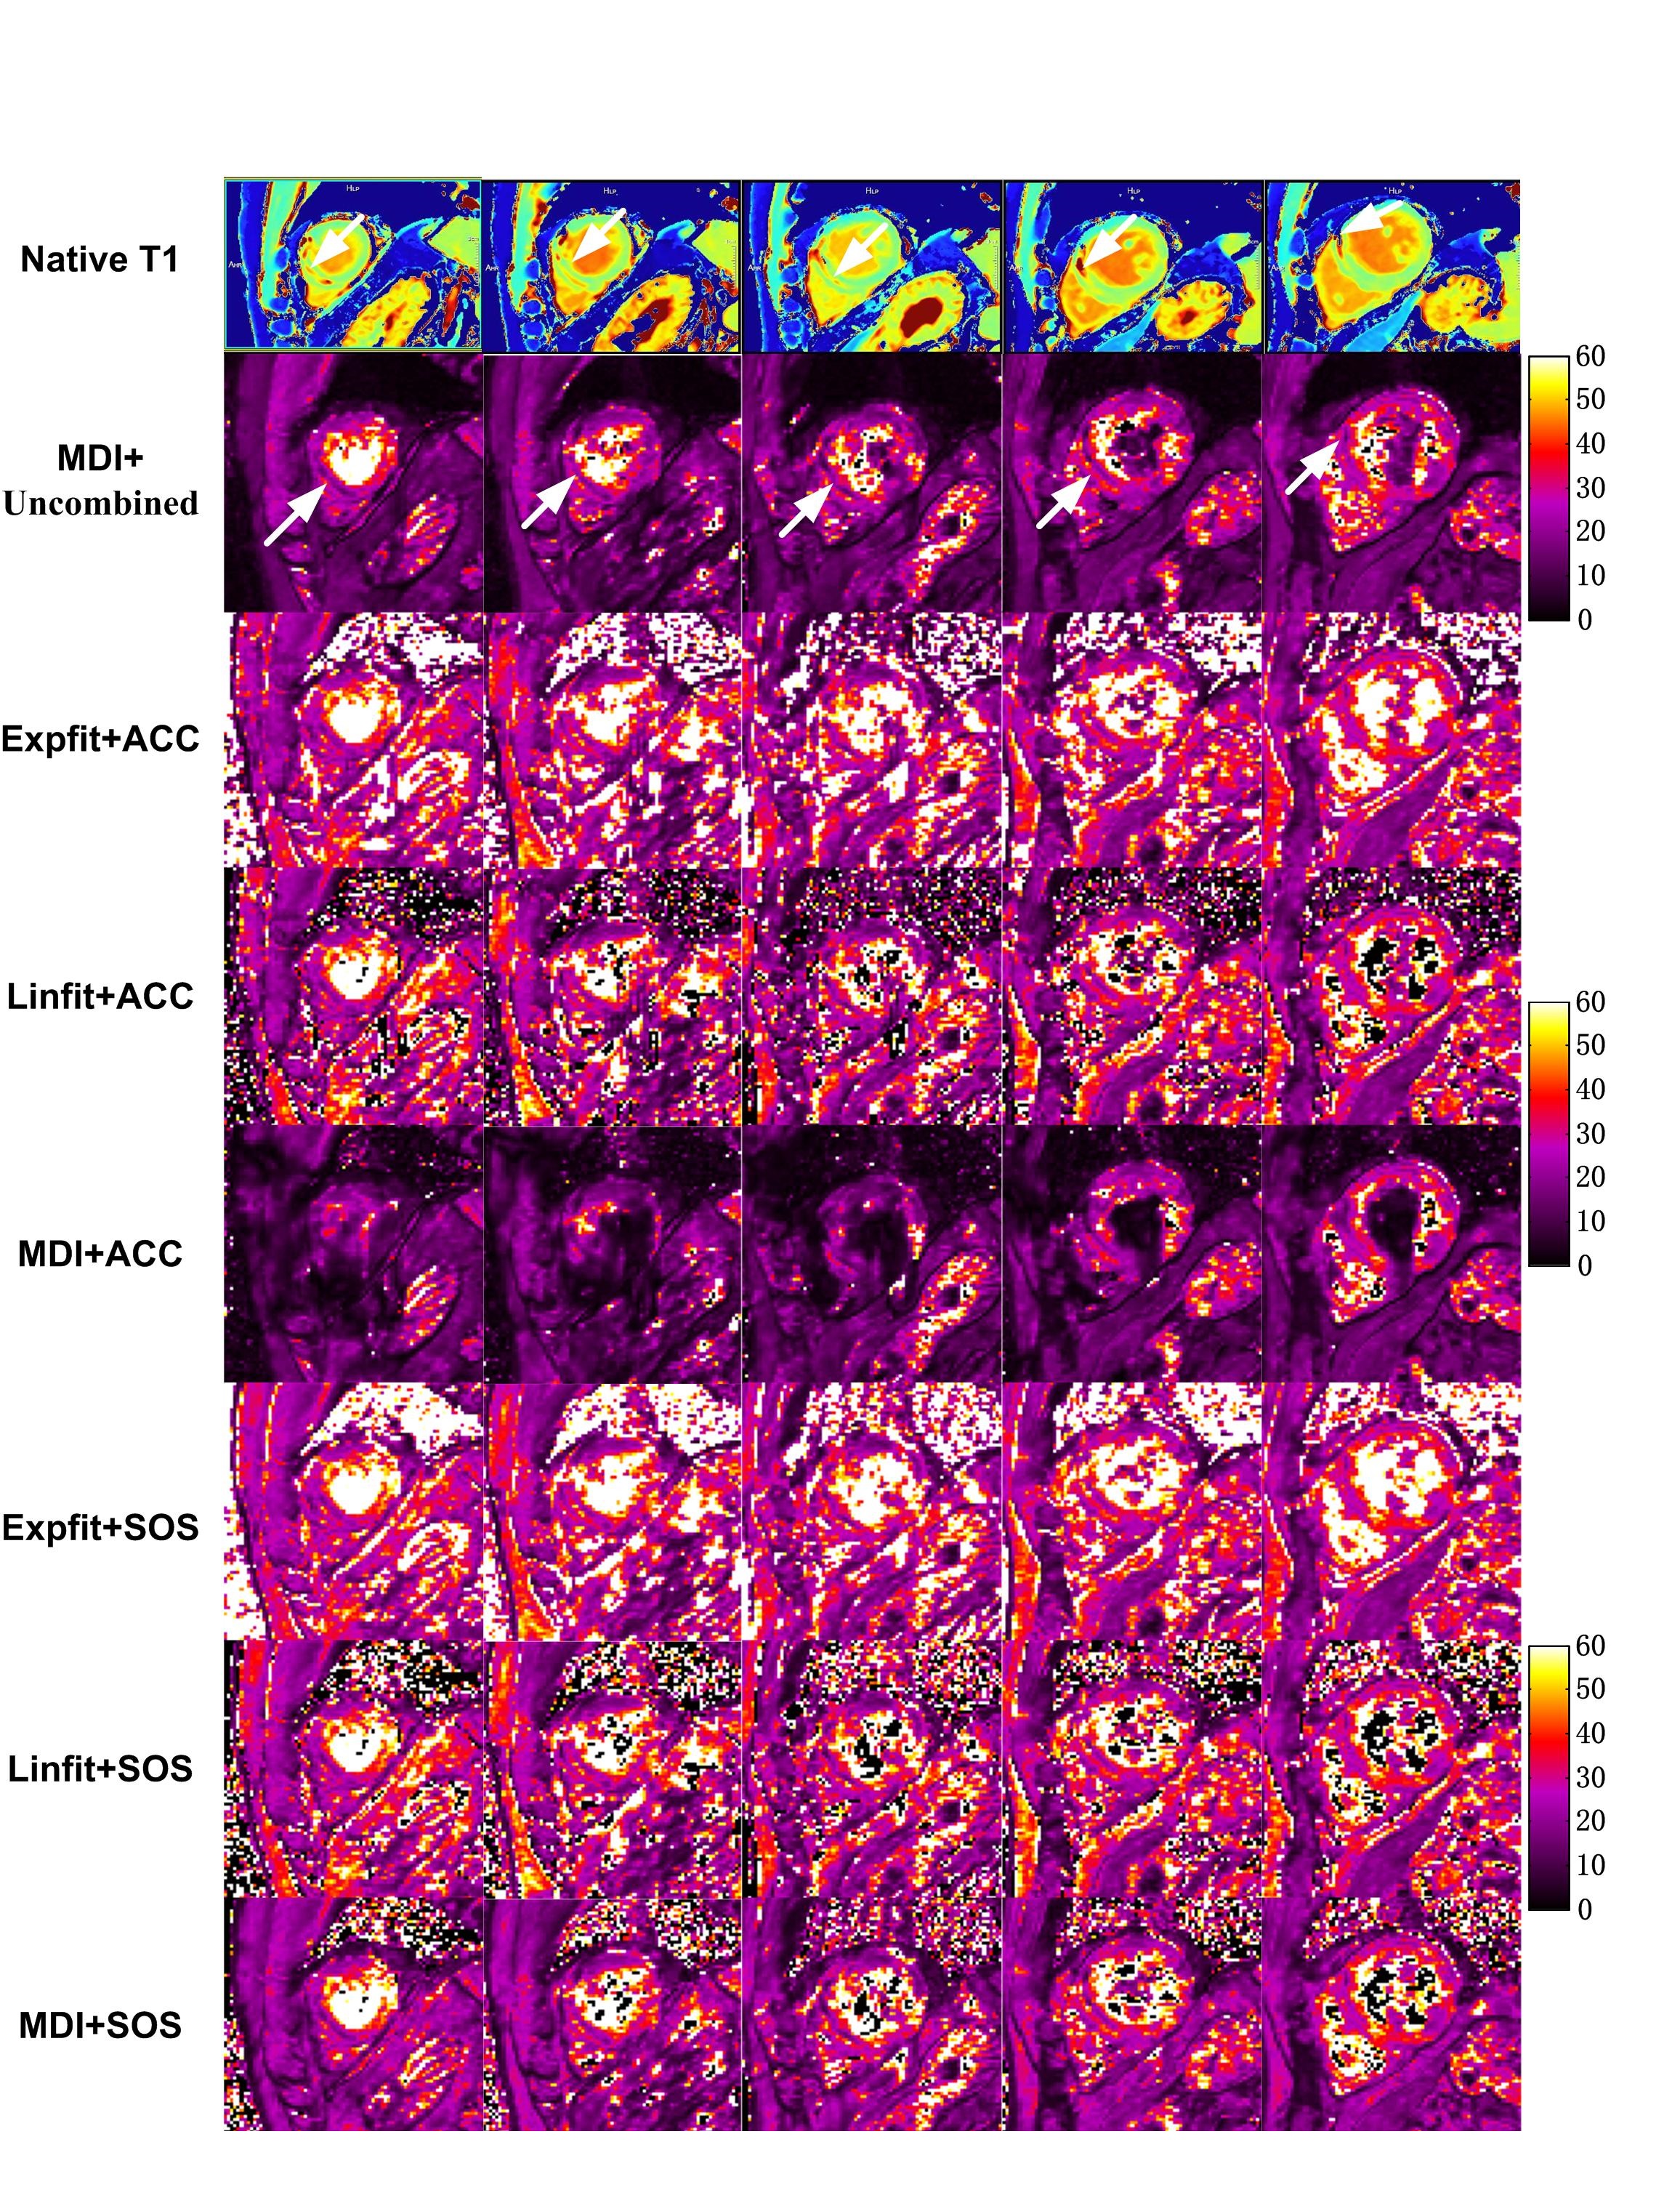
Figure 1 shows three short-axis slices of T2* maps of a typical patient with acute myocardial infarction. Decreased myocardium T2* value was found similar among all T2* maps. As showed in Table 1, even when using the ACC or SOS combined images, the MDI method already showed higher image quality and diagnose sensitivity scores than curve fitting methods. And the MDI method using uncombined dataset further yielded the highest image quality (score=4.83) and diagnose sensitivity (score=4.33). The computation time per slice was 7ms for the MDI method, 65s for the exponential fitting method and 80ms for the linear fitting method.Discussion and Conclusion
We have demonstrated a novel MDI method for myocardium T2* mapping. Compared to traditional curve fitting methods, the MDI method using uncombined dataset as input offers significantly higher image quality and diagnose sensitivity, as well as faster computation speed. These findings agree with previous studies [5, 6], which might be due to no multi-channel combination operation in the MDI method, thus leads to minimal coil sensitivity effects and noise propagation. Our myocardium T2* mapping based on MDI has the potential for more accurate measurements for myocardial iron content.Acknowledgements
This work was supported by the National key research and development plan of China (Project 2017YFC0108803).The authors declare no conflict of interest.References
[1] Mavrogeni SI, Gotsis ED, Markussis V, et al. T2 relaxation time study of iron overload in b- thalassemia. MAGMA. 1998 Aug;6(1):7-12.
[2] Bidhult S, Xanthis CG, et al. Validation of a new T2* algorithm and its uncertainty value for cardiac and liver iron load determination from MRI magnitude images. Magn Reson Med. 2016 Apr;75(4):1717-29.
[3] Walsh DO, Gmitro AF, Marcellin MW. Adaptive reconstruction of phased array MR imagery. Magn Reson Med. 2000 May;43(5):682-90.
[4] Zhou K, Bao S, Hennig J, and Zaitsev M. Coil Combination Method for Multiple-Echo Sequences and PSF Mapping. In Proceedings 17th Scientific Meeting, International Society for Magnetic Resonance in Medicine. 2009. Montreal.
[5] Yongquan, Y. and L. Jingyuan. MR Relaxivity Mapping using multi-dimensional integrated (MDI) complex signal ratio. In Proceedings 27th Scientific Meeting, International Society for Magnetic Resonance in Medicine. 2019. Montreal.
[6] Lyu J, Liang D, Zhang C, Nakarmi U, and Ying L, A Blind Deconvolution Approach to Fast MR T2 Mapping. In Proceedings 25th Scientific Meeting, International Society for Magnetic Resonance in Medicine. 2017. Honolulu.
[7] Gol Gungor D, Potter LC. A subspace-based coil combination method for phased-array magnetic resonance imaging. Magn Reson Med, 2016 Feb;75(2):762-74.
Figures